Case Reports
. 2020 Aug;296(2):E119-E120.
doi: 10.1148/radiol.2020201187. Epub 2020 Mar 31.

COVID-19-associated Acute Hemorrhagic Necrotizing Encephalopathy: Imaging Features

Affiliations
Case Reports

COVID-19-associated Acute Hemorrhagic Necrotizing Encephalopathy: Imaging Features

Neo Poyiadji et al. Radiology. 2020 Aug.
No abstract available


Figures

Figure 1a:
Figure 1a:
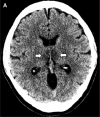
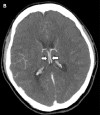
A, Image from noncontrast head CT demonstrates symmetric hypoattenuation within the bilateral medial thalami (arrows). B, Axial CT venogram demonstrates patency of the cerebral venous vasculature, including the internal cerebral veins (arrows). C, Coronal reformat of aCT angiogram demonstrates normal appearance of the basilar artery and proximal posterior cerebral arteries.
Figure 1b:
Figure 1b:
A, Image from noncontrast head CT demonstrates symmetric hypoattenuation within the bilateral medial thalami (arrows). B, Axial CT venogram demonstrates patency of the cerebral venous vasculature, including the internal cerebral veins (arrows). C, Coronal reformat of aCT angiogram demonstrates normal appearance of the basilar artery and proximal posterior cerebral arteries.
Figure 1c:
Figure 1c:
A, Image from noncontrast head CT demonstrates symmetric hypoattenuation within the bilateral medial thalami (arrows). B, Axial CT venogram demonstrates patency of the cerebral venous vasculature, including the internal cerebral veins (arrows). C, Coronal reformat of aCT angiogram demonstrates normal appearance of the basilar artery and proximal posterior cerebral arteries.
Figure 2a:
Figure 2a:
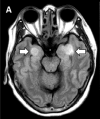
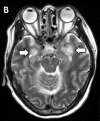
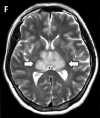
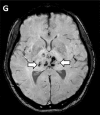
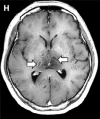
MRI images demonstrate T2 FLAIR hyperintensity within the bilateral medial temporal lobes and thalami (A, B, E, F) with evidence of hemorrhage indicated by hypointense signal intensity on susceptibility-weighted images (C, G) and rim enhancement on postcontrast images (D, H).
Figure 2b:
Figure 2b:
MRI images demonstrate T2 FLAIR hyperintensity within the bilateral medial temporal lobes and thalami (A, B, E, F) with evidence of hemorrhage indicated by hypointense signal intensity on susceptibility-weighted images (C, G) and rim enhancement on postcontrast images (D, H).
Figure 2c:
Figure 2c:
MRI images demonstrate T2 FLAIR hyperintensity within the bilateral medial temporal lobes and thalami (A, B, E, F) with evidence of hemorrhage indicated by hypointense signal intensity on susceptibility-weighted images (C, G) and rim enhancement on postcontrast images (D, H).
Figure 2d:
Figure 2d:
MRI images demonstrate T2 FLAIR hyperintensity within the bilateral medial temporal lobes and thalami (A, B, E, F) with evidence of hemorrhage indicated by hypointense signal intensity on susceptibility-weighted images (C, G) and rim enhancement on postcontrast images (D, H).
Figure 2e:
Figure 2e:
MRI images demonstrate T2 FLAIR hyperintensity within the bilateral medial temporal lobes and thalami (A, B, E, F) with evidence of hemorrhage indicated by hypointense signal intensity on susceptibility-weighted images (C, G) and rim enhancement on postcontrast images (D, H).
Figure 2f:
Figure 2f:
MRI images demonstrate T2 FLAIR hyperintensity within the bilateral medial temporal lobes and thalami (A, B, E, F) with evidence of hemorrhage indicated by hypointense signal intensity on susceptibility-weighted images (C, G) and rim enhancement on postcontrast images (D, H).
Figure 2g:
Figure 2g:
MRI images demonstrate T2 FLAIR hyperintensity within the bilateral medial temporal lobes and thalami (A, B, E, F) with evidence of hemorrhage indicated by hypointense signal intensity on susceptibility-weighted images (C, G) and rim enhancement on postcontrast images (D, H).
Figure 2h:
Figure 2h:
MRI images demonstrate T2 FLAIR hyperintensity within the bilateral medial temporal lobes and thalami (A, B, E, F) with evidence of hemorrhage indicated by hypointense signal intensity on susceptibility-weighted images (C, G) and rim enhancement on postcontrast images (D, H).

Comment in

References

    1. Coronavirus disease (COVID-19) Pandemic . Geneva: World Health Organization, March 23, 2020 (https://www.who.int/emergencies/diseases/novel-coronavirus-2019).
    1. Filatov A, Sharma P, Hindi F, et al. Neurological complications of coronavirus (COVID-19): encephalopathy. Cureus 12(3): e7352. DOI 10.7759/cureus.7352. - PMC - PubMed
    1. Rossi A. Imaging of acute disseminated encephalomyelitis. Neuroimaging Clinics, 18(1): 149-161. - PubMed
    1. Mehta P, McAuley DF, Brown M, et al. COVID-19: consider cytokine storm syndromes and immunosuppression. Lancet 2020 Mar 16 pii: S0140-6736(20)30628-0. doi: 10.1016/S0140-6736(20)30628-0. - PMC - PubMed
    1. Wong AM, Simon EM, Zimmerman RA, Wang HS, Toh CH, Ng SH. Acute necrotizing encephalopathy of childhood: correlation of MR findings and clinical outcome. AJNR 2006;27(9):1919-1923. - PMC - PubMed

Publication types

LinkOut - more resources