. 2020 Mar 30;21(1):265.
doi: 10.1186/s12864-020-6684-z.

Transcriptomic analysis of marine endophytic fungi extract identifies highly enriched anti-fungal fractions targeting cancer pathways in HepG2 cell lines

Affiliations

Transcriptomic analysis of marine endophytic fungi extract identifies highly enriched anti-fungal fractions targeting cancer pathways in HepG2 cell lines

Ethel Juliet Blessie et al. BMC Genomics. .

Abstract

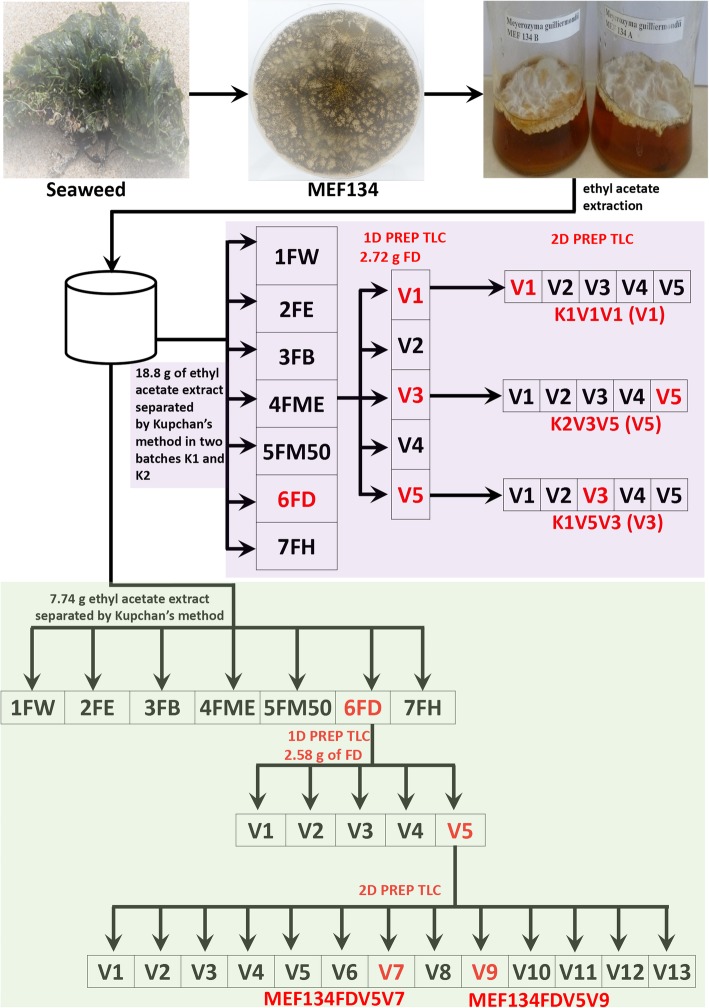
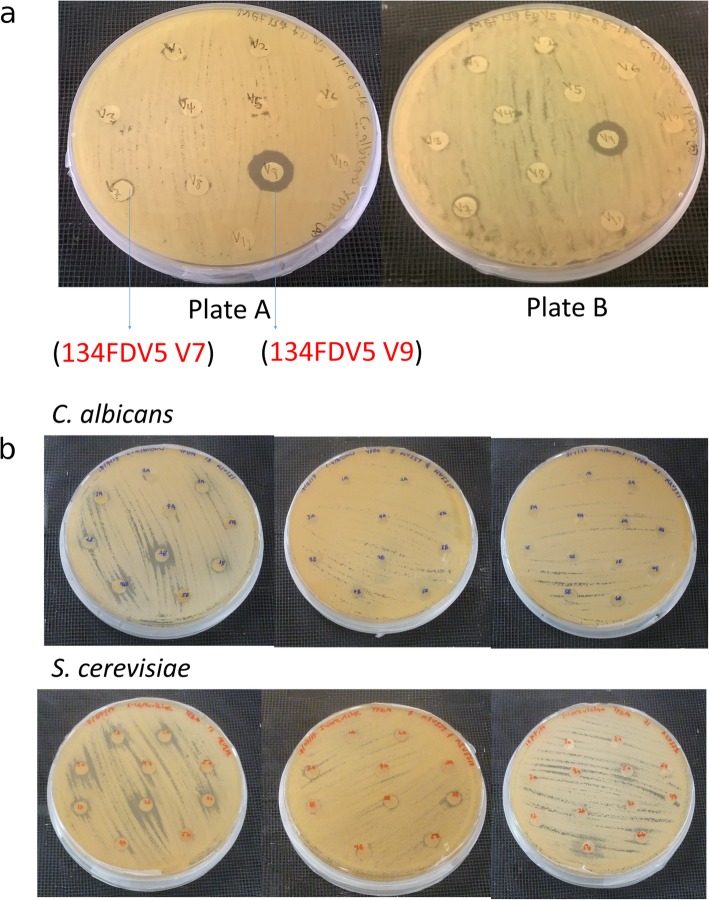
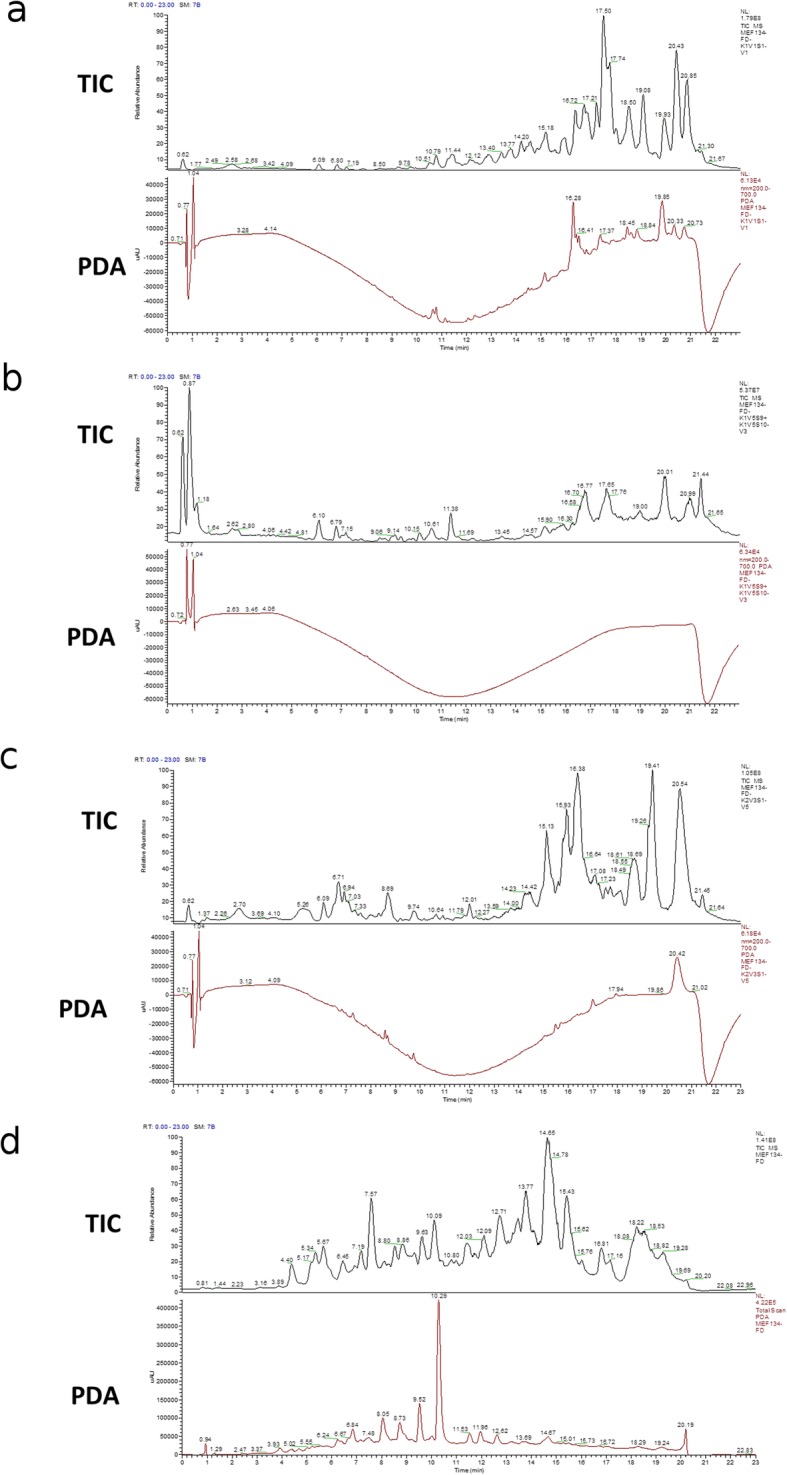
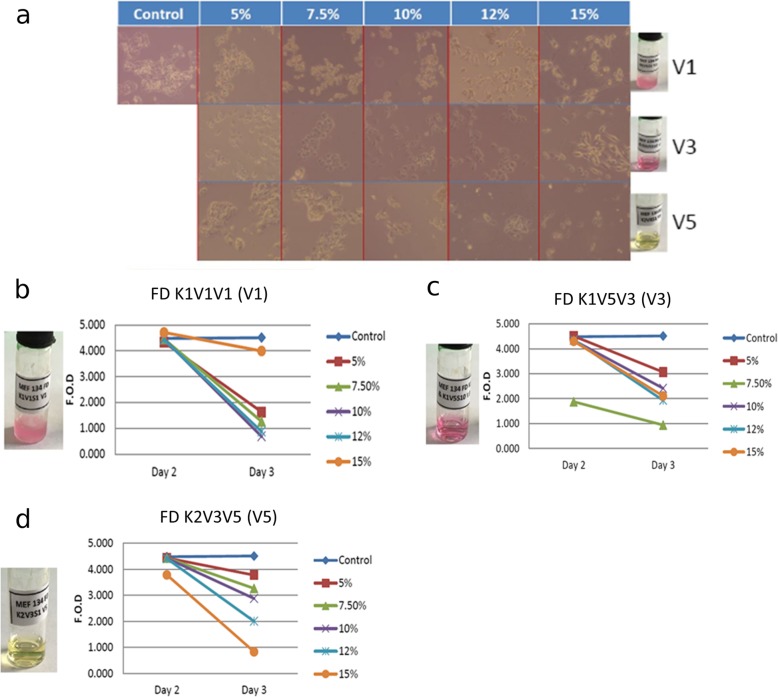
Background: Marine endophytic fungi (MEF) are good sources of structurally unique and biologically active secondary metabolites. Due to the increase in antimicrobial resistance, the secondary metabolites from MEF ought to be fully explored to identify candidates which could serve as lead compounds for novel drug development. These secondary metabolites might also be useful for development of new cancer drugs. In this study, ethyl acetate extracts from marine endophytic fungal cultures were tested for their antifungal activity and anticancer properties against C. albicans and the human liver cancer cell line HepG2, respectively. The highly enriched fractions were also analyzed by high performance liquid chromatography coupled with high resolution mass spectrometry (HPLC-HRMS) and their effect on the HepG2 cells was assessed via transcriptomics and with a proliferation assay.

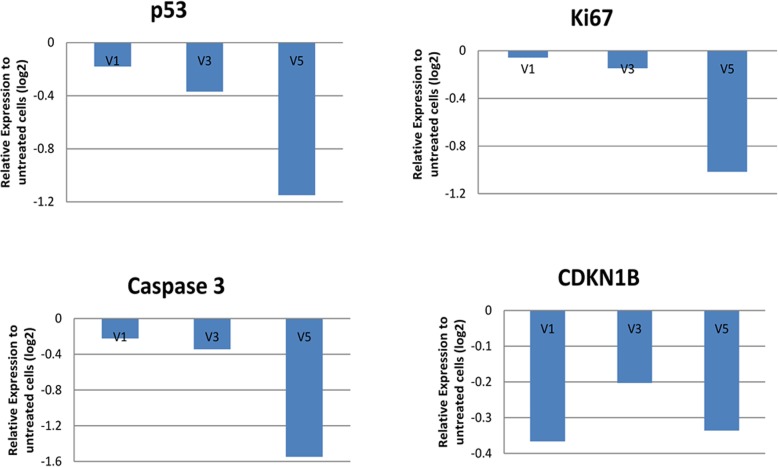
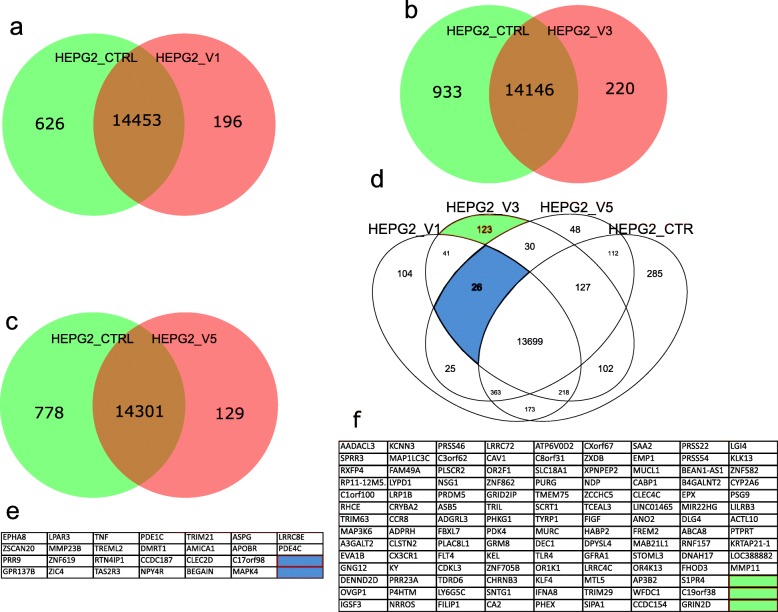
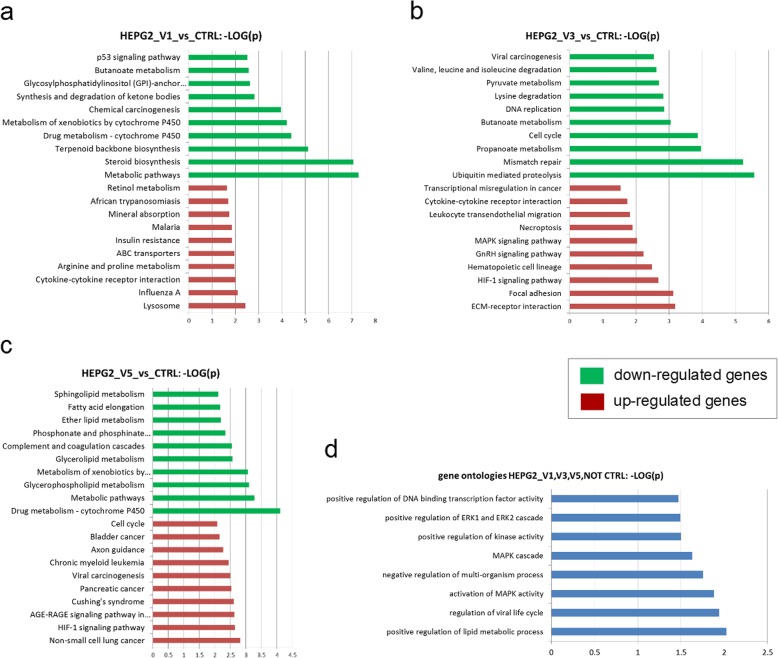
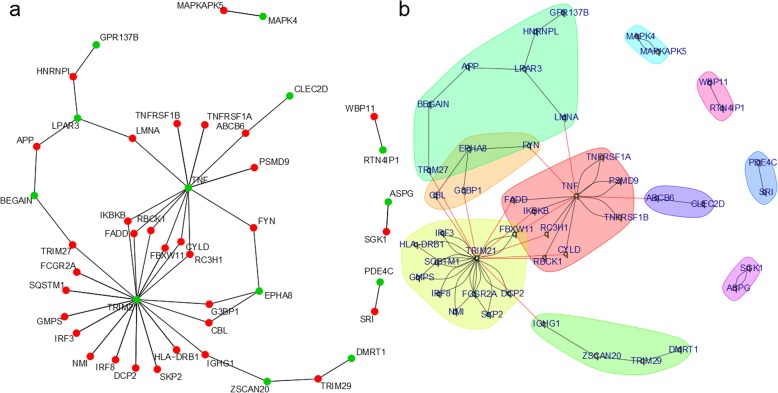
Results: We demonstrated that the fractions could reduce proliferation in HepG2 cells. The detailed transcriptome analysis revealed regulation of several cancer- and metabolism-related pathways and gene ontologies. The down-regulated pathways included, cell cycle, p53 signaling, DNA replication, sphingolipid metabolism and drug metabolism by cytochrome P450. The upregulated pathways included HIF-1 signaling, focal adhesion, necroptosis and transcriptional mis-regulation of cancer. Furthermore, a protein interaction network was constructed based on the 26 proteins distinguishing the three treatment conditions from the untreated cells. This network was composed of central functional components associated with metabolism and cancer such as TNF, MAPK, TRIM21 and one component contained APP.

Conclusions: The purified fractions from MEF investigated in this study showed antifungal activity against C. albicans and S. cerevisiae alone or both and reduced proliferation of the human liver cancer cell line HepG2 implicating regulation of several cancer- and metabolism-related pathways. The data from this study could be instrumental in identifying new pathways associated with liver cancer anti-proliferative processes which can be used for the development of novel antifungal and anti-cancer drugs.

Keywords: Anti-cancer extract; Anti-fungal resistance; Cancer pathways; HepG2; Marine endophytic fungi; Proliferation; Protein interaction network; Seaweed.


Conflict of interest statement

The authors declare no conflict of interest. The funders had no role in the design of the study; in the collection, analyses, or interpretation of data; in the writing of the manuscript, or in the decision to publish the results.

Figures

Fig. 1
Fig. 1
Schematic representation of the partial purification of crude extracts from MEF 134. MEF 134 was isolated from seaweed and was cultured in 20 L of broth. The crude extract obtained from the culture was separated by Kuchan fractionation and two rounds of preparative TLC. Samples marked in red were selected based on their antifungal activities and were further analysed using transcriptomics and mass spectromtery
Fig. 2
Fig. 2
Representative images showing growth inhibition of C. albicans and S. cerevisiae by the antifungal fractions from MEF 134. a Growth inhibition of C. albicans by FDV5V7 and FDV5V9 fractions. b Plate cultures showing the antifungal activities of FDK1V1V1, FDK1V5V3 and FDK2V3V5 against S. cerevisiae and C. albicans
Fig. 3
Fig. 3
HPLC-HRMS full scan analysis of selected DCM fractions from the second round of preparative TLC analysis. The fractions that were used for the analysis were FD K1V1V1 (a), FD K1V5V3 (b), FD K2V3V5 (c) and the DCM fraction from the MEF 134 crude extract (d). Spectra from total ion chromatogram (TIC) and photodiode array (PDA) detectors are shown for each fraction
Fig. 4
Fig. 4
Inhibition of proliferation of HepG2 cells by the three partially purified fractions from the MEF 134 crude extracts. a Representative light microscopy images of HepG2 cells treated with the MEF 134 fractions. The dose of each fraction used for the assay is indicated in percentages (w/v). b-d Quantification of the anti-proliferative effect of the fractions. The fractions used for the assay were FD K1V1V1 (V1), FD K1V5V3 (V3) and FD K2V3V5 (V5). All measurements were performed in biological duplicates. All three fractions had antifungal activity against S. cerevisiae only
Fig. 5
Fig. 5
Reduction in the expression of markers of viability in HepG2 cells treated with MEF 134 fractions. HepG2 cells were treated with 2% of either FD K1V1V1 (V1), FD K1V5V3 (V3) or FD K2V3V5 (V5) and mRNA expression for the indicated genes was determined by qRT-PCR. Experiments were performed in biological duplicates. Gene expression was normalized to the RPL37A gene and fold change was calculated relative to the untreated cells
Fig. 6
Fig. 6
Analysis of variability in transcriptome of untreated and treated HepG2 cells. a Clustering analysis of RMA-normalized microarray data from untreated and treated HepG2 cells. The clustering analysis was conducted using complete linkage as agglomeration method and Pearson correlation as similarity measure. b Correlation analysis of the three treatment conditions and the untreated HepG2 cells. The Pearson correlation coefficient between each treatment or untreated condition was estimated, as indicated in the table. All correlation coefficients were close to the possible maximum of 1 demonstrating a high overall similarity of the samples
Fig. 7
Fig. 7
Comparison of the number of HepG2 genes that were commonly expressed or uniquely expressed for each treatment condition and the untreated cells. a Comparison of V1-treated HepG2 cells and untreated HepG2 cells. b Comparison of V3-treated HepG2 and untreated HepG2 cells. c Comparison of V5-treated HepG2 cells and untreated HepG2 cells. d Four-way comparison of the number of HepG2 genes expressed in all three treatment conditions and the untreated cells. The segment marked blue represent the common gene expression signature for the treated and untreated HepG2 cells. Expressed genes were detected using a detection p value threshold of p < 0.05. e 26 genes related to the blue segment in (d) of expression in all treatments but not in control. f 123 genes expressed exclusively in V3 related to the green segment in (d)
Fig. 8
Fig. 8
KEGG pathways affected by treatment of HepG2 cells with partially purified fractions from MEF 134 extract. a Cellular pathways up-regulated or down-regulated in V1-treated cells relative to the untreated cells. b Cellular pathways upregulated or down-regulated in V3-treated cells relative to the untreated cells. c Cellular pathways upregulated or down-regulated in V5-treated cells relative to the untreated cells. In (a-c), green and red bars indicate overrepresentation of down-regulated and up-regulated genes, respectively. d Gene ontologies for the genes commonly expressed in all three treatment conditions. In (a-d), the bar charts show the negative logarithm (base 10) of the p-value; higher values correspond to higher significance. Overrepresentation of KEGG pathways and gene ontologies were analyzed using the hypergeometric test
Fig. 9
Fig. 9
Protein interaction networks activated by treatment of HepG2 cells with partially purified fractions from MEF 134 extract. a Interconnections of the commonly expressed genes in treated HepG2 cells to a network with interactions in the Biogrid database. Genes from the original 26 gene set are colored green while the genes added as Biogrid interactions are colored red. b Community clustering of the protein interaction network. The Biogrid database was used to construct protein interaction networks using the genes expressed in common in all treatments conditions (V1, V3 and V5) but not in the untreated HepG2 cells

References

    1. Kjer J, Debbab A, Aly AH, Proksch P. Methods for isolation of marine-derived endophytic fungi and their bioactive secondary products. Nat Protoc. 2010;5(3):479–490. doi: 10.1038/nprot.2009.233. - DOI - PubMed
    1. Pfaller MA. Antifungal drug resistance: mechanisms, epidemiology, and consequences for treatment. Am J Med. 2012;125(1 Suppl):S3–13. doi: 10.1016/j.amjmed.2011.11.001. - DOI - PubMed
    1. Dixon DM, Walsh TJ. Antifungal Agents. In: Baron S, Herausgeber. Medical Microbiology [Internet]. 4th Aufl. Galveston: University of Texas Medical Branch at Galveston; 1996 [zitiert 16. Juli 2018]. Verfügbar unter: http://www.ncbi.nlm.nih.gov/books/NBK8263/.
    1. Gao G, Chen L, Huang C. Anti-cancer drug discovery: update and comparisons in yeast, Drosophila, and zebrafish. Curr Mol Pharmacol. 2014;7(1):44–51. doi: 10.2174/1874467207666140702113629. - DOI - PMC - PubMed
    1. Foury F. Human genetic diseases: a cross-talk between man and yeast. Gene. 1997;195(1):1–10. doi: 10.1016/S0378-1119(97)00140-6. - DOI - PubMed

MeSH terms