

A key genomic signature associated with lymphovascular invasion in head and neck squamous cell carcinoma
- PMID: 32228488
- PMCID: PMC7106876
- DOI: 10.1186/s12885-020-06728-1
A key genomic signature associated with lymphovascular invasion in head and neck squamous cell carcinoma
Abstract
Background: Lymphovascular invasion (LOI), a key pathological feature of head and neck squamous cell carcinoma (HNSCC), is predictive of poor survival; however, the associated clinical characteristics and underlying molecular mechanisms remain largely unknown.
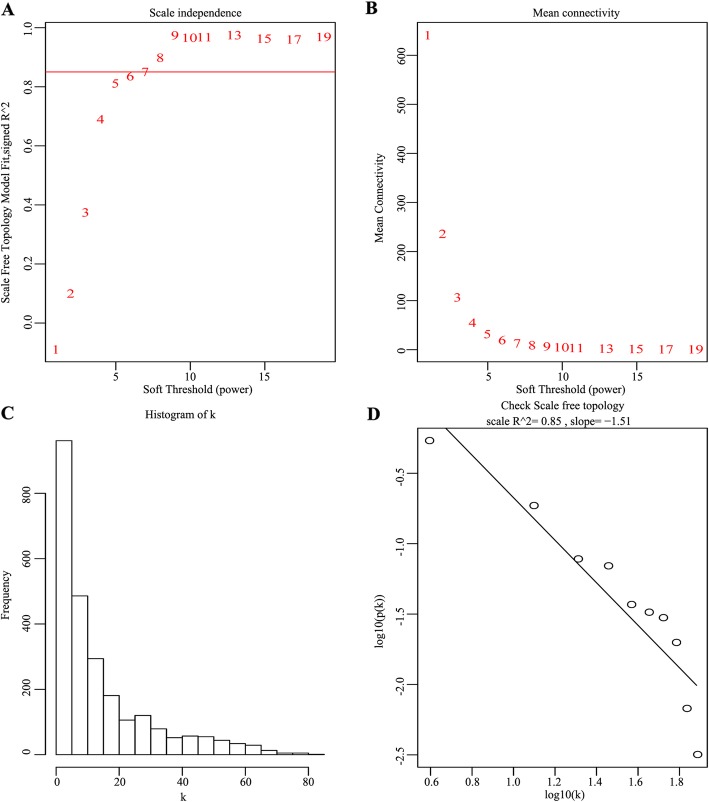
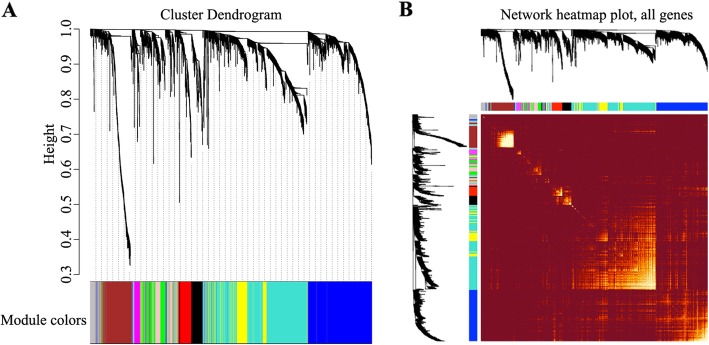
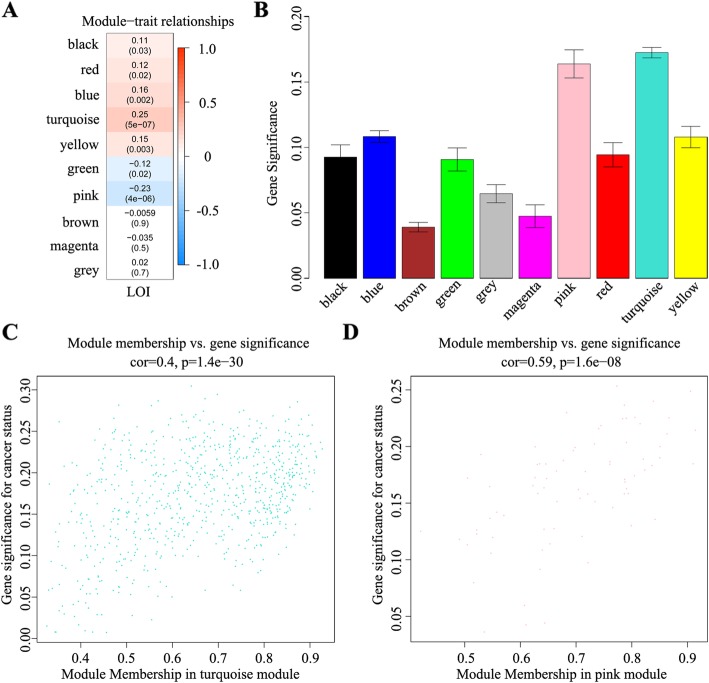
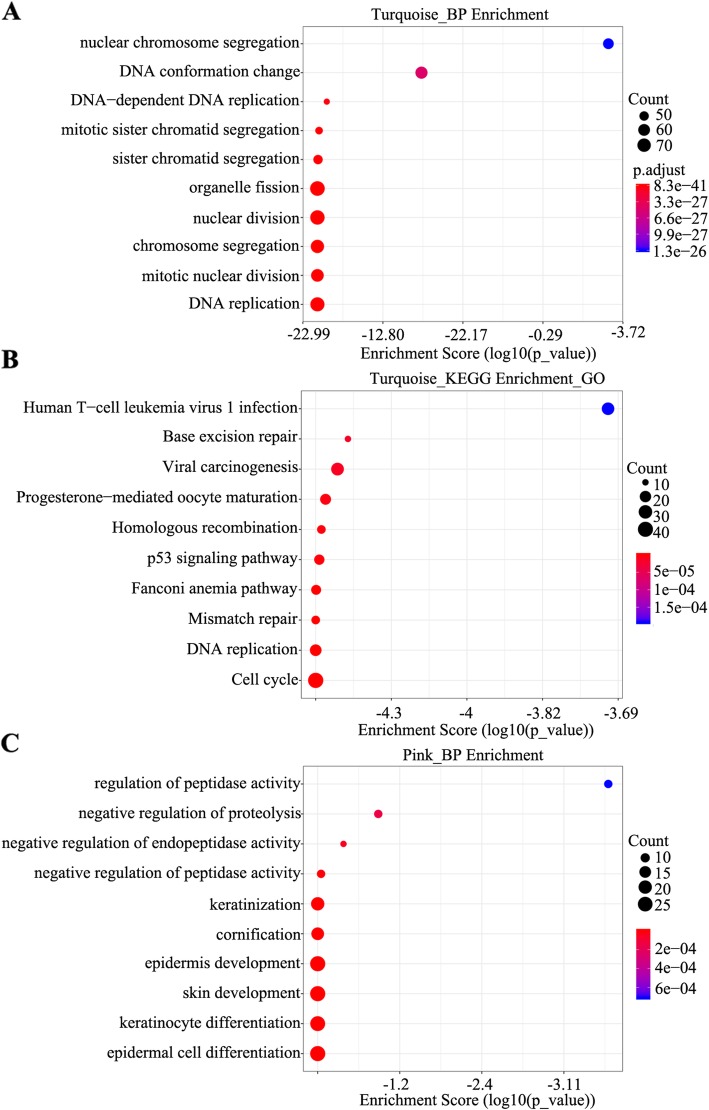
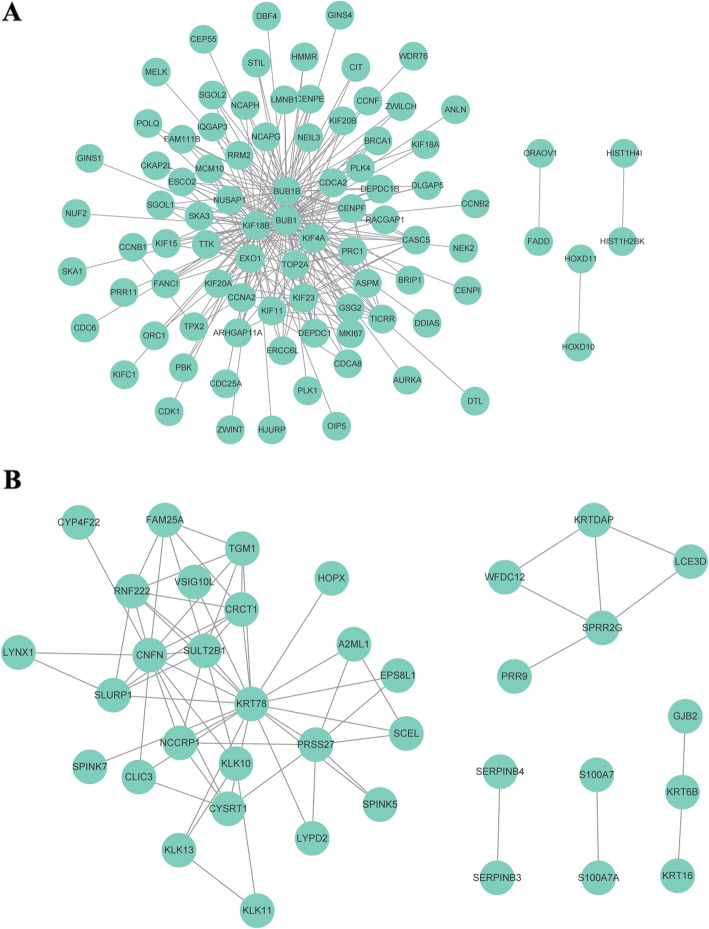
Methods: We performed weighted gene co-expression network analysis to construct gene co-expression networks and investigate the relationship between key modules and the LOI clinical phenotype. Functional enrichment and KEGG pathway analyses were performed with differentially expressed genes. A protein-protein interaction network was constructed using Cytoscape, and module analysis was performed using MCODE. Prognostic value, expression analysis, and survival analysis were conducted using hub genes; GEPIA and the Human Protein Atlas database were used to determine the mRNA and protein expression levels of hub genes, respectively. Multivariable Cox regression analysis was used to establish a prognostic risk formula and the areas under the receiver operating characteristic curve (AUCs) were used to evaluate prediction efficiency. Finally, potential small molecular agents that could target LOI were identified with DrugBank.
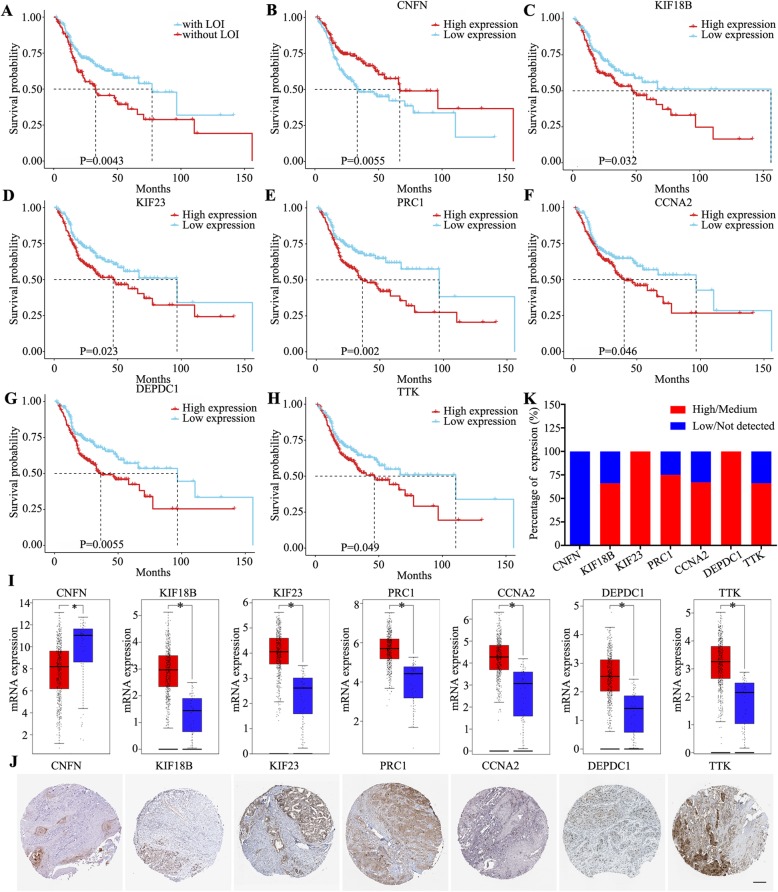
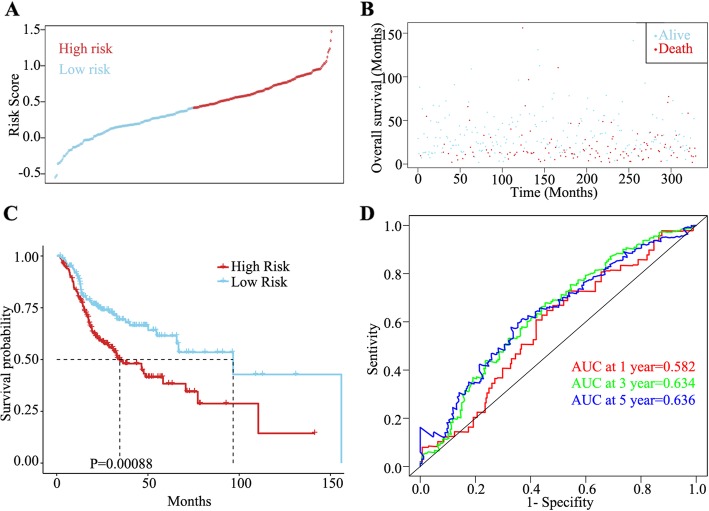
Results: Ten co-expression modules in two key modules (turquoise and pink) associated with LOI were identified. Functional enrichment and KEGG pathway analysis revealed that turquoise and pink modules played significant roles in HNSCC progression. Seven hub genes (CNFN, KIF18B, KIF23, PRC1, CCNA2, DEPDC1, and TTK) in the two modules were identified and validated by survival and expression analyses, and the following prognostic risk formula was established: [risk score = EXPDEPDC1 * 0.32636 + EXPCNFN * (- 0.07544)]. The low-risk group showed better overall survival than the high-risk group (P < 0.0001), and the AUCs for 1-, 3-, and 5-year overall survival were 0.582, 0.634, and 0.636, respectively. Eight small molecular agents, namely XL844, AT7519, AT9283, alvocidib, nelarabine, benzamidine, L-glutamine, and zinc, were identified as novel candidates for controlling LOI in HNSCC (P < 0.05).
Conclusions: The two-mRNA signature (CNFN and DEPDC1) could serve as an independent biomarker to predict LOI risk and provide new insights into the mechanisms underlying LOI in HNSCC. In addition, the small molecular agents appear promising for LOI treatment.
Keywords: Head and neck squamous cell carcinoma; Hub genes; Lymphovascular invasion; TCGA; Weighted gene co-expression network analysis.
Conflict of interest statement
The authors declare that they have no competing interests.
Figures
Similar articles
-
Seven Immune-Related Genes' Prognostic Value and Correlation with Treatment Outcome in Head and Neck Squamous Cell Carcinoma.Mediators Inflamm. 2023 Apr 20;2023:8533476. doi: 10.1155/2023/8533476. eCollection 2023. Mediators Inflamm. 2023. PMID: 39282247 Free PMC article.
-
Comprehensive Analysis of the Roles and Prognostic Value of RNA-Binding Proteins in Head and Neck Squamous Cell Carcinoma.DNA Cell Biol. 2020 Oct;39(10):1789-1798. doi: 10.1089/dna.2020.5641. Epub 2020 Jul 23. DNA Cell Biol. 2020. PMID: 32716650
-
Co-expression network-based identification of biomarkers correlated with the lymph node metastasis of patients with head and neck squamous cell carcinoma.Biosci Rep. 2020 Feb 28;40(2):BSR20194067. doi: 10.1042/BSR20194067. Biosci Rep. 2020. PMID: 32076707 Free PMC article.
-
Development and validation of a novel survival model for head and neck squamous cell carcinoma based on autophagy-related genes.Genomics. 2021 Jan;113(1 Pt 2):1166-1175. doi: 10.1016/j.ygeno.2020.11.017. Epub 2020 Nov 20. Genomics. 2021. PMID: 33227411
-
The evolving transcriptome of head and neck squamous cell carcinoma: a systematic review.PLoS One. 2008 Sep 15;3(9):e3215. doi: 10.1371/journal.pone.0003215. PLoS One. 2008. PMID: 18791647 Free PMC article.
Cited by
-
A TRP Family Based Signature for Prognosis Prediction in Head and Neck Squamous Cell Carcinoma.J Oncol. 2022 Jan 31;2022:8757656. doi: 10.1155/2022/8757656. eCollection 2022. J Oncol. 2022. PMID: 35140788 Free PMC article.
-
Recurrent and Metastatic Head and Neck Cancer: Mechanisms of Treatment Failure, Treatment Paradigms, and New Horizons.Cancers (Basel). 2025 Jan 5;17(1):144. doi: 10.3390/cancers17010144. Cancers (Basel). 2025. PMID: 39796771 Free PMC article. Review.
-
A Metabolism-Related Gene Prognostic Index Bridging Metabolic Signatures and Antitumor Immune Cycling in Head and Neck Squamous Cell Carcinoma.Front Immunol. 2022 Jun 30;13:857934. doi: 10.3389/fimmu.2022.857934. eCollection 2022. Front Immunol. 2022. PMID: 35844514 Free PMC article.
-
Glycoprotein NMB promotes tumor formation and malignant progression of laryngeal squamous cell carcinoma.Cancer Sci. 2022 Sep;113(9):3244-3254. doi: 10.1111/cas.15359. Epub 2022 May 18. Cancer Sci. 2022. PMID: 35365934 Free PMC article.
-
Identification of a new anoikis-related gene signature for prognostic significance in head and neck squamous carcinomas.Medicine (Baltimore). 2023 Sep 8;102(36):e34790. doi: 10.1097/MD.0000000000034790. Medicine (Baltimore). 2023. PMID: 37682196 Free PMC article.
References
MeSH terms
Substances
Grants and funding
LinkOut - more resources
Full Text Sources
Medical
