. 2020 Mar 31:9:e49392.
doi: 10.7554/eLife.49392.

GPC1 specific CAR-T cells eradicate established solid tumor without adverse effects and synergize with anti-PD-1 Ab

Affiliations

GPC1 specific CAR-T cells eradicate established solid tumor without adverse effects and synergize with anti-PD-1 Ab

Daiki Kato et al. Elife. .

Abstract

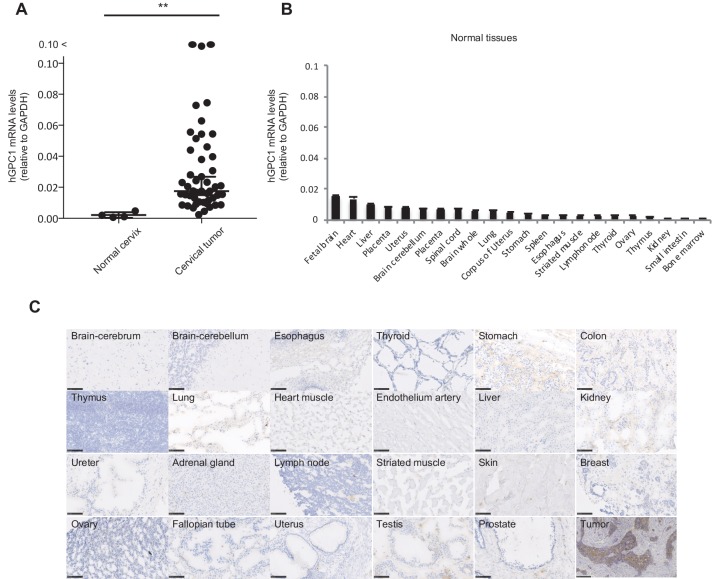
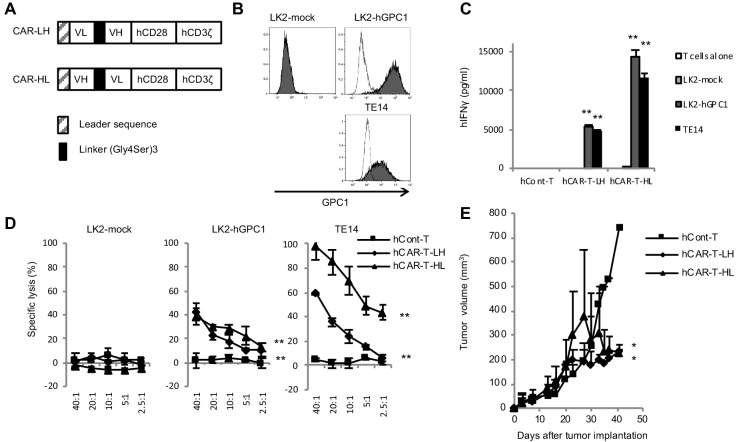
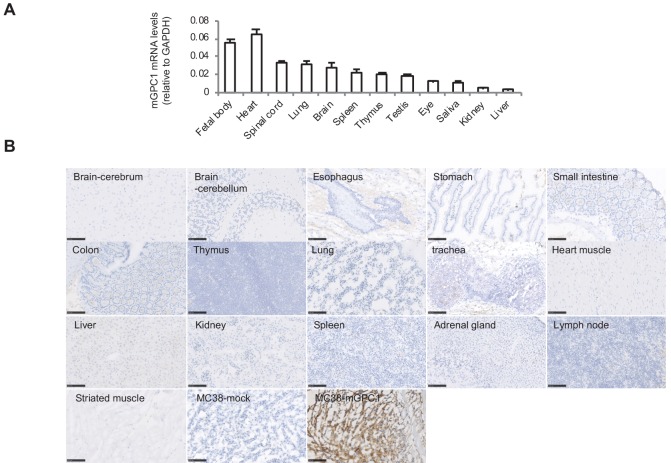
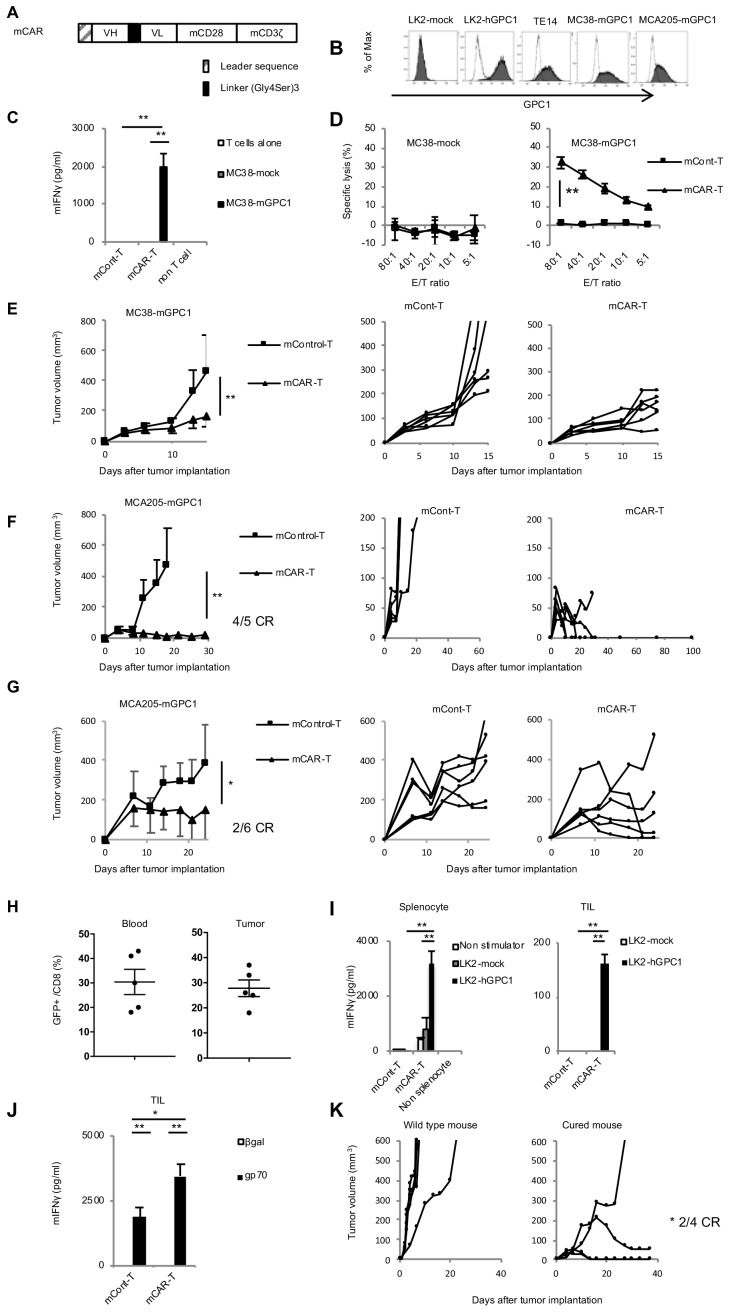
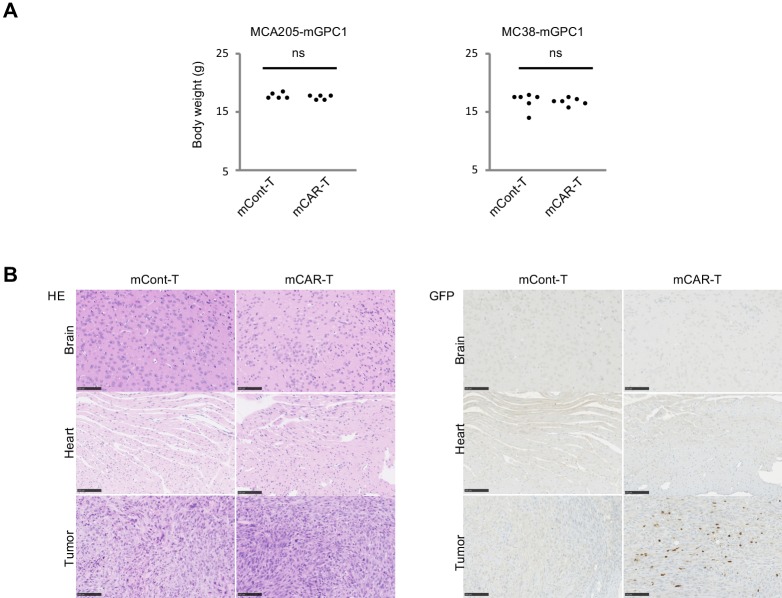
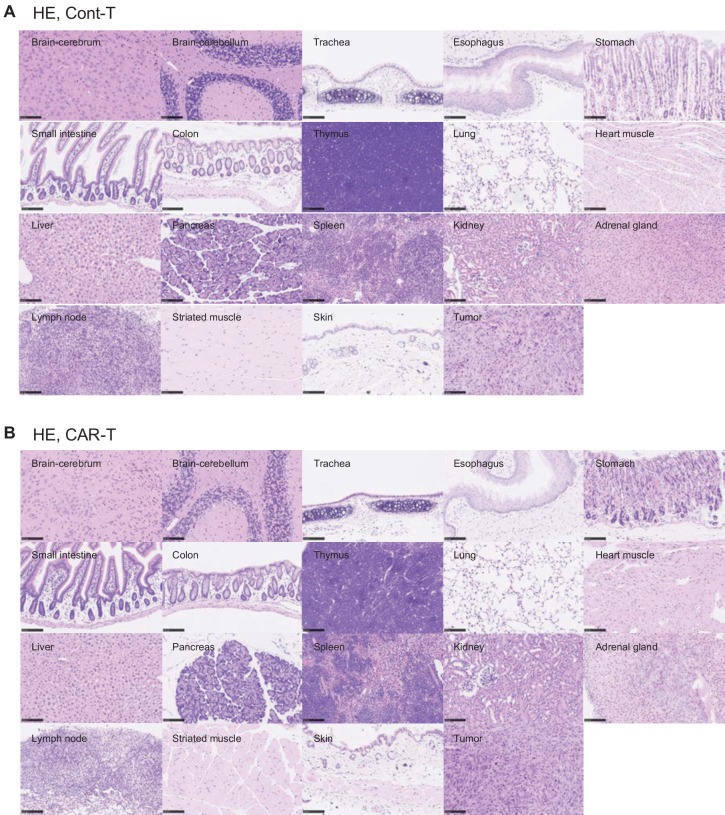
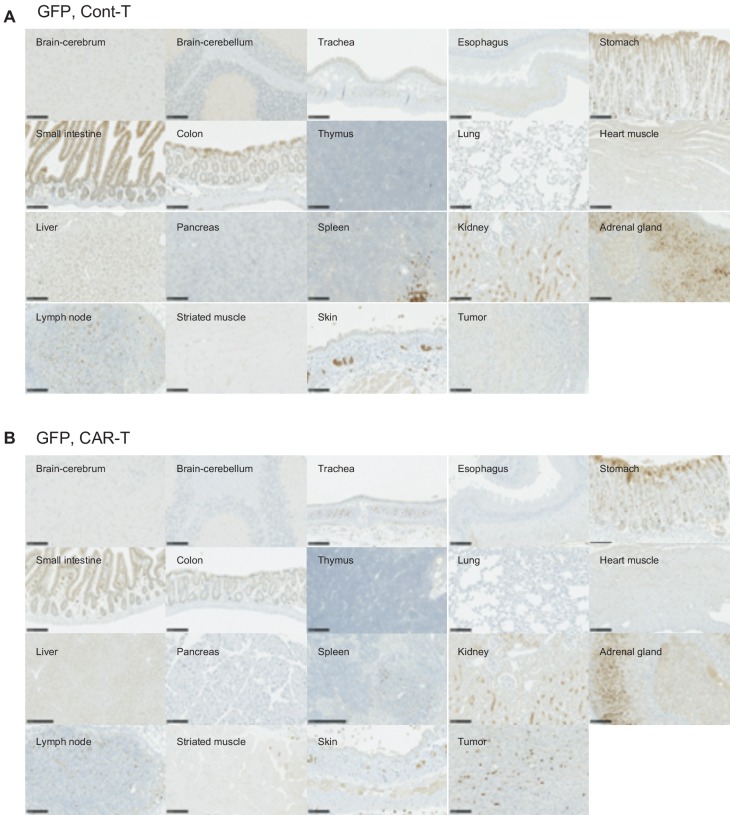
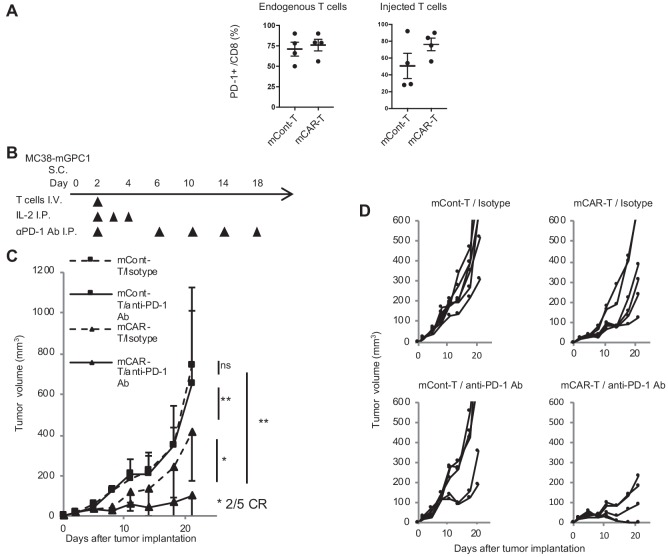
Current xenogeneic mouse models cannot evaluate on-target off-tumor adverse effect, hindering the development of chimeric antigen receptor (CAR) T cell therapies for solid tumors, due to limited human/mouse cross-reactivity of antibodies used in CAR and sever graft-versus-host disease induced by administered human T cells. We have evaluated safety and antitumor efficacy of CAR-T cells targeting glypican-1 (GPC1) overexpressed in various solid tumors. GPC1-specific human and murine CAR-T cells generated from our original anti-human/mouse GPC1 antibody showed strong antitumor effects in xenogeneic and syngeneic mouse models, respectively. Importantly, the murine CAR-T cells enhanced endogenous T cell responses against a non-GPC1 tumor antigen through the mechanism of antigen-spreading and showed synergistic antitumor effects with anti-PD-1 antibody without any adverse effects in syngeneic models. Our study shows the potential of GPC1 as a CAR-T cell target for solid tumors and the importance of syngeneic and xenogeneic models for evaluating their safety and efficacy.

Keywords: CAR-T cells; adverse effects; anti-PD-1 Ab; cancer biology; combination immunotherapy; human; mouse; solid tumor.


Conflict of interest statement

DK, TY, TI, YK, KM, KT, YT, MT, HK, HA, KT, SS, TN, RN, TN, YK No competing interests declared

Figures

Figure 1.
Figure 1.. Low protein expression of GPC1 in human normal tissues detected by anti-GPC1 mAb (clone: 1–12).
(A) The mRNA expression of hGPC1 was evaluated by qPCR in human normal cervix and cervical squamous carcinoma tissues; GAPDH was used as an internal control. (B) The mRNA expression of hGPC1 was evaluated by qPCR in various human adult normal tissues and human fetal brain tissue; GAPDH was used as an internal control. (C) IHC staining by anti-GPC1 mAb (clone: 1–12) in human adult normal tissues and human esophageal SCC tissues. Scale bar, 100 μm.
Figure 2.
Figure 2.. GPC1-specific human hCAR-T cells specifically recognized hGPC1-positive tumor cells and inhibited tumor growth in xenograft mouse model.
(A) Diagrams of GPC1-specific human hCAR; scFv frgments derived from light chain (VL) and heavy chain (VH) of anti-GPC1 mAb (clone: 1–12) were fused to human CD28 and human CD3ζ signal domains. The positions of VL and VH were switched to generate two forms of CAR gene, LH and HL. (B) LK2-hGPC1, LK2-mock, and endogenous hGPC1-expressing TE14 were stained by anti-GPC1 mAb (clone: 1–12) (shaded histogram) or isotype control (open histogram). (C) GPC1-specific IFNγ secretion of hCAR-T cells (LH or HL form) or hCont-T cells co-cultured with LK2-mock, LK2-hGPC1, or TE14. (D) Antigen-specific in vitro cytotoxicity of hCAR-T cells (LH or HL form) or hCont-T cells against LK2-hGPC1, LK2-mock, or TE14 was evaluated by using standard Cr51 releasing assay. (E) hCAR-T cells (LH or HL form) or hCont-T cells (2 × 10⁷ cells/mouse) were injected into TE14-bearing NOG mice on day 9. Results are representative of two or three experiments. Error bars indicate SD.
Figure 2—figure supplement 1.
Figure 2—figure supplement 1.. The sequences of GPC1-specific human CAR vectors.
The sequences of the hCAR vectors (LH and HL forms) are shown. The hCAR vectors are comprised of the human CD8a leader sequence (red), scFv of the anti-GPC1 mAb (linker; orange and VL; purple or VH; green), human CD28 extracellular/transmembrane/intracellular domains (light blue), and human CD3ζ intracellular domain (dark blue).
Figure 3.
Figure 3.. Low protein expression of GPC1 in murine normal tissues detected by anti-GPC1 mAb (clone: 1–12).
(A) Expression of mGPC1 mRNA in various mouse normal tissues and GPC1-positive fetal bodies was quantified by qPCR; GAPDH was used as an internal control. (B) The mouse normal tissues and GPC1-positive MC38-mGPC1 tissues were IHC stained by anti-GPC1 mAb (clone: 1–12) in. Scale bar, 100 μm.
Figure 4.
Figure 4.. GPC1-specific murine mCAR-T cells specifically recognized mGPC1-positive tumor cells and eradicated solid tumors in vivo.
(A) Diagram of GPC1-specific murine CAR; scFv fragment (HL) derived from anti-GPC1 mAb (clone: 1–12) was fused to mouse CD28 and CD3ζ signal domains. (B) The mGPC1-overexpressing murine cells (MC38-mGPC1 and MCA205-mGPC1), endogenous hGPC1-expressing human cells (TE14), and hGPC1-overexpressing human cells (LK2-hGPC1), hGPC1-negative cells (LK2-mock) were stained with anti-GPC1 mAb (shaded histogram) or isotype control (open histogram). (C) Antigen-specific IFNγ secretion of mCAR-T cells or mCont-T cells co-cultured with MC38-mGPC1 or MC38-mock was evaluated. (D) Antigen-specific cytotoxicity of mCAR-T cells or mCont-T cells against MC38-mGPC1 and MC38-mock was evaluated by using standard Cr51 releasing assay. (E and F) Mice bearing MC38-mGPC1 tumor (E) or MCA205-mGPC1 tumor (F) received 2 × 10⁶ cells of mCAR-T cells or mCont-T cells on day 3. Mean tumor volumes (mm3 ± SD) of each group (left panels) and tumor-growth curves of the individual mice in each group (right panels) are shown. (G) Mice bearing MCA205-mGPC1 large tumor (tumor volume is >100 mm3) received 3.5 × 10⁷ cells of mCAR-T cells or mCont-T cells on day 7. Mean tumor volumes (mm3 ± SD) of each group (left panels) and tumor-growth curves of the individual mice in each group (right panels) are shown. (H) Percentages of GFP-positive CD8+ mCAR-T cells in total CD8+ T cells from peripheral blood and tumor tissues on day 15 are shown. Dots indicate mice in each group. (I) Splenocytes (left panel) or CD8+ TIL (right panel) were collected from the mice treated with mCAR-T cells or mCont-T cells on day 15, and co-cultured with LK2-hGPC1 or LK2-mock. After 24 hr, IFNγ in the supernatants was measured by ELISA. (J) CD8+ TIL collected from the mice treated with mCAR-T cells or mCont-T cells were re-stimulated with irradiated normal splenocytes pulsed with gp70 peptides. After 48 hr, the re-stimulated TIL were collected and co-cultured with murine tumor cells pulsed with gp70 or control peptide (βgal) for 24 hr and IFNγ in the supernatants was measured by ELISA. Results are representative of two or three experiments. Error bars indicate SD. (K) 120 days after the mCAR-T cell administration, mGPC1-negative parental MCA205 was inoculated in the naive mice with no history of bearing tumors or the mice which had rejected MCA205-mGPC1 by mCAR-T cells injection. Tumor-growth curves of the individual mice in each group are shown.
Figure 4—figure supplement 1.
Figure 4—figure supplement 1.. The sequences of GPC1-specific murine CAR vectors.
The sequences of the mCAR vector are shown. The mCAR vectors are comprised of the mouse CD8a leader sequence (red), scFv of the anti-GPC1 mAb (VH; green, linker; orange, and VL; purple), mouse CD28 extracellular/transmembrane/intracellular domains (light blue), and mouse CD3ζ intracellular domain (dark blue).
Figure 5.
Figure 5.. GPC1-specific mCAR-T cells showed no obvious adverse effects on normal tissues in vivo.
(A) Body weight of mCAR-T cells or mCont-T cells injected mice bearing MC38-mGPC1 (right panel) or MCA205-GPC1 (left panel) was measured 12 days after mCAR-T cell or mCont-T cell administration. (B) Representative staining of HE (left panel) and IHC for injected GFP+ T cells detected by anti-GFP Ab (right panel) in mouse normal tissues are shown. The data of other normal tissues are shown in Figure 5-figure supplements 1 and 2.
Figure 5—figure supplement 1.
Figure 5—figure supplement 1.. Tissues damages were not detected in mouse normal tissues.
HE staining was performed on normal tissues from MC38-mGPC1-bearing mouse treated with mCont-T cells (A) or mCAR-T cells (B). Scale bar, 100 μm.
Figure 5—figure supplement 2.
Figure 5—figure supplement 2.. Only few GFP-positive mCAR-T cells infiltrated mouse normal tissues.
IHC staining of GFP was performed on normal tissues from the MC38-mGPC1-bearing mouse treated with mCont-T cells (A) or mCAR-T cells (B). Scale bar, 100 μm.
Figure 6.
Figure 6.. GPC1-specific mCAR-T cells synergized with anti-PD-1 Ab.
(A) Percentages of PD-1-expressing cells among endogenous CD8+ T cells (left panel) and injected CD8+ T cells (right panel) harvested from the tumor tissues of MC38-mGPC1 mouse model 12 days after mCAR-T cell or mCont-T cell administration. Dots indicate individual mice of each group. (B) The protocol of combination therapy is shown. Mice bearing MC38-mGPC1 were treated with 2 × 10⁶ cells of mCAR-T cells or mCont-T cells on day 2 and anti-PD-1 Ab (200 mg/mouse) or isotype Ab were intraperitonealy injected on days 2, 6, 10, 14, and 18. (C) Mean tumor volume (mm3 ± SD) of each group is shown. (D) Tumor-growth curves of the individual mice in each group are shown. Results are representative of two or three experiments. Error bars indicate SD.

References

    1. Amatya VJ, Kushitani K, Kai Y, Suzuki R, Miyata Y, Okada M, Takeshima Y. Glypican-1 immunohistochemistry is a novel marker to differentiate epithelioid mesothelioma from lung adenocarcinoma. Modern Pathology. 2018;31:809–815. doi: 10.1038/modpathol.2017.190. - DOI - PubMed
    1. Beatty GL, Haas AR, Maus MV, Torigian DA, Soulen MC, Plesa G, Chew A, Zhao Y, Levine BL, Albelda SM, Kalos M, June CH. Mesothelin-specific chimeric antigen receptor mRNA-engineered T cells induce anti-tumor activity in solid malignancies. Cancer Immunology Research. 2014;2:112–120. doi: 10.1158/2326-6066.CIR-13-0170. - DOI - PMC - PubMed
    1. Brown CE, Alizadeh D, Starr R, Weng L, Wagner JR, Naranjo A, Ostberg JR, Blanchard MS, Kilpatrick J, Simpson J, Kurien A, Priceman SJ, Wang X, Harshbarger TL, D'Apuzzo M, Ressler JA, Jensen MC, Barish ME, Chen M, Portnow J, Forman SJ, Badie B. Regression of glioblastoma after chimeric antigen receptor T-Cell therapy. New England Journal of Medicine. 2016;375:2561–2569. doi: 10.1056/NEJMoa1610497. - DOI - PMC - PubMed
    1. Carpenito C, Milone MC, Hassan R, Simonet JC, Lakhal M, Suhoski MM, Varela-Rohena A, Haines KM, Heitjan DF, Albelda SM, Carroll RG, Riley JL, Pastan I, June CH. Control of large, established tumor xenografts with genetically retargeted human T cells containing CD28 and CD137 domains. PNAS. 2009;106:3360–3365. doi: 10.1073/pnas.0813101106. - DOI - PMC - PubMed
    1. Chinnasamy D, Yu Z, Theoret MR, Zhao Y, Shrimali RK, Morgan RA, Feldman SA, Restifo NP, Rosenberg SA. Gene therapy using genetically modified lymphocytes targeting VEGFR-2 inhibits the growth of vascularized syngenic tumors in mice. Journal of Clinical Investigation. 2010;120:3953–3968. doi: 10.1172/JCI43490. - DOI - PMC - PubMed

Publication types