. 2020 Mar 31:9:e53514.
doi: 10.7554/eLife.53514.

The primary structural photoresponse of phytochrome proteins captured by a femtosecond X-ray laser

Affiliations

The primary structural photoresponse of phytochrome proteins captured by a femtosecond X-ray laser

Elin Claesson et al. Elife. .

Abstract

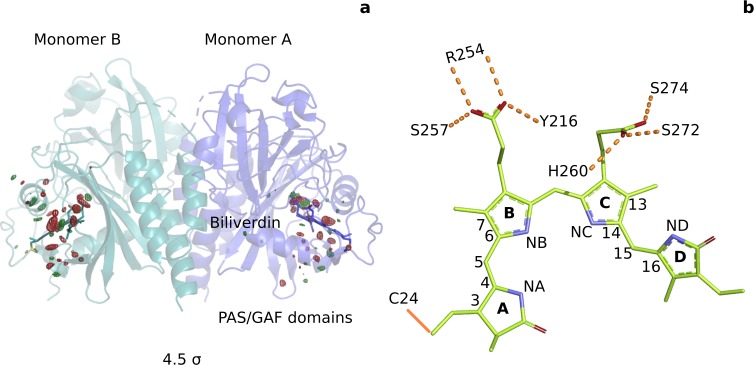
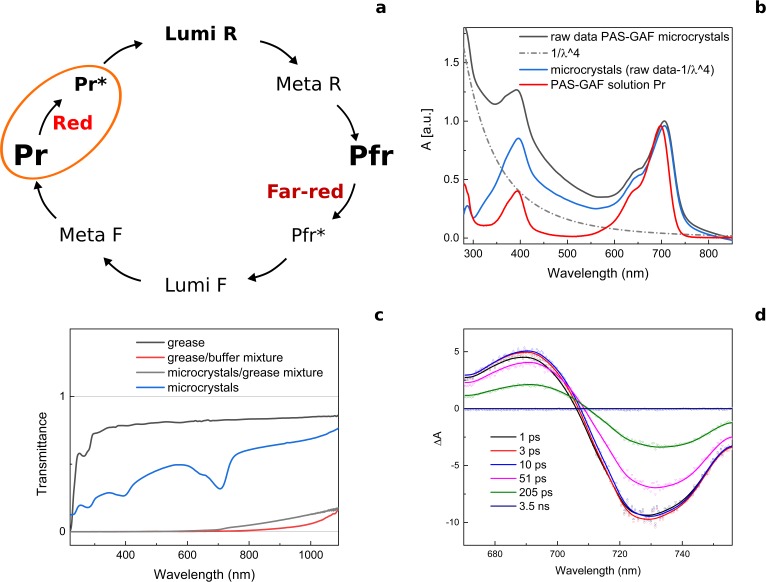
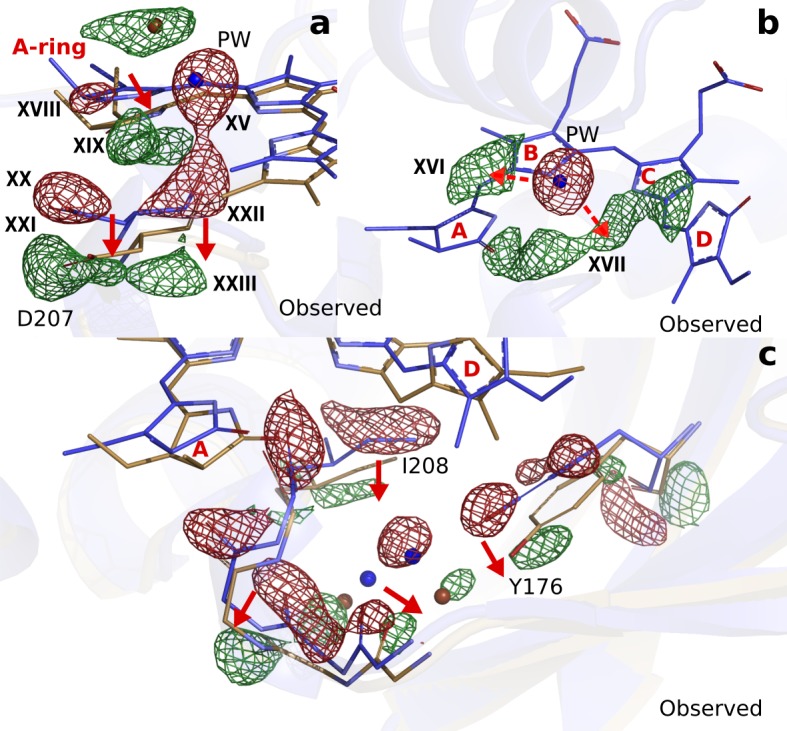
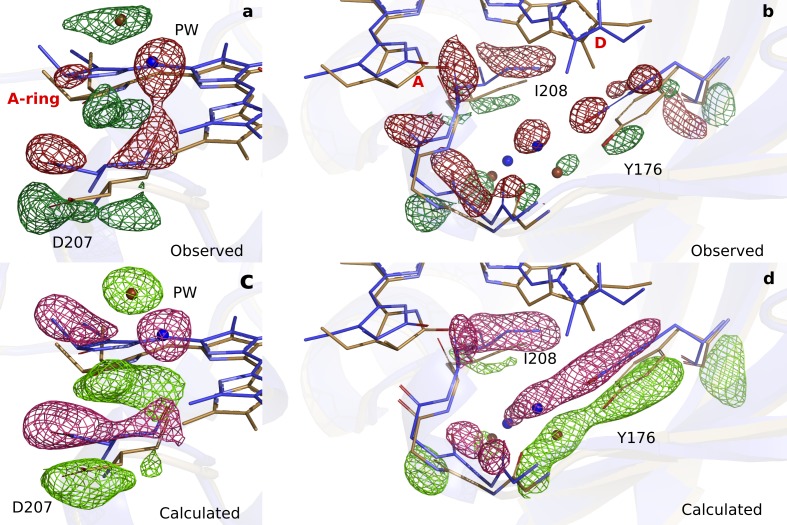
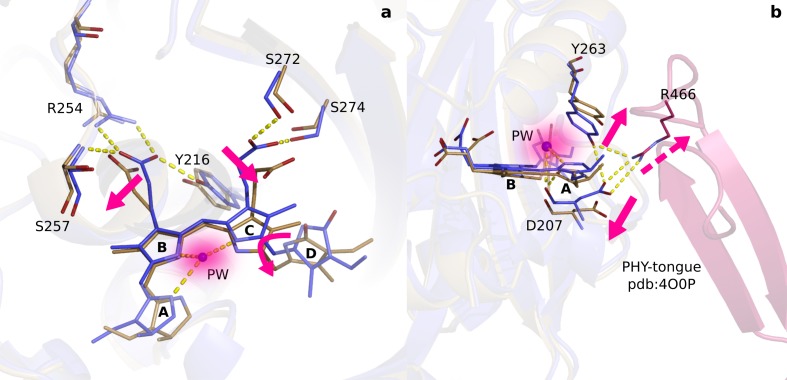
Phytochrome proteins control the growth, reproduction, and photosynthesis of plants, fungi, and bacteria. Light is detected by a bilin cofactor, but it remains elusive how this leads to activation of the protein through structural changes. We present serial femtosecond X-ray crystallographic data of the chromophore-binding domains of a bacterial phytochrome at delay times of 1 ps and 10 ps after photoexcitation. The data reveal a twist of the D-ring, which leads to partial detachment of the chromophore from the protein. Unexpectedly, the conserved so-called pyrrole water is photodissociated from the chromophore, concomitant with movement of the A-ring and a key signaling aspartate. The changes are wired together by ultrafast backbone and water movements around the chromophore, channeling them into signal transduction towards the output domains. We suggest that the observed collective changes are important for the phytochrome photoresponse, explaining the earliest steps of how plants, fungi and bacteria sense red light.

Keywords: Deinococcus radiodurans; SFX; initial photorespons; molecular biophysics; phytochromes; structural biology.

Plain language summary

Plants adapt to the availability of light throughout their lives because it regulates so many aspects of their growth and reproduction. To detect the level of light, plant cells use proteins called phytochromes, which are also found in some bacteria and fungi. Phytochrome proteins change shape when they are exposed to red light, and this change alters the behaviour of the cell. The red light is absorbed by a molecule known as chromophore, which is connected to a region of the phytochrome called the PHY-tongue. This region undergoes one of the key structural changes that occur when the phytochrome protein absorbs light, turning from a flat sheet into a helix. Claesson, Wahlgren, Takala et al. studied the structure of a bacterial phytochrome protein almost immediately after shining a very brief flash of red light using a laser. The experiments revealed that the structure of the protein begins to change within a trillionth of a second: specifically, the chromophore twists, which disrupts its attachment to the protein, freeing the protein to change shape. Claesson, Wahlgren, Takala et al. note that this structure is likely a very short-lived intermediate state, which however triggers more changes in the overall shape change of the protein. One feature of the rearrangement is the disappearance of a particular water molecule. This molecule can be found at the core of many different phytochrome structures and interacts with several parts of the chromophore and the phytochrome protein. It is unclear why the water molecule is lost, but given how quickly this happens after the red light is applied it is likely that this disappearance is an integral part of the reshaping process. Together these events disrupt the interactions between the chromophore and the PHY-tongue, enabling the PHY-tongue to change shape and alter the structure of the phytochrome protein. Understanding and controlling this process could allow scientists to alter growth patterns in plants, such as crops or weeds.


Conflict of interest statement

EC, WW, HT, SP, LC, VK, LH, MP, MC, JK, RN, LI, AN, AC, DM, MM, MK, RB, EN, RT, TT, LF, SI, SO, KM, GG, ES, JI, MS, SW No competing interests declared

Figures

Figure 1.
Figure 1.. Photoinduced observed difference electron density features are focused on the chromophore binding pocket.
(a) The observed difference electron density map at 1 ps is displayed together with the DrBphPdark structure. Red and green electron density peaks, contoured at 4.5 σ, denote negative and positive densities, respectively. Monomer A is colored blue and monomer B is in aqua. (b) Schematic illustration of the biliverdin chromophore. The hydrogen-bonding networks between the propionate groups and the protein are marked with dashed lines. In DrBphP, the chromophore is covalently linked to a cysteine residue in the PAS domain (solid line).
Figure 1—figure supplement 1.
Figure 1—figure supplement 1.. The photocycle of Deinococcus radiodurans phytochrome (DrBphP) and the spectral properties of its PAS-GAF fragment in the microcrystalline form.
(a) Schematic illustration of the photoconversion between Pr and Pfr states in DrBphP. We note that the final state of the PAS-GAF fragment (also referred to as chromophore-binding domain, CBD) does not have the same spectral shape as in full-length phytochromes. (b) Raw absorption spectra of the DrBphPCBD microcrystals in buffer (black), scattering correction (1/λ4, dash dot), scattering corrected absorption spectra of the DrBphPCBD microcrystals (blue), and DrBphPCBD in solution in the Pr-state (red). (c) Transmission spectra of the grease (black), grease mixed with crystallization buffer (red), DrBphPCBD microcrystals in the grease matrix (measured in the 50 µm path length), and DrBphPCBD microcrystals in buffer. The microcrystals delivered to the beam are mixed with a viscous grease media. Although the Super Lube grease used in SFX experiments has a low background for X-rays, once it is mixed with the aqueous crystal buffer, the microcrystal/grease mixture exhibits significant scattering of visible light. The scattering varied with the mixing procedure. For the optical measurements, we reproduced the mixing procedure used at the XFEL as closely as possible. We estimate that the light intensities inside the grease jet are attenuated by at least two orders of magnitude. (d) Transient absorption spectra of DrBphPCBD microcrystals in buffer taken at different time delays after excitation. The spectra show a typical excited state signal of phytochromes (Toh et al., 2010). A Lumi-R signal was not observed, which is typically present on the ns-timescale after the excitation in the transient optical absorption data of phytochromes in solution.
Figure 1—figure supplement 2.
Figure 1—figure supplement 2.. Microcrystals used for SFX data acquisition in SACLA.
The crystals reported here were shaped as needles of 20–70 µm.
Figure 1—figure supplement 3.
Figure 1—figure supplement 3.. Unit cell parameters distribution of SFX data sets.
(a) Unit cell parameters for dark data set. (b) Unit cell parameters for 1 ps data set. Both data sets indicate orthorhombic crystals.
Figure 1—figure supplement 4.
Figure 1—figure supplement 4.. Significant difference electron density features observed.
Difference electron density maps at 1 ps and 10 ps for monomer A and B are shown together with the DrBphPdark structure (monomer A: blue, monomer B: aqua). Red and green contour surfaces denote negative and positive densities, respectively. The maps are contoured at electron density levels as indicated. We determine the background level to be at 3σ for 1 ps and at 3.4σ for 10 ps, since below these levels random signals outside the chromophore region appear.
Figure 1—figure supplement 5.
Figure 1—figure supplement 5.. Comparison of the observed difference electron density maps at 1 ps and 10 ps.
The observed difference electron density map at (a) 1 ps plotted for monomer A, (b) at 10 ps for monomer A, (c) at 1 ps monomer B, and (d) at 10 ps for monomer B. The maps are plotted at 3.5σ and 3σ for 1 ps and 10 ps, respectively. Most off the difference features discussed here are present in both maps, although at a lower signal strength in the 10 ps map.
Figure 2.
Figure 2.. SFX data as a function of excitation fluence.
The DrBphPdarkstructure (green) is shown together with the observed difference electron density, contoured at 3.5 σ, at 1 ps collected using (a) 0.2 mJ/mm2, (b) 0.4 mJ/mm2, (c) 1.3 mJ/mm2, and (d) 1.7 mJ/mm2. All spot sizes were computed assuming Gaussian line shapes with the (1/e2) convention. The data shown in panel A-C were collected at SACLA in May 2019, whereas the data shown in panel D was collected in October 2018. The same experimental setup was used in both occasions. The laser energy of the experiment in 2018 can be found in the Materials and methods section. The energies for the experiment in 2019 were 16 µJ, 42 µJ, and 106 µJ (panels A-C, respectively). During the experiment in 2019, the femtosecond laser beam was misaligned by 50 µm distance from the interaction spot between X-rays and jet in the direction of flow. The laser intensities were corrected for this displacement assuming a Gaussian line shape. The excitation fluence is similar to previous femtosecond time-resolved SFX experiments (Nogly et al., 2018; Pande et al., 2016; Barends et al., 2015; Coquelle et al., 2018); however, we found high scattering in the grease/buffer mixture (Figure 1—figure supplement 1). Since the crystallographic signals were reduced when lowering the excitation fluence and disappeared completely when reaching 1/10 of the maximum value, we conclude that the excitation fluence that actually reaches the crystals in the grease matrix is much lower than the incoming photon fluence and that the photoexcitation is in the single-photon regime.
Figure 3.
Figure 3.. Observed and calculated difference electron densities reveal a twist of the D-ring and significant protein rearrangements.
The observed difference electron density with the refined DrBphPdark(blue) and DrBphP1ps(beige) structures, shown for (a) the B-, C-, and D-ring surroundings, (b) the strictly conserved His260 and Tyr263, and (c) the D-ring. The calculated difference electron density shown for (d) His260 and Tyr263 and (e) the D-ring. The D-ring twists counter-clockwise when viewed along C15-C16 bond toward the C-ring. The observed difference electron density is contoured at 3.3 σ. And the calculated difference electron density is contoured at 3.5 and 5.0 σ for panel d and e, respectively. Monomer A is shown in this figure.
Figure 3—figure supplement 1.
Figure 3—figure supplement 1.. Extrapolated maps at α=25 demonstrate that the D-ring twists in the photoactivated state.
(a). Rings A to C of monomer A together with the 2Fo-Fc maps of the refined dark structure (DrBphPdark: blue). (b). The same data for the D-ring in a different orientation. (c) and (d). Equivalently, the refined structure (DrBphP1ps: beige) of the chromophore in monomer A together with the extrapolated map FT(Fe) at 1 ps. (Fo, phases from the dark structure). We observed a round-shape feature for the D-ring, but flat densities for C-ring (downward shift) and B-ring (almost unshifted). This suggests that the D-ring twists significantly. For the A-ring we observe a broad density, with the strongest contribution indicating a twisted or tilted ring.
Figure 3—figure supplement 2.
Figure 3—figure supplement 2.. Comparison of observed (upper panel) and calculated (lower panel) difference electron densities indicate good agreement around the B-D rings.
(a). The observed difference electron density map (3.3 σ) is displayed for the B-D ring surroundings of the DrBphPdark (blue) and the DrBphP1ps structure (beige) for monomer A. (b). The same view and structures displayed with the calculated difference electron density map contoured at 4.5 σ.
Figure 3—figure supplement 3.
Figure 3—figure supplement 3.. Hydrogen bonding network between the chromophore propionate groups is disrupted at 1 ps delay time.
Correlating negative and positive density features indicate that the C-ring moves downwards, together with the C-ring propionate. The negative density features located on the propionate groups, three waters (W1, W2 and W3), Arg254, and Ser257 collectively indicate that the hydrogen bonding network is resolved at 1 ps. Difference electron density features are not observed on the B-ring. DrBphPdark is shown in blue and DrBphP1ps in beige. The chromophore is shown for monomer A together with the observed difference map at 1 ps delay time, contoured at 3.0 σ.
Figure 3—figure supplement 4.
Figure 3—figure supplement 4.. Backbone movements at 1 ps.
(a). Difference (DrBphP1ps-DrBphPdark) in distances between each Cα and the pyrrole water (DrBphPdark) plotted for all differences that are larger than 0.45 Å for monomer B. Longer distances are colored red and biliverdin is shown as pink sticks. The regions that move the most, the ’DIP region’ and the ’capping helix’ above the chromophore are marked with red circles. (b). The observed difference electron densities indicate backbone movements away from the chromophore for residues 201–209 and 257–269, and an expansion of the chromopore-binding pocket. The DrBphPdark structure is colored blue and the DrBphP1ps structure is colored beige. The observed electron density map is contoured at 4.0 σ. The dashed lines indicate the proposed signal transduction pathway from D-ring to B-ring propionate.
Figure 4.
Figure 4.. Photodissociation of the pyrrole water, displacement of the A-ring and its effect on the proteins scaffold.
(a). The observed difference electron density displayed with the DrBphPdark (blue) and DrBphP1ps (beige) structures around the A-ring, Asp207 and pyrrole water (PW). The structural model was inconclusive as to whether the A-ring twists around the double bond between the B- and A-ring, or whether it tilts downward hinged on the connection between C- and B-ring. (b). The regions of the pyrrole water (PW) and the area between the pyrrole rings show negative and positive densities, respectively. The observed difference electron density is contoured at 3.3σ. (c). Density displayed for the backbone below the A-ring, including side chains of the strictly conserved Ile208 and Tyr176 as well as the surrounding water network. Monomer A is shown in this figure.
Figure 4—figure supplement 1.
Figure 4—figure supplement 1.. Comparison of observed and calculated difference electron densities in the A-ring region.
(a). The observed difference electron density is displayed together with the DrBphPdark (blue) and the DrBphP1ps (beige) structures for monomer A. The data is shown around the A-ring, Asp207 and pyrrole water (PW). (b). For the backbone below the A-ring, side chains shown for the strictly conserved Ile208 and Tyr176 as well as the surrounding water network. (c). The same view as panel A displayed together with the calculated difference electron density. (d). The same view as panel B displayed together with the calculated difference electron density. The observed and calculated difference electron density maps are contoured at 3.3 σ and 3.5 σ, respectively.
Figure 5.
Figure 5.. Two correlated photochemical events guide the primary photorespone of phytochrome proteins.
(a). The structures (DrBphPdark, blue and DrBphP1ps, beige) indicate that rotation of the D-ring initiates breakage of non-covalent bonds of the propionates to the protein scaffold. Even the C- and A-rings are displaced significantly and the pyrrole water is dislocated from its original location at 1 ps (shade). (b). The same structures are overlayed with the complete photosensory core in Pr state (PDB ID 4O0P, pink) (Takala et al., 2014). The scissor-like separation of Asp207 and Tyr263 could result in breakage of the hydrogen bonds to Arg466 of the conserved PRXSF motif located in the PHY-tongue region.

Comment in

  • Rapid response.
    Hughes J. Hughes J. Elife. 2020 Apr 17;9:e57105. doi: 10.7554/eLife.57105. Elife. 2020. PMID: 32301437 Free PMC article.

References

    1. Adams PD, Afonine PV, Bunkóczi G, Chen VB, Davis IW, Echols N, Headd JJ, Hung LW, Kapral GJ, Grosse-Kunstleve RW, McCoy AJ, Moriarty NW, Oeffner R, Read RJ, Richardson DC, Richardson JS, Terwilliger TC, Zwart PH. PHENIX: a comprehensive Python-based system for macromolecular structure solution. Acta Crystallographica Section D Biological Crystallography. 2010;66:213–221. doi: 10.1107/S0907444909052925. - DOI - PMC - PubMed
    1. Barends TR, Foucar L, Ardevol A, Nass K, Aquila A, Botha S, Doak RB, Falahati K, Hartmann E, Hilpert M, Heinz M, Hoffmann MC, Köfinger J, Koglin JE, Kovacsova G, Liang M, Milathianaki D, Lemke HT, Reinstein J, Roome CM, Shoeman RL, Williams GJ, Burghardt I, Hummer G, Boutet S, Schlichting I. Direct observation of ultrafast collective motions in CO myoglobin upon ligand dissociation. Science. 2015;350:445–450. doi: 10.1126/science.aac5492. - DOI - PubMed
    1. Barty A, Kirian RA, Maia FR, Hantke M, Yoon CH, White TA, Chapman H. Cheetah: software for high-throughput reduction and analysis of serial femtosecond X-ray diffraction data. Journal of Applied Crystallography. 2014;47:1118–1131. doi: 10.1107/S1600576714007626. - DOI - PMC - PubMed
    1. Battye TG, Kontogiannis L, Johnson O, Powell HR, Leslie AG. iMOSFLM: a new graphical interface for diffraction-image processing with MOSFLM. Acta Crystallographica. Section D, Biological Crystallography. 2011;67:271–281. doi: 10.1107/S0907444910048675. - DOI - PMC - PubMed
    1. Burgie ES, Wang T, Bussell AN, Walker JM, Li H, Vierstra RD. Crystallographic and electron microscopic analyses of a bacterial phytochrome reveal local and global rearrangements during photoconversion. Journal of Biological Chemistry. 2014;289:24573–24587. doi: 10.1074/jbc.M114.571661. - DOI - PMC - PubMed

Publication types