. 2020 Apr 14;117(15):8398-8403.
doi: 10.1073/pnas.1915006117. Epub 2020 Mar 30.

Measuring the predictability of life outcomes with a scientific mass collaboration

Matthew J Salganik  1 Ian Lundberg  2 Alexander T Kindel  2 Caitlin E Ahearn  3 Khaled Al-Ghoneim  4 Abdullah Almaatouq  5   6 Drew M Altschul  7 Jennie E Brand  3   8 Nicole Bohme Carnegie  9 Ryan James Compton  10 Debanjan Datta  11 Thomas Davidson  12 Anna Filippova  13 Connor Gilroy  14 Brian J Goode  15 Eaman Jahani  16 Ridhi Kashyap  17   18   19 Antje Kirchner  20 Stephen McKay  21 Allison C Morgan  22 Alex Pentland  6 Kivan Polimis  23 Louis Raes  24 Daniel E Rigobon  25 Claudia V Roberts  26 Diana M Stanescu  27 Yoshihiko Suhara  6 Adaner Usmani  28 Erik H Wang  27 Muna Adem  29 Abdulla Alhajri  30 Bedoor AlShebli  31 Redwane Amin  32 Ryan B Amos  26 Lisa P Argyle  33 Livia Baer-Bositis  34 Moritz Büchi  35 Bo-Ryehn Chung  36 William Eggert  37 Gregory Faletto  38 Zhilin Fan  39 Jeremy Freese  34 Tejomay Gadgil  40 Josh Gagné  34 Yue Gao  41 Andrew Halpern-Manners  29 Sonia P Hashim  26 Sonia Hausen  34 Guanhua He  42 Kimberly Higuera  34 Bernie Hogan  43 Ilana M Horwitz  44 Lisa M Hummel  34 Naman Jain  25 Kun Jin  45 David Jurgens  46 Patrick Kaminski  29   47 Areg Karapetyan  48   49 E H Kim  34 Ben Leizman  26 Naijia Liu  27 Malte Möser  26 Andrew E Mack  27 Mayank Mahajan  26 Noah Mandell  50 Helge Marahrens  29 Diana Mercado-Garcia  44 Viola Mocz  51 Katariina Mueller-Gastell  34 Ahmed Musse  52 Qiankun Niu  32 William Nowak  53 Hamidreza Omidvar  54 Andrew Or  26 Karen Ouyang  26 Katy M Pinto  55 Ethan Porter  56 Kristin E Porter  57 Crystal Qian  26 Tamkinat Rauf  34 Anahit Sargsyan  58 Thomas Schaffner  26 Landon Schnabel  34 Bryan Schonfeld  27 Ben Sender  59 Jonathan D Tang  26 Emma Tsurkov  34 Austin van Loon  34 Onur Varol  60   61 Xiafei Wang  62 Zhi Wang  61   63 Julia Wang  26 Flora Wang  59 Samantha Weissman  26 Kirstie Whitaker  64   65 Maria K Wolters  66 Wei Lee Woon  67 James Wu  68 Catherine Wu  26 Kengran Yang  54 Jingwen Yin  39 Bingyu Zhao  69 Chenyun Zhu  39 Jeanne Brooks-Gunn  70   71 Barbara E Engelhardt  26   36 Moritz Hardt  72 Dean Knox  27 Karen Levy  73 Arvind Narayanan  26 Brandon M Stewart  2 Duncan J Watts  74   75   76 Sara McLanahan  1
Affiliations

Measuring the predictability of life outcomes with a scientific mass collaboration

Matthew J Salganik et al. Proc Natl Acad Sci U S A. .

Erratum in

Abstract

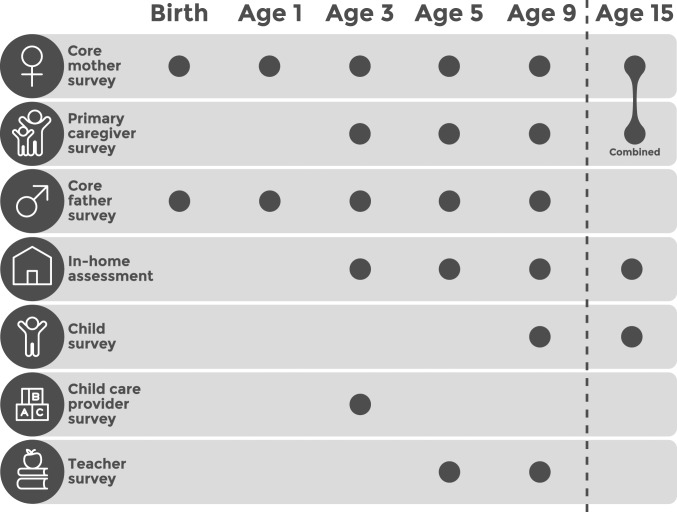
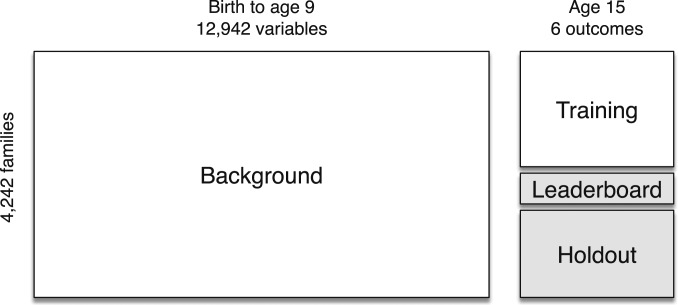
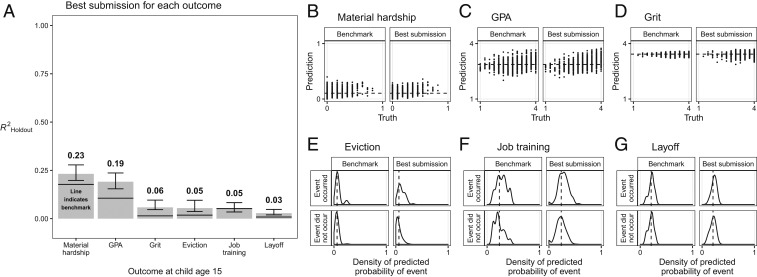
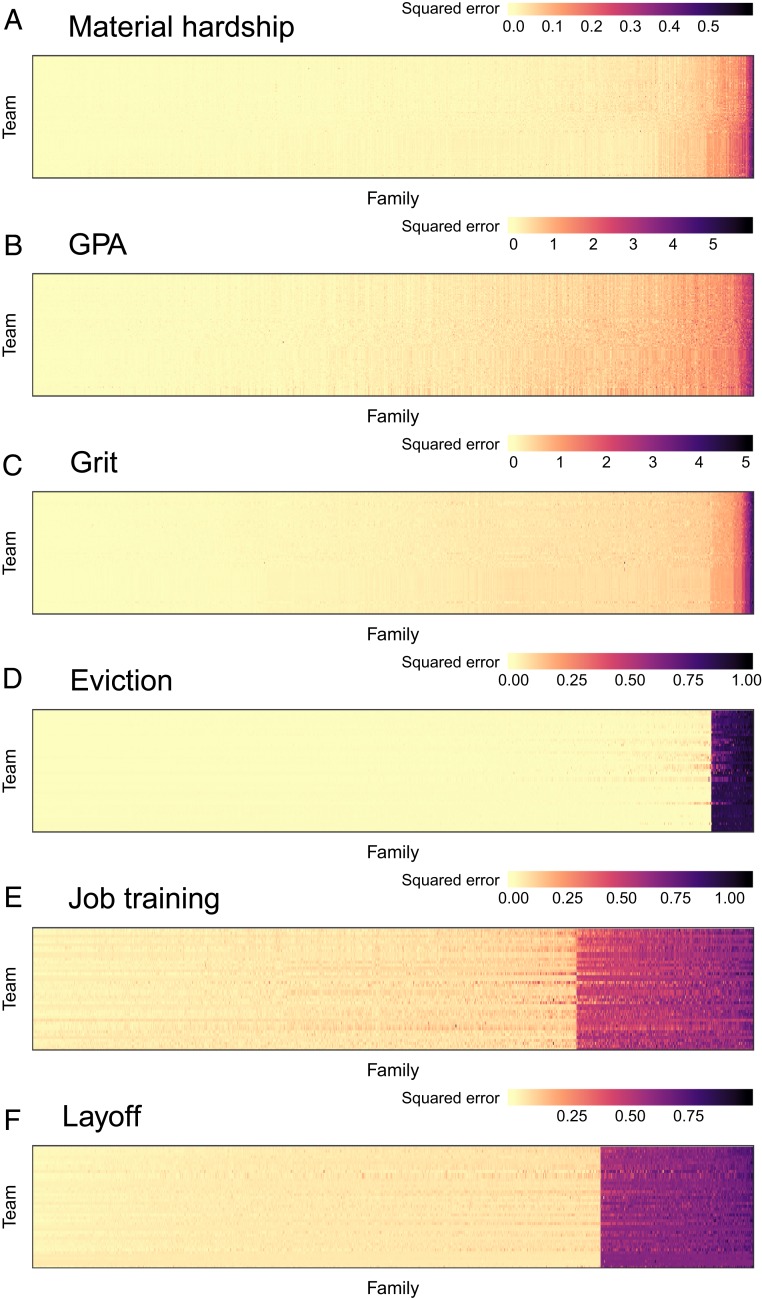
How predictable are life trajectories? We investigated this question with a scientific mass collaboration using the common task method; 160 teams built predictive models for six life outcomes using data from the Fragile Families and Child Wellbeing Study, a high-quality birth cohort study. Despite using a rich dataset and applying machine-learning methods optimized for prediction, the best predictions were not very accurate and were only slightly better than those from a simple benchmark model. Within each outcome, prediction error was strongly associated with the family being predicted and weakly associated with the technique used to generate the prediction. Overall, these results suggest practical limits to the predictability of life outcomes in some settings and illustrate the value of mass collaborations in the social sciences.

Keywords: life course; machine learning; mass collaboration; prediction.


Conflict of interest statement

Competing interest statement: B.E.E. is on the scientific advisory boards of Celsius Therapeutics and Freenome, is currently employed by Genomics plc and Freenome, and is on a year leave-of-absence from Princeton University.

Figures

Fig. 1.
Fig. 1.
Data collection modules in the Fragile Families study. Each module is made up of ∼10 sections, where each section includes questions about a specific topic (e.g., marriage attitudes, family characteristics, demographic characteristics). Information about the topics included in each module is presented in SI Appendix, section S1.1. During the Fragile Families Challenge, data from waves 1 to 5 (birth to age 9 y) were used to predict outcomes in wave 6 (age 15 y).
Fig. 2.
Fig. 2.
Datasets in the Fragile Families Challenge. During the Fragile Families Challenge, participants used the background data (measured from child’s birth to age 9 y) and the training data (measured at child age 15 y) to predict the holdout data as accurately as possible. While the Fragile Families Challenge was underway, participants could assess the accuracy of their predictions in the leaderboard data. At the end of the Fragile Families Challenge, we assessed the accuracy of the predictions in the holdout data.
Fig. 3.
Fig. 3.
Performance in the holdout data of the best submissions and a four variable benchmark model (SI Appendix, section S2.2). A shows the best performance (bars) and a benchmark model (lines). Error bars are 95% confidence intervals (SI Appendix, section S2.1). B–D compare the predictions and the truth; perfect predictions would lie along the diagonal. EG show the predicted probabilities for cases where the event happened and where the event did not happen. In BG, the dashed line is the mean of the training data for that outcome.
Fig. 4.
Fig. 4.
Heatmaps of the squared prediction error for each observation in the holdout data. Within each heatmap, each row represents a team that made a qualifying submission (sorted by predictive accuracy), and each column represents a family (sorted by predictive difficulty). Darker colors indicate higher squared error; scales are different across subfigures; order of rows and columns are different across subfigures. The hardest-to-predict observations tend to be those that are very different from the mean of the training data, such as children with unusually high or low GPAs (SI Appendix, section S3). This pattern is particularly clear for the three binary outcomes—eviction, job training, layoff—where the errors are large for families where the event occurred and small for the families where it did not.

Comment in

References

    1. Kleinberg J., Ludwig J., Mullainathan S., Obermeyer Z., Prediction policy problems. Am. Econ. Rev. 105, 491–495 (2015). - PMC - PubMed
    1. Athey S., Beyond prediction: Using big data for policy problems. Science 355, 483–485 (2017). - PubMed
    1. Blau P. M., Duncan O. D., The American Occupational Structure (John Wiley and Sons, 1967).
    1. Chetty R., Hendren N., Kline P., Saez E., Where is the land of opportunity? The geography of intergenerational mobility in the United States. Q. J. Econ. 129, 1553–1623 (2014).
    1. Feuerverger A., He Y., Khatri S., Statistical significance of the Netflix challenge. Stat. Sci., 202–231 (2012).

Publication types

LinkOut - more resources