. 2020 Mar 31;117(13):6990-6997.
doi: 10.1073/pnas.1918891117.

Progress toward gender equality in the United States has slowed or stalled

Affiliations

Progress toward gender equality in the United States has slowed or stalled

Paula England et al. Proc Natl Acad Sci U S A. .

Abstract

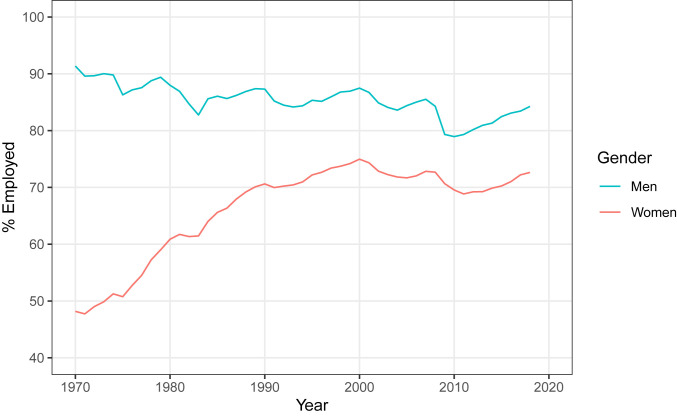
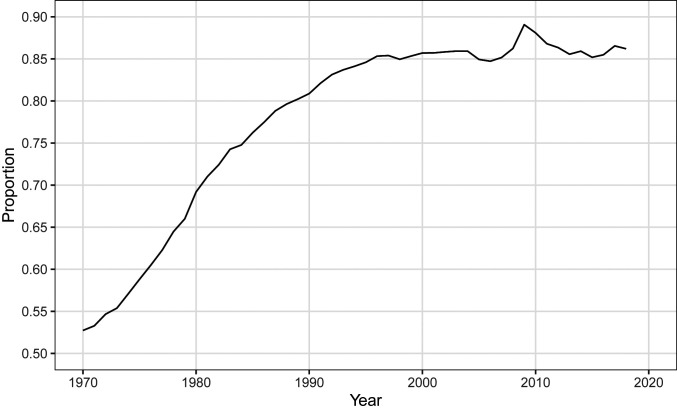
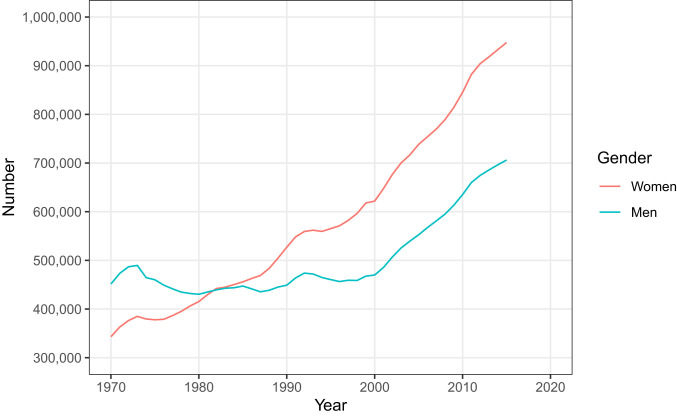
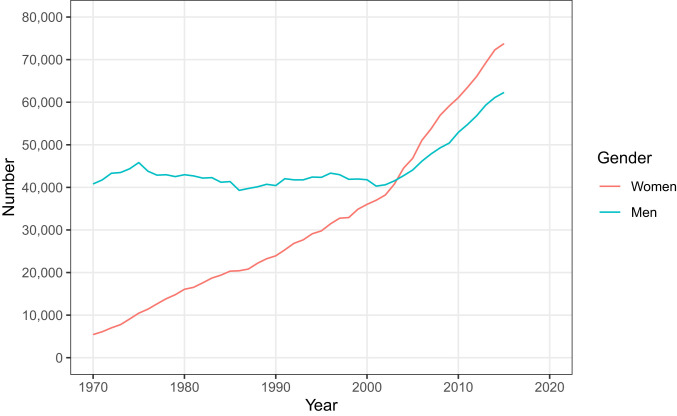
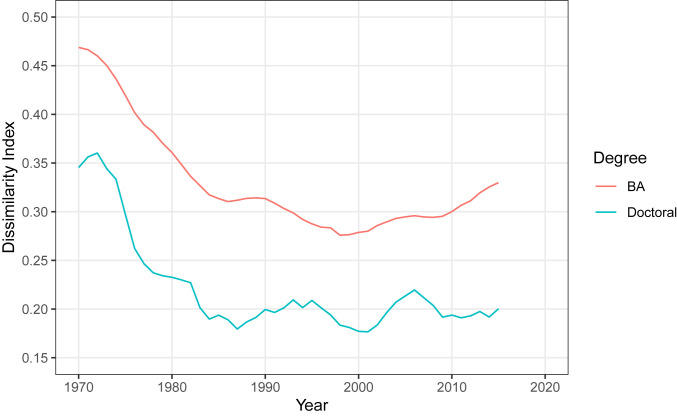
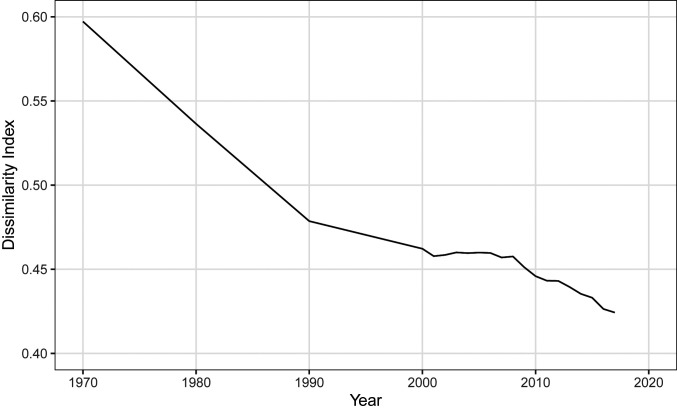
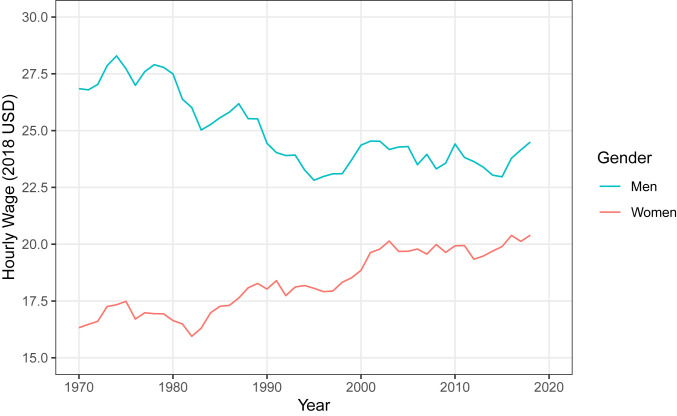
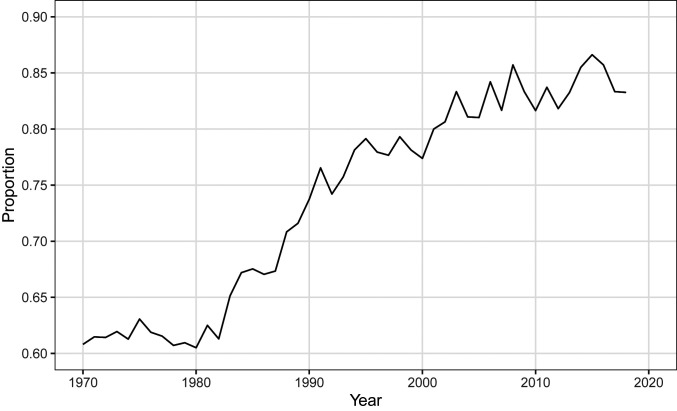
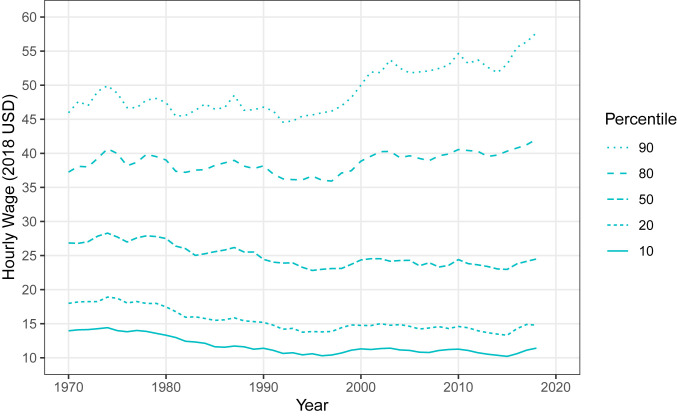
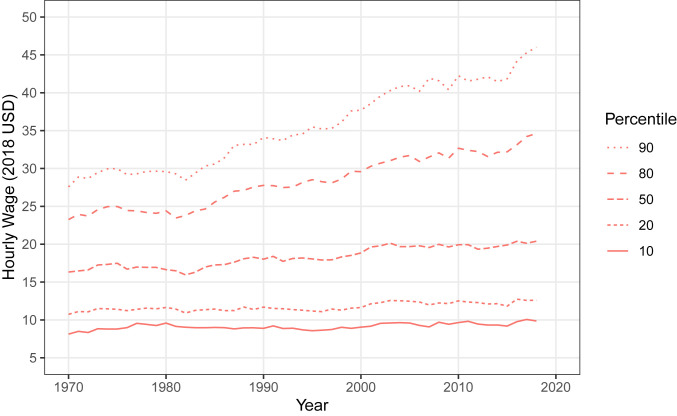
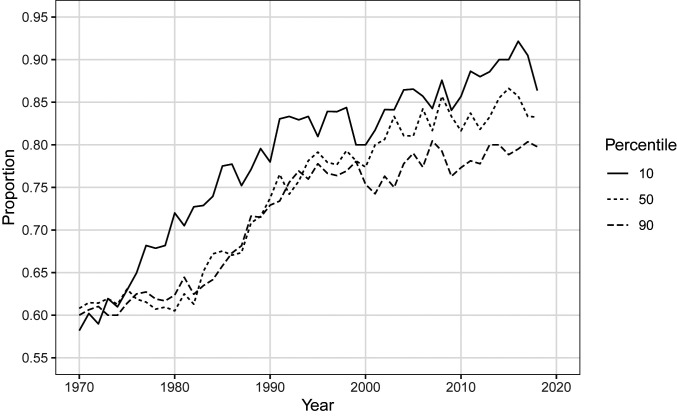
We examine change in multiple indicators of gender inequality for the period of 1970 to 2018. The percentage of women (age 25 to 54) who are employed rose continuously until ∼2000 when it reached its highest point to date of 75%; it was slightly lower at 73% in 2018. Women have surpassed men in receipt of baccalaureate and doctoral degrees. The degree of segregation of fields of study declined dramatically in the 1970s and 1980s, but little since then. The desegregation of occupations continues but has slowed its pace. Examining the hourly pay of those aged 25 to 54 who are employed full-time, we found that the ratio of women's to men's pay increased from 0.61 to 0.83 between 1970 and 2018, rising especially fast in the 1980s, but much slower since 1990. In sum, there has been dramatic progress in movement toward gender equality, but, in recent decades, change has slowed and on some indicators stalled entirely.

Keywords: education; gender; gender inequality; gender pay gap; occupational gender segregation.


Conflict of interest statement

The authors declare no competing interest.

Figures

Fig. 1.
Fig. 1.
Percentage of women and men, age 25 to 54, employed in the last week, 1970 to 2018. Source: Authors’ computations from IPUMS CPS ASEC samples for 1970 to 2018.
Fig. 2.
Fig. 2.
Ratio of percentage of women to men employed in the last week, age 25 to 54, 1970 to 2018. Source: Authors’ computations from IPUMS CPS ASEC samples for 1970 to 2018.
Fig. 3.
Fig. 3.
Number of men and women receiving baccalaureate degrees, 1970 to 2015. Source: Authors’ calculation using data from NCES.
Fig. 4.
Fig. 4.
Number of men and women receiving doctoral degrees, 1970 to 2015. Source: Authors’ calculation using data from NCES.
Fig. 5.
Fig. 5.
Ratio of women to men receiving baccalaureate and doctoral degrees, 1970 to 2015. Source: Authors’ calculation using data from NCES.
Fig. 6.
Fig. 6.
Segregation index (D) for baccalaureate and doctoral degree recipients’ fields of study, 1970 to 2015. Source: Authors’ calculation of D (index of dissimilarity) using data from NCES.
Fig. 7.
Fig. 7.
Segregation index (D) for occupations, 1970 to 2017. Source: Authors’ calculation of D (index of dissimilarity) from IPUMS decennial Census samples for 1970 to 2000 and ACS samples for 2001 to 2017. Uses three-digit occupations collapsed to 77 categories.
Fig. 8.
Fig. 8.
Median hourly wage of full-time working women and men, age 25 to 54, employed in the last week, 1970 to 2018. Source: Authors’ computations from IPUMS CPS ASEC samples for 1970 to 2018.
Fig. 9.
Fig. 9.
Ratio of women’s to men’s median hourly wage among full-time workers employed in the last week, age 25 to 54, 1970 to 2018. Source: Authors’ computations from IPUMS CPS ASEC samples for 1970 to 2018.
Fig. 10.
Fig. 10.
Hourly wage of full-time working men, age 25 to 54, employed in the last week, at 10th, 20th, 50th, 80th, and 90th percentile of distribution, 1970 to 2018. Source: Authors’ computations from IPUMS CPS ASEC samples for 1970 to 2018.
Fig. 11.
Fig. 11.
Hourly wage of full-time working women, age 25 to 54, employed in the last week, at 10th, 20th, 50th, 80th, and 90th percentile of distribution, 1970 to 2018. Source: Authors’ computations from IPUMS CPS ASEC samples for 1970 to 2018.
Fig. 12.
Fig. 12.
Ratio of women’s to men’s hourly wage at the 10th, 50th, and 90th percentile of their distributions, for full-time workers employed in the last week, age 25 to 54, 1970 to 2018. Source: Authors’ computations from IPUMS CPS ASEC samples for 1970 to 2018.

References

    1. Cotter D., England P., Hermsen J., Moms and jobs: Trends in mothers’ employment and which mothers stay home. Council on Contemporary Families Briefing Paper (2008). https://contemporaryfamilies.org/wp-content/uploads/2013/10/2007_Briefin.... Accessed 27 December 2019.
    1. Goldin C., Katz L., The power of the pill: Oral contraceptives and women’s career and marriage decisions. J. Polit. Econ. 110, 730–770 (2002).
    1. Bailey M. J., More power to the pill: The impact of contraceptive freedom on women’s labor supply. Q. J. Econ. 121, 289–320 (2006).
    1. DiPrete T. A., Buchmann C., The Rise of Women: The Growing Gender Gap in Education and What It Means for American Schools (Russell Sage Foundation, New York, NY, 2013).
    1. England P., et al. ., Why are some academic fields tipping toward female? The sex composition of U.S. fields of doctoral degree receipt, 1971–2002. Sociol. Educ. 80, 23–42 (2007).

Publication types

LinkOut - more resources