Review
. 2020 Mar 27;21(7):2323.
doi: 10.3390/ijms21072323.

Detection of Rare Objects by Flow Cytometry: Imaging, Cell Sorting, and Deep Learning Approaches

Affiliations
Review

Detection of Rare Objects by Flow Cytometry: Imaging, Cell Sorting, and Deep Learning Approaches

Denis V Voronin et al. Int J Mol Sci. .

Abstract

Flow cytometry nowadays is among the main working instruments in modern biology paving the way for clinics to provide early, quick, and reliable diagnostics of many blood-related diseases. The major problem for clinical applications is the detection of rare pathogenic objects in patient blood. These objects can be circulating tumor cells, very rare during the early stages of cancer development, various microorganisms and parasites in the blood during acute blood infections. All of these rare diagnostic objects can be detected and identified very rapidly to save a patient's life. This review outlines the main techniques of visualization of rare objects in the blood flow, methods for extraction of such objects from the blood flow for further investigations and new approaches to identify the objects automatically with the modern deep learning methods.

Keywords: cell labeling; cell sorting; circulating tumor cells; deep learning; flow cytometry data analysis; imaging flow cytometry; liquid biopsy.


Conflict of interest statement

The authors declare no conflict of interest.

Figures

Figure 1
Figure 1
The optical system of an imaging flow cytometer.
Figure 2
Figure 2
Sketch of an antibody structure.
Figure 3
Figure 3
Chemical structure of phycoerythrin bilin chromophore.
Figure 4
Figure 4
(a) Structural schemes of different chromophore groups (atom color coding: grey—carbon, red—oxygen, blue—nitrogen, yellow—sulfur; R/R1/R2 symbolize protein rests); (b) excitation and emission spectra of different fluorophores. Reprinted with permission from [141]. Copyright 2009, John Wiley and Sons.
Figure 5
Figure 5
Distribution of: (a) elastomeric particles and cells and (b) cells binded with elastomeric particles in nodes and antinodes of the acoustic standing wave. Reprinted with permission from [166]. Copyright 2014, American Chemical Society.
Figure 6
Figure 6
Cell separation by gradient centrifugation method with OncoQuick separation kit. Reprinted with permission from [180]. Copyright 2007, Elsevier.
Figure 7
Figure 7
SEM images of (a) commercial membrane filter; (b) microfabricated parylene membrane filter; (c) parylenemembrane filter with cells captured without SEM fixation treatment, and (d) parylene membrane filter with cells captured after SEM fixation procedure. Reprinted with permission from [184]. Copyright 2007, Elsevier.
Figure 8
Figure 8
(a) Hydrodynamic and (b) acoustic focusing in a microfluidic channel.
Figure 9
Figure 9
Various types of separation microfluidic mechanisms: (a) electrokinetic; (b) magnetic; and (c) acoustic separation.
Figure 10
Figure 10
Schematic of conventional electroosmosis in a microchannel. Reprinted with permission from [190]. Copyright 2017, John Wiley and Sons.
Figure 11
Figure 11
Scheme of the particle polarization process and dielectrophoretic response: left—positive DEP, right—negative DEP. Reprinted with permission from [191]. Copyright 2018, AIP Publishing.
Figure 12
Figure 12
(a) Example of dielectrophoretic cell separation in the microfluidic device. Reprinted with permission from [199]. Copyright 2017, John Wiley and Sons. (b) Schematic of contactless dielectrophoretic (cDEP) device with the electromagnetic forces acting in the microfluidic channel. Reprinted with permission from [201]. Copyright 2010, the Royal Society of Chemistry.
Figure 13
Figure 13
(a) Cross-sectional field map of the magnetic field of a quadrupole magnetic flow sorting (QMS) magent; (b) axial section diagram of the separation column contained within the quadrupole magnet assembly. Reprinted with permission from [231]. Copyright 2018, John Wiley and Sons.
Figure 14
Figure 14
Acoustofluidic manipulations with particles and cells with a positive (A) and negative (B) acoustic response in a bulk acoustic standing wave. (C) The schematic of an surface standing acoustic waves (SSAW) device with interdigital transducers (IDTs) focusing the cells along well-defined streamlines. (D) The cross-section of an SSAW device with four pressure nodes. Reprinted with permission from [165]. Copyright 2015, Royal Society of Chemistry.
Figure 15
Figure 15
(a) Formation of the hydrodynamic equilibrium position of a cell moving in the liquid flow and affected by the drag and lift forces; (b) formation of re-circulating secondary flow (Dean flow) in the curved microchannel; (c) separation of the cells depending on their size employing secondary flow in curved microchannel; (d) the shift of the equilibrium position due to the superposition of inertial lift and Dean flow in a curved microchannel. Adapted with permission from [297] Copyright 2001, the Royal Society of Chemistry.
Figure 16
Figure 16
(a) Principal scheme of the device employing Dean-like secondary flow acceleration induced by micro-bars in the spiral microchannel. Reprinted with permission from [304]. Copyright 2017, The Royal Society of Chemistry. (b) Asymmetric reverse wavy microchannel inducing periodically reversible Dean flow. Reprinted with permission from [306]. Copyright 2018, Springer Nature. (c) Design of the separation device employing Dean flow with multiple separation areas. Reprinted with permission from [309]. Copyright 2001, The Royal Society of Chemistry.
Figure 17
Figure 17
Mechanisms of separation by DLD with respect to cell size, shape, and deformability as in the case of RBCs. (A) The principle of DLD separation: particles with Reff < Rc follow the flow direction and those with Reff > Rc are displaced at an angle to the flow direction. For hard spheres, Reff is equal to the radius. (B) Red blood cells are normally disc–shaped but they can adopt other shapes when exposed to different chemicals. (C) Shear forces deform particles changing Reff, and measuring the change in Reff as a function of applied shear rate is equivalent to measuring the deformability of the particle. (D) Reff depends on the orientation of the particle. Controlling orientation and measuring Reff gives information about shape. It is also possible to measure deformability in different directions. (E) In a deep device RBCs rotate such that Reff (< Rc) is equal to half the thickness. (F) Confinement in a shallow device means that the cell radius defines Reff (> Rc). (G) An echinocyte with Reff > Rc. Reprinted with permission from [329]. Copyright 2012, the Royal Society of Chemistry.
Figure 18
Figure 18
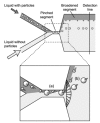
Principle of pinched flow fractionation. (a) In the pinched segment, particles are aligned to one sidewall regardless of their sizes by controlling the flow rates from two inlets; (b) particles are separated according to their sizes by the spreading flow profile at the boundary of the pinched and the broadened segments. The liquid containing particles is dark-colored. Reproduced with permission from [335]. Copyright 2004, American Chemical Society.
Figure 19
Figure 19
The deep neural network recognizes cell types by their corresponding waveforms. Different types of cells are categorized and charged with different polarity charges so that they can be separated into different collection tubes. Reprinted with permission from [351]. Copyright 2019, Nature Springer.

References

    1. Galanzha E.I., Menyaev Y.A., Yadem A.C., Sarimollaoglu M., Juratli M.A., Nedosekin D.A., Foster S.R., Jamshidi-Parsian A., Siegel E.R., Makhoul I., et al. In vivo liquid biopsy using Cytophone platform for photoacoustic detection of circulating tumor cells in patients with melanoma. Sci. Transl. Med. 2019;11:eaat5857. doi: 10.1126/scitranslmed.aat5857. - DOI - PMC - PubMed
    1. Nolan J., Nedosekin D.A., Galanzha E.I., Zharov V.P. Detection of Apoptotic Circulating Tumor Cells Using in vivo Fluorescence Flow Cytometry. Cytom. A. 2019;95:664–671. doi: 10.1002/cyto.a.23642. - DOI - PMC - PubMed
    1. Harrington W.N., Nolan J., Nedosekin D.A., Smeltzer M.S., Zharov V.P. Real-Time Monitoring of Bacteria Clearance From Blood in a Murine Model. Cytom. A. 2019 doi: 10.1002/cyto.a.23925. - DOI - PubMed
    1. Menyaev Y.A., Carey K.A., Nedosekin D.A., Sarimollaoglu M., Galanzha E.I., Stumhofer J.S., Zharov V.P. Preclinical photoacoustic models: Application for ultrasensitive single cell malaria diagnosis in large vein and artery. Biomed. Opt. Express. 2016;7:3643–3658. doi: 10.1364/BOE.7.003643. - DOI - PMC - PubMed
    1. Cai C., Carey K.A., Nedosekin D.A., Menyaev Y.A., Sarimollaoglu M., Galanzha E.I., Stumhofer J.S., Zharov V.P. In vivo photoacoustic flow cytometry for early malaria diagnosis. Cytom. A. 2016;89:531–542. doi: 10.1002/cyto.a.22854. - DOI - PubMed

Substances