Meta-Analysis
. 2020 Mar 30;11(1):1600.
doi: 10.1038/s41467-020-15383-w.

The genetic architecture of membranous nephropathy and its potential to improve non-invasive diagnosis

Jingyuan Xie #  1 Lili Liu #  2 Nikol Mladkova #  2 Yifu Li  2 Hong Ren  3 Weiming Wang  3 Zhao Cui  4   5   6 Li Lin  3 Xiaofan Hu  3 Xialian Yu  3 Jing Xu  3 Gang Liu  4   5   6 Yasar Caliskan  7 Carlo Sidore  8 Olivia Balderes  2 Raphael J Rosen  2 Monica Bodria  2   9 Francesca Zanoni  2   10 Jun Y Zhang  2 Priya Krithivasan  2 Karla Mehl  2 Maddalena Marasa  2 Atlas Khan  2 Fatih Ozay  2 Pietro A Canetta  2 Andrew S Bomback  2 Gerald B Appel  2 Simone Sanna-Cherchi  2 Matthew G Sampson  11 Laura H Mariani  12   13 Agnieszka Perkowska-Ptasinska  14 Magdalena Durlik  14 Krzysztof Mucha  15   16 Barbara Moszczuk  15 Bartosz Foroncewicz  15 Leszek Pączek  15   16 Ireneusz Habura  17 Elisabet Ars  18 Jose Ballarin  18 Laila-Yasmin Mani  19 Bruno Vogt  19 Savas Ozturk  20 Abdülmecit Yildiz  21 Nurhan Seyahi  22 Hakki Arikan  23 Mehmet Koc  23 Taner Basturk  24 Gonca Karahan  25 Sebahat Usta Akgul  25 Mehmet Sukru Sever  7 Dan Zhang  26 Domenico Santoro  27 Mario Bonomini  28 Francesco Londrino  29 Loreto Gesualdo  30 Jana Reiterova  31 Vladimir Tesar  31 Claudia Izzi  32   33 Silvana Savoldi  34 Donatella Spotti  35 Carmelita Marcantoni  36 Piergiorgio Messa  10 Marco Galliani  37 Dario Roccatello  38 Simona Granata  39 Gianluigi Zaza  39 Francesca Lugani  40 GianMarco Ghiggeri  40 Isabella Pisani  9 Landino Allegri  9 Ben Sprangers  41   42 Jin-Ho Park  43 BeLong Cho  43   44 Yon Su Kim  45   46 Dong Ki Kim  46   47 Hitoshi Suzuki  48 Antonio Amoroso  49 Daniel C Cattran  50 Fernando C Fervenza  51 Antonello Pani  52 Patrick Hamilton  53 Shelly Harris  53 Sanjana Gupta  54 Chris Cheshire  54 Stephanie Dufek  54 Naomi Issler  54 Ruth J Pepper  54 John Connolly  54 Stephen Powis  54 Detlef Bockenhauer  54 Horia C Stanescu  54 Neil Ashman  55 Ruth J F Loos  56   57   58 Eimear E Kenny  56   59   60 Matthias Wuttke  61 Kai-Uwe Eckardt  62   63 Anna Köttgen  61 Julia M Hofstra  64 Marieke J H Coenen  65 Lambertus A Kiemeney  66 Shreeram Akilesh  67 Matthias Kretzler  12 Lawrence H Beck  68 Benedicte Stengel  69   70 Hanna Debiec  71 Pierre Ronco  71   72 Jack F M Wetzels  64 Magdalena Zoledziewska  8 Francesco Cucca  8 Iuliana Ionita-Laza  73 Hajeong Lee  46   47 Elion Hoxha  74 Rolf A K Stahl  74 Paul Brenchley  75 Francesco Scolari  32   76 Ming-Hui Zhao  4   5   6   77 Ali G Gharavi  2 Robert Kleta #  78 Nan Chen #  3 Krzysztof Kiryluk #  79
Affiliations
Meta-Analysis

The genetic architecture of membranous nephropathy and its potential to improve non-invasive diagnosis

Jingyuan Xie et al. Nat Commun. .

Abstract

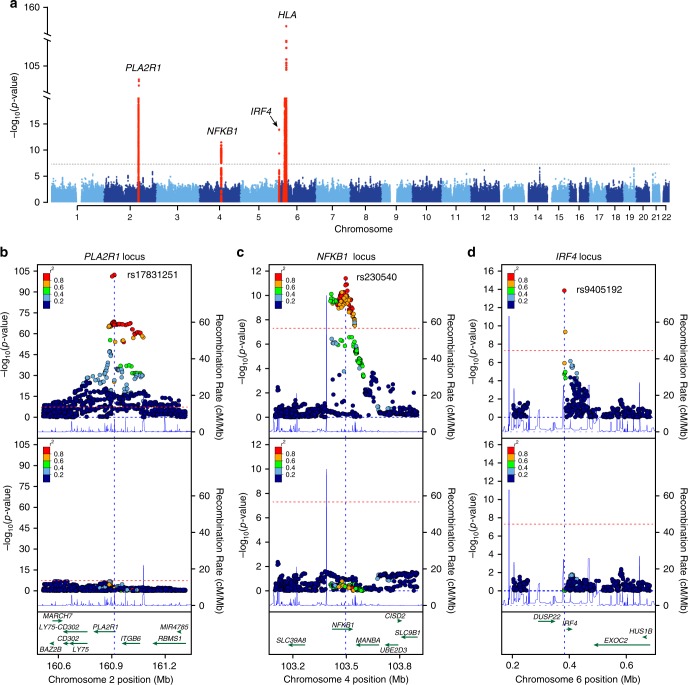
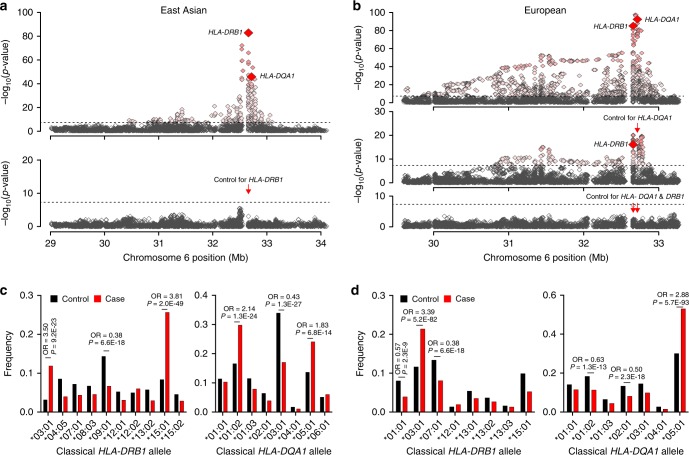
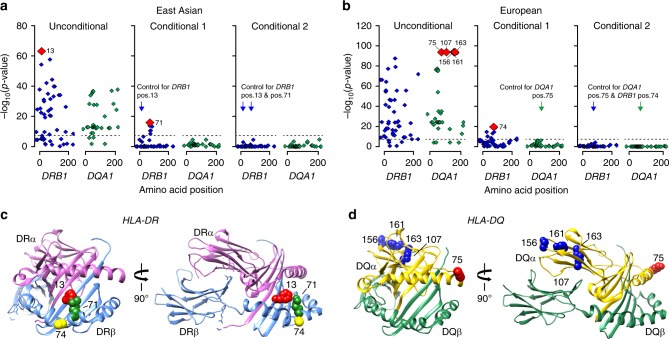
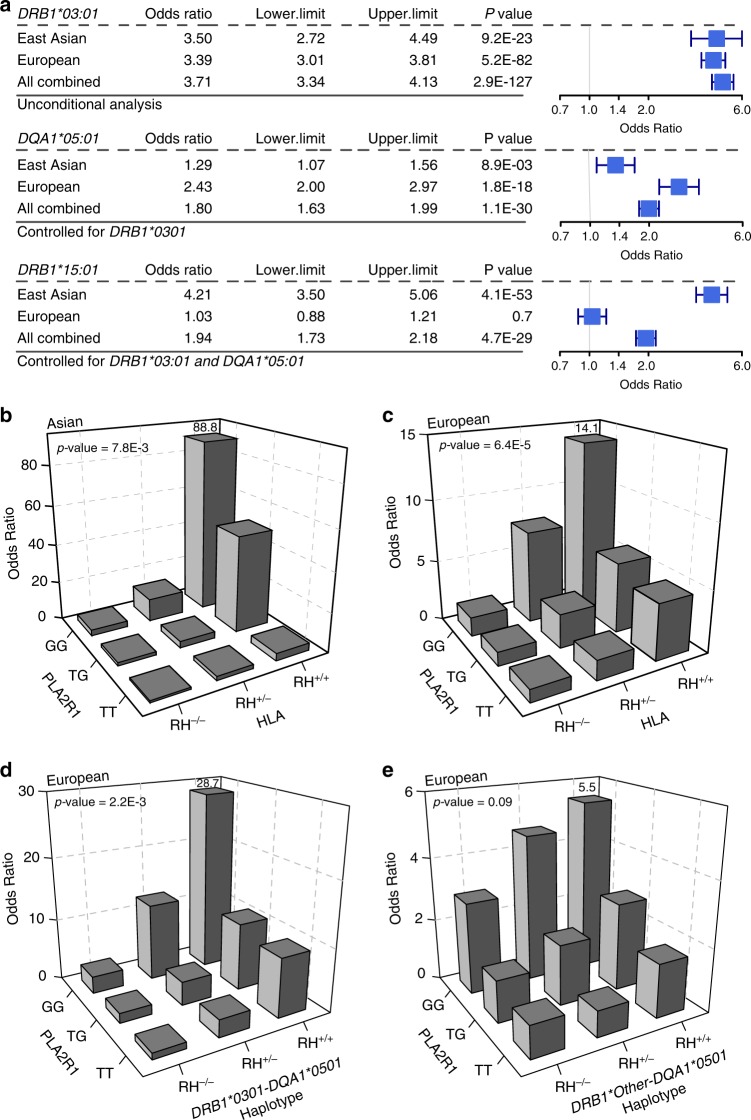
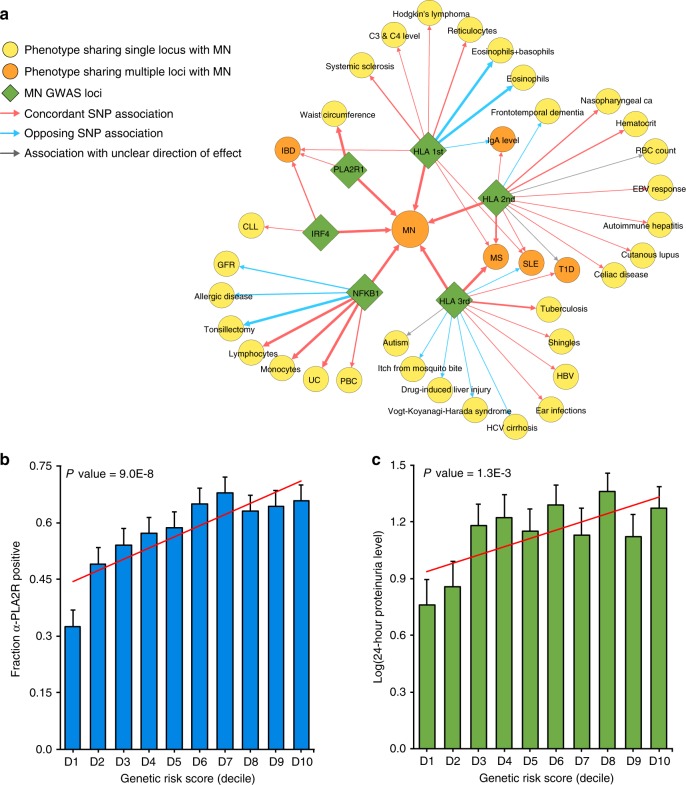
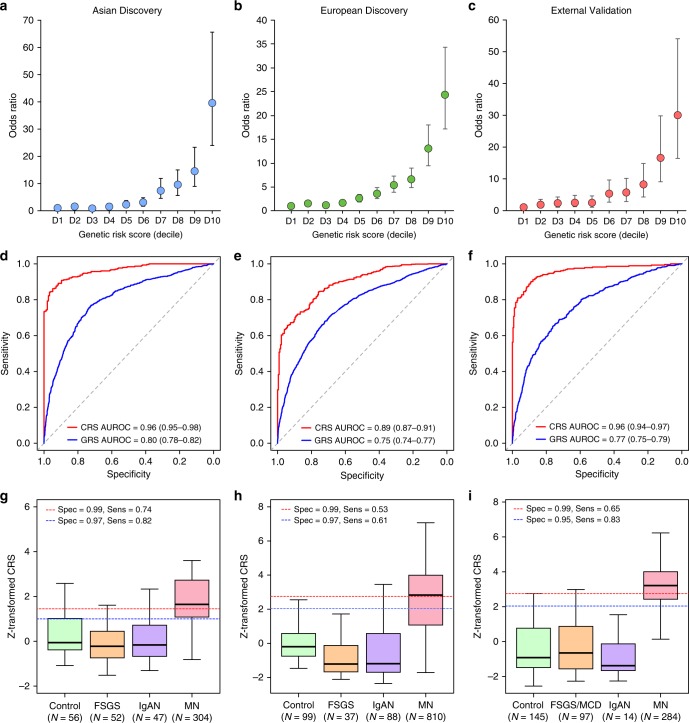
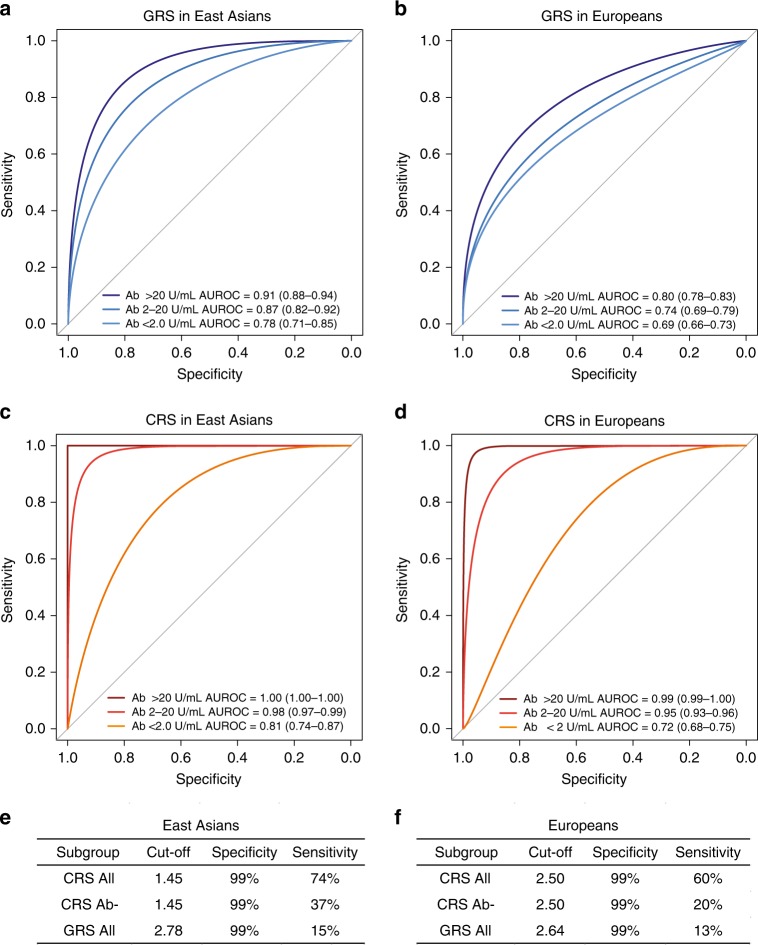
Membranous Nephropathy (MN) is a rare autoimmune cause of kidney failure. Here we report a genome-wide association study (GWAS) for primary MN in 3,782 cases and 9,038 controls of East Asian and European ancestries. We discover two previously unreported loci, NFKB1 (rs230540, OR = 1.25, P = 3.4 × 10⁻¹²) and IRF4 (rs9405192, OR = 1.29, P = 1.4 × 10⁻¹⁴), fine-map the PLA2R1 locus (rs17831251, OR = 2.25, P = 4.7 × 10-103) and report ancestry-specific effects of three classical HLA alleles: DRB1*1501 in East Asians (OR = 3.81, P = 2.0 × 10-49), DQA1*0501 in Europeans (OR = 2.88, P = 5.7 × 10-93), and DRB1*0301 in both ethnicities (OR = 3.50, P = 9.2 × 10⁻²³ and OR = 3.39, P = 5.2 × 10-82, respectively). GWAS loci explain 32% of disease risk in East Asians and 25% in Europeans, and correctly re-classify 20-37% of the cases in validation cohorts that are antibody-negative by the serum anti-PLA2R ELISA diagnostic test. Our findings highlight an unusual genetic architecture of MN, with four loci and their interactions accounting for nearly one-third of the disease risk.

Trial registration: ClinicalTrials.gov NCT01180036.


Conflict of interest statement

The authors declare no competing interests.

Figures

Fig. 1
Fig. 1. Manhattan and regional plots for non-HLA loci for the combined meta-analysis of all MN cohorts.
a The results of the combined meta-analysis across all cohorts; the dotted horizontal line indicates a genome-wide significance threshold (α = 5 × 10−8); the y-axis is truncated twice to accommodate large peaks over PLA2R1 and HLA loci; genome-wide-significant loci highlighted in red; b Regional plot for the PLA2R1 locus; the upper panel shows unconditioned meta-results, the lower panel depicts meta-results after conditioning for the top SNP (rs17831251). c Regional plot for the NFKB1 locus; the upper panel corresponds to unconditioned results; the lower panel shows meta-results after controlling for rs230540. d Regional plot for the IRF4 locus; the upper panel corresponds to unconditioned results; the lower panel shows meta-results after controlling for rs9405192. The x-axis denotes genomic location (hg19 coordinates), left y-axis represents –log P values for association statistics, right y-axis represents average recombination rates based on HapMap-III reference populations combined (blue line). In the conditional analyses, we conditioned on the top SNP in each individual cohort, then meta-analyzed conditioned summary statistics as described in the Methods.
Fig. 2
Fig. 2. Ethnicity-specific association analyses point to HLA-DRB1 and HLA-DQA1 as the top associated genes.
a Regional plot for East Asian cohorts that includes association statistics for all imputed variants and classical HLA alleles; the strongest association signal was for HLA-DRB1 gene (upper panel); the results for HLA-DQA1 gene are highlighted for reference; after adjusting for all DRB1 classical alleles (red arrow), there were no residual associations across the entire 3-Mb region (lower panel). The dotted horizontal line indicates the genome-wide significance threshold (α = 5 × 10−8). b In Europeans, the strongest HLA gene association was for the HLA-DQA1 gene (upper panel); after controlling for all classical DQA1 alleles (red arrow), HLA-DRB1 gene remained genome-wide significant (middle panel); after controlling for both DRB1 and DQA1, there were no significant associations in the region (lower panel), suggesting that variation in both genes explains the entire signal. c East Asian frequency distributions of classical DRB1 and DQA1 alleles (four-digit resolution) for cases (red) and controls (black); unadjusted ORs and P-values provided for genome-wide significant alleles. d The European frequency distributions of classical DRB1 and DQA1 alleles (four-digit resolution) for cases (red) and controls (black); unadjusted ORs and P-values provided for genome-wide significant alleles.
Fig. 3
Fig. 3. Ethnicity-specific association analyses of DRβ1 and DQα1 amino acid sequence.
a East Asian analysis of polymorphic amino acid positions within DRβ1 (blue) and DQα1 (green) molecules using conditional haplotype tests; the horizontal dash line marks the genome-wide significance level. The most strongly associated polymorphic site was position 13 in DRB1 (left panel); after controlling for this position, position 71 in DRB1 remained genome-wide significant (middle panel); after adjusting for both positions, there were no residual associations (right panel). b European analysis of polymorphic amino acid positions within DRβ1 (blue) and DQα1 (green); the DQA1 haplotype defined by amino acid positions 75, 107, 156, 161 and 163 (left panel) provided the strongest signal; after conditioning on this haplotype, position 74 in DRB1 remained genome-wide significant (middle panel); no additional independent positions were found upon further conditioning (right panel). c Protein structure of the DR molecule including α chain (pink ribbon) and β chain (blue ribbon), the side chains of amino acids at DRβ1 positions 13, 71, and 74 are located adjacent to each other in the P4 pocket of the peptide-binding groove. d Protein structure of the DQ molecule including α chain (yellow ribbon) and β chain (green ribbon); all five bi-allelic amino acid sites in DQα1 are in perfect LD with each other and define the top associated DQA1*0501 allele in Europeans.
Fig. 4
Fig. 4. Ethnicity-specific HLA allelic effects and genetic interactions.
a Stepwise conditioning of HLA risk alleles by ethnicity; Top: Unconditioned effect estimates, 95% confidence intervals, and P-values for DRB1*0301 demonstrate similar effects in East Asian and European cohorts. Middle: Effect estimates for DQA1*0501 after controlling for DRB1*0301 demonstrate significant heterogeneity, with stronger effects in the European cohorts (Cochrane’s Q P-value <0.05). Bottom: Effect estimates for DRB1*1501 after controlling for both DRB1*0301 and DQA1*0501 demonstrate significant heterogeneity with risk effect in East Asians but no effect in Europeans (Cochrane’s Q P-value < 0.05). b PLA2R1 genotype interaction with East Asian HLA risk haplotypes, DRB1*0301 or DRB1*1501 (N cases/controls = 803/1,956, P = 7.8 × 10−3). c PLA2R1 genotype interaction with European HLA risk haplotypes, DRB1*0301 or DQA1*0501 (N cases/controls = 1880/2627, multiplicative interaction test P = 6.4 × 10−5). d PLA2R1 genotype interaction with DRB1*0301-DQA1*0501 risk haplotype in Europeans (multiplicative interaction test P = 2.2 × 10−3). e No significant interaction between PLA2R1 and DQA1 risk haplotypes other than DQA1*0501-DRB1*0301 in Europeans (multiplicative interaction test P = 0.09). RH risk haplotype.
Fig. 5
Fig. 5. Pleiotropic effects of the MN loci and their clinical correlations.
a The pleiotropy map was constructed based on overlapping genome-wide significant loci reported in the GWAS Catalogue: traits sharing a single locus with MN are indicated in yellow; traits sharing multiple loci are indicated in orange; arrows represent allelic associations that are identical to, or in tight LD (r2 > 0.8) with the MN risk alleles; arrow thickness is proportional to r2 between alleles; concordant effects are indicated in red and opposed effects in blue. IBD: inflammatory bowel disease, includes ulcerative colitis (UC) and Crohn’s disease (CD); PBC primary biliary sclerosis, GFR glomerular filtration rate, CLL chronic lymphocytic leukemia, HBV hepatitis B virus; b Significant positive correlation of the GRS with anti-PLA2R antibody seropositivity (N = 1114 cases, Wald test P = 9.0 × 10−8) and c log-transformed 24-h proteinuria at diagnosis (N = 1329 cases, Slope test P = 1.3 × 10−3). The x-axis depicts deciles of GRS; error bars correspond to standard errors; the P-values are adjusted for age, sex, and ethnicity.
Fig. 6
Fig. 6. Diagnostic performance of the genetic risk score (GRS) and the combined risk score (CRS).
Genetic effects expressed as odds ratios (OR) and 95% confidence intervals in reference to the lowest decile of the GRS distribution for a East Asian discovery, b European discovery, and c European validation cohorts combined. GRS and CRS Receiver Operating Characteristics (ROC) curves for d East Asian discovery, e European discovery, and f European validation cohorts combined; AUROC Area under the ROC curve. Distributions of the CRS between healthy controls, diseased controls, and MN cases for g East Asian discovery, h European discovery, and i European validation cohorts combined. The box plots depict medians (horizontal lines), interquartile ranges (boxes), and minimum/maximum values (whiskers). The discovery CRS cut-offs of 1.00 and 1.45 in East Asians and 2.05 and 2.72 in Europeans have 97% and 99% specificity, respectively. The same European cut-offs were applied to the validation cohorts for comparisons of specificity and sensitivity.
Fig. 7
Fig. 7. Diagnostic properties of the genetic risk score (GRS) and combined risk score (CRS) stratified by anti-PLA2R antibody status.
Comparisons of receiver operating characteristic (ROC) curves to discriminate antibody positive (PLA2R Ab > 20 U/mL), borderline negative (PLA2R Ab 2–20 U/mL), and negative (PLA2R Ab < 2 U/mL) cases of primary MN from all available healthy and diseased controls combined for a GRS in East Asian discovery cohorts, b GRS in European discovery and validation cohorts, c CRS in East Asian discovery cohorts, d CRS in European discovery and validation cohorts. Overall sensitivities for risk score cut-offs corresponding to 99% specificities in (e) East Asian discovery cohorts and (f) European discovery and validation cohorts; CRS All: all patients with serum Ab measurements by ELISA within 6 months of a diagnostic kidney biopsy; CRS Ab-: patient subgroup with PLA2R Ab < 20 U/mL, and GRS All: all patients with GWAS data available for GRS calculation. AUROC: area under the ROC curve (95% confidence interval).

Comment in

  • Genetics of MN.
    Allison SJ. Allison SJ. Nat Rev Nephrol. 2020 Jun;16(6):316. doi: 10.1038/s41581-020-0282-9. Nat Rev Nephrol. 2020. PMID: 32265520 No abstract available.

References

    1. Glassock RJ. Diagnosis and natural course of membranous nephropathy. Semin Nephrol. 2003;23:324–332. doi: 10.1016/S0270-9295(03)00049-4. - DOI - PubMed
    1. Debiec H, et al. Antenatal membranous glomerulonephritis due to anti-neutral endopeptidase antibodies. N. Engl. J. Med. 2002;346:2053–2060. doi: 10.1056/NEJMoa012895. - DOI - PubMed
    1. Beck LH, Jr., et al. M-type phospholipase A2 receptor as target antigen in idiopathic membranous nephropathy. N. Engl. J. Med. 2009;361:11–21. doi: 10.1056/NEJMoa0810457. - DOI - PMC - PubMed
    1. Glassock RJ. The pathogenesis of membranous nephropathy: evolution and revolution. Curr. Opin. Nephrol. Hypertens. 2012;21:235–242. doi: 10.1097/MNH.0b013e3283522ea8. - DOI - PubMed
    1. Tomas NM, et al. Thrombospondin type-1 domain-containing 7A in idiopathic membranous nephropathy. N. Engl. J. Med. 2014;371:2277–2287. doi: 10.1056/NEJMoa1409354. - DOI - PMC - PubMed

Publication types

MeSH terms

Substances

Associated data