. 2020 Apr;52(4):437-447.
doi: 10.1038/s41588-020-0594-5. Epub 2020 Mar 30.

Minimal phenotyping yields genome-wide association signals of low specificity for major depression

Affiliations

Minimal phenotyping yields genome-wide association signals of low specificity for major depression

Na Cai et al. Nat Genet. 2020 Apr.

Abstract

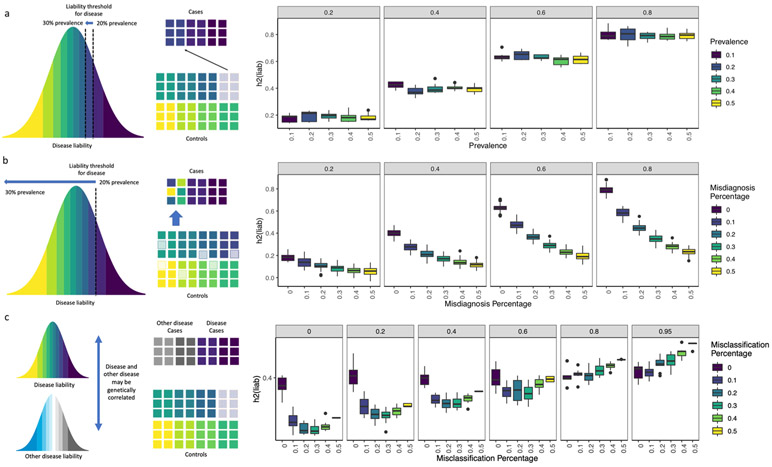
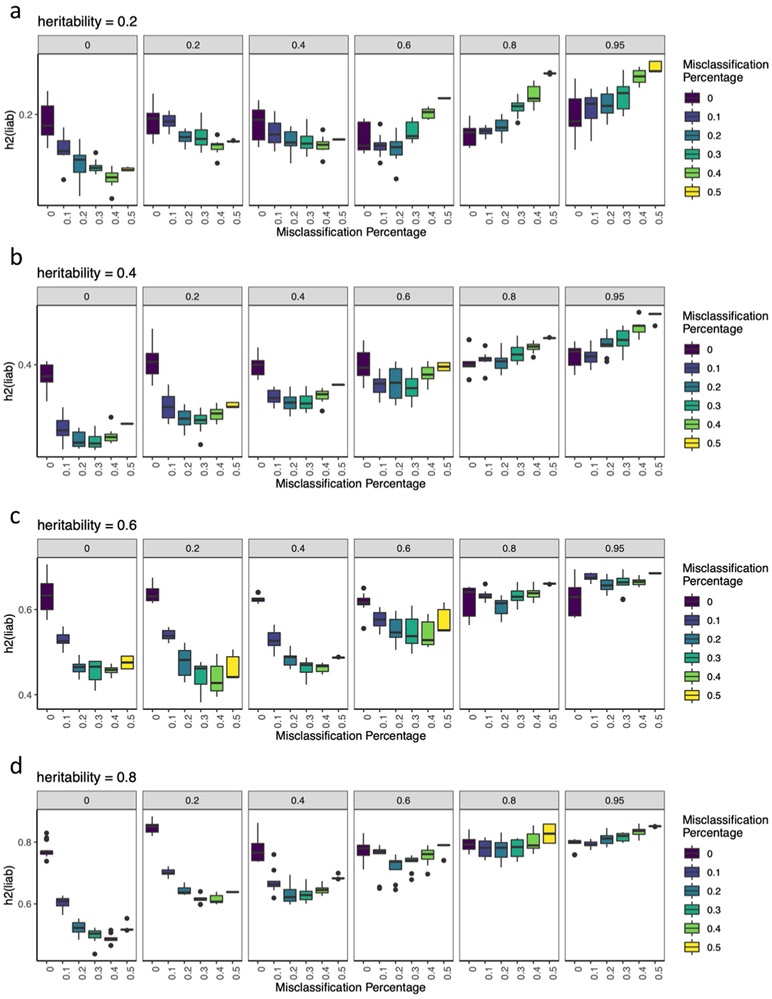
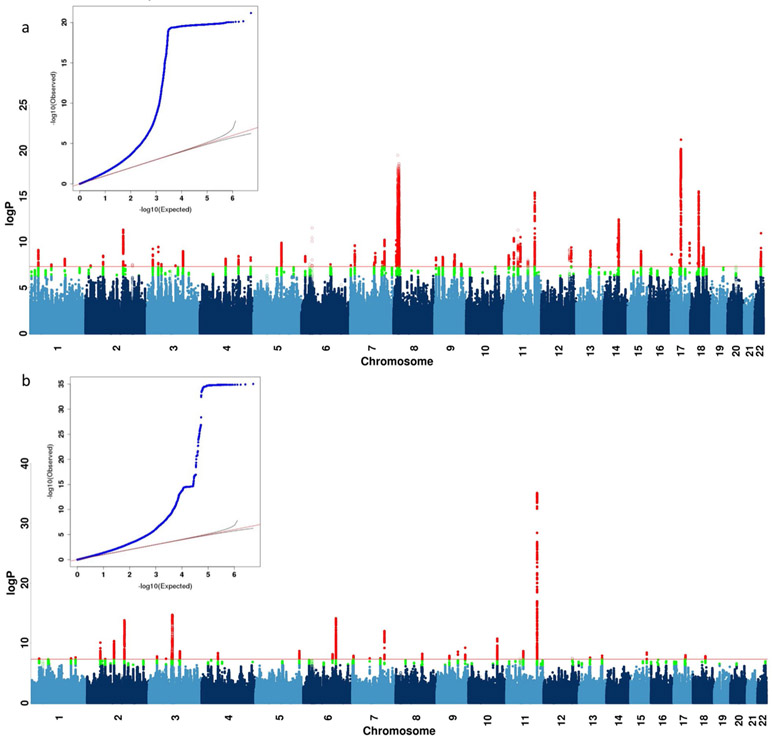
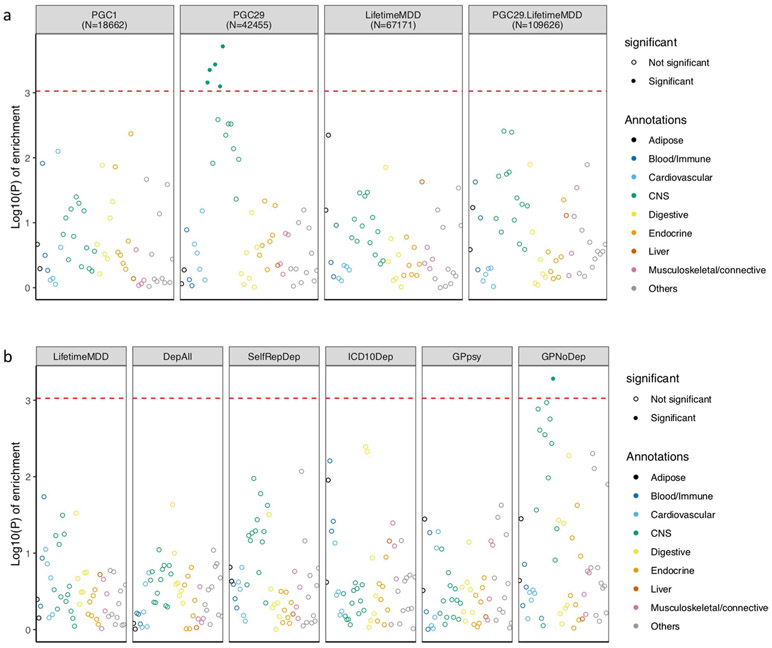
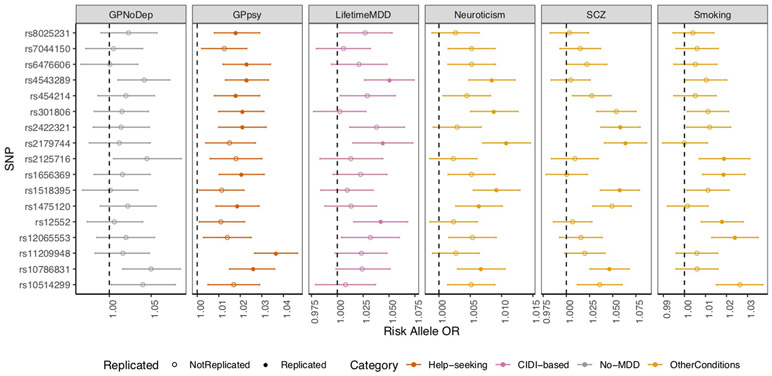
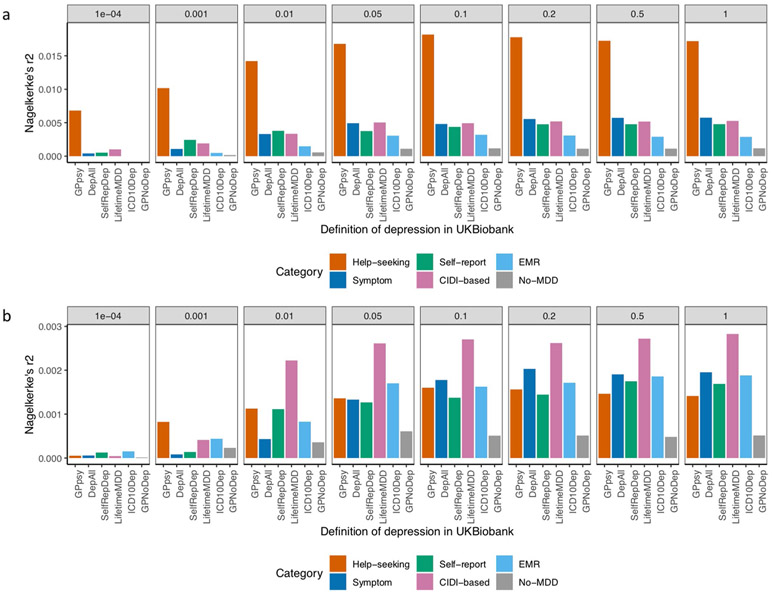
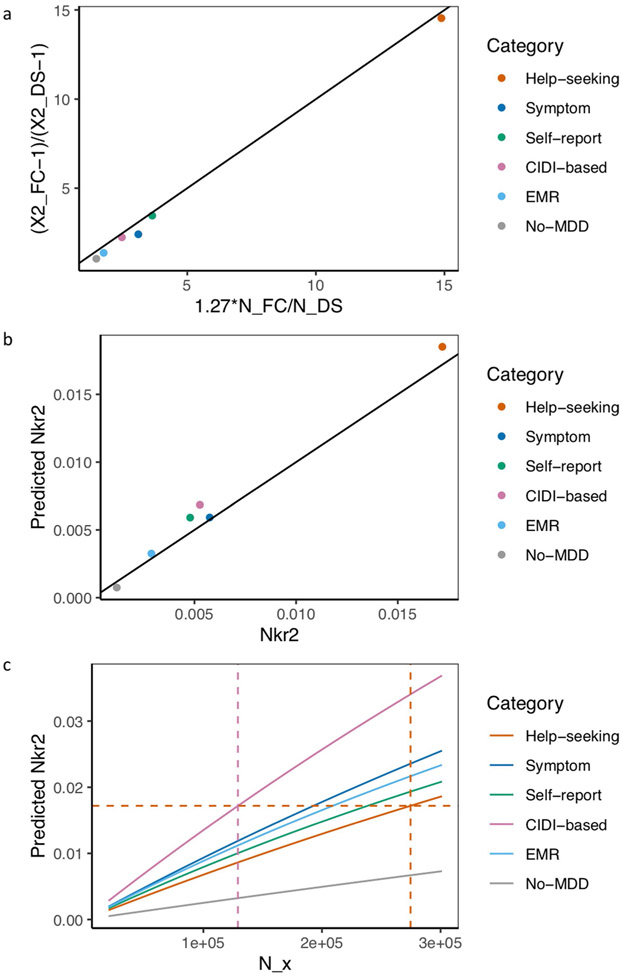
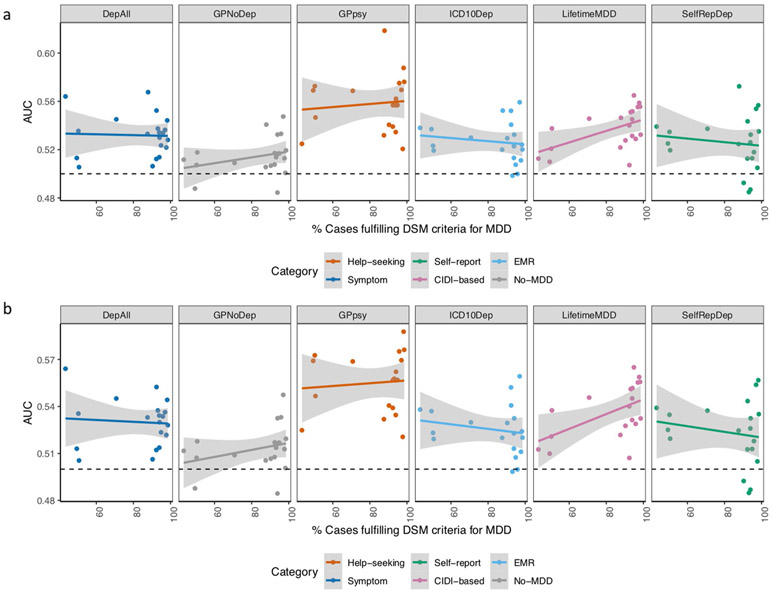
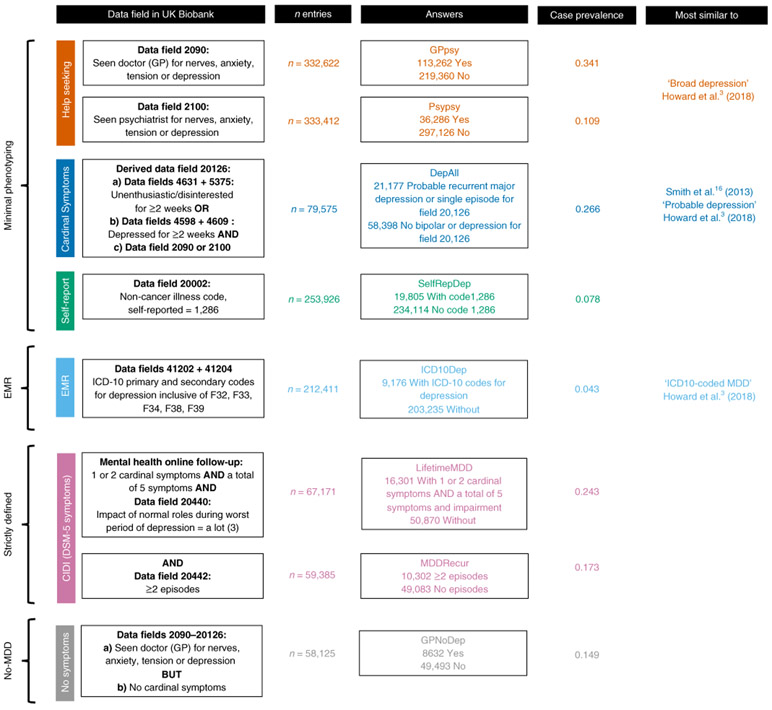
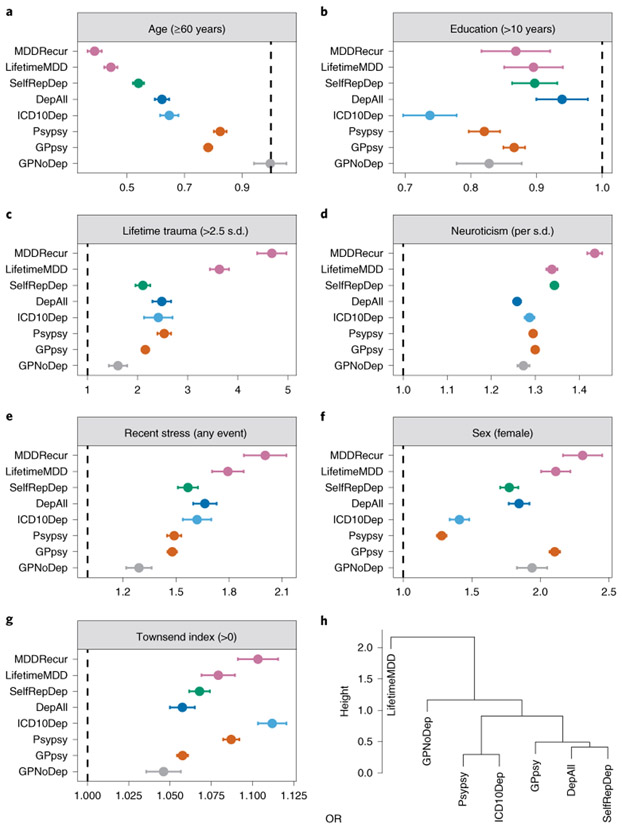
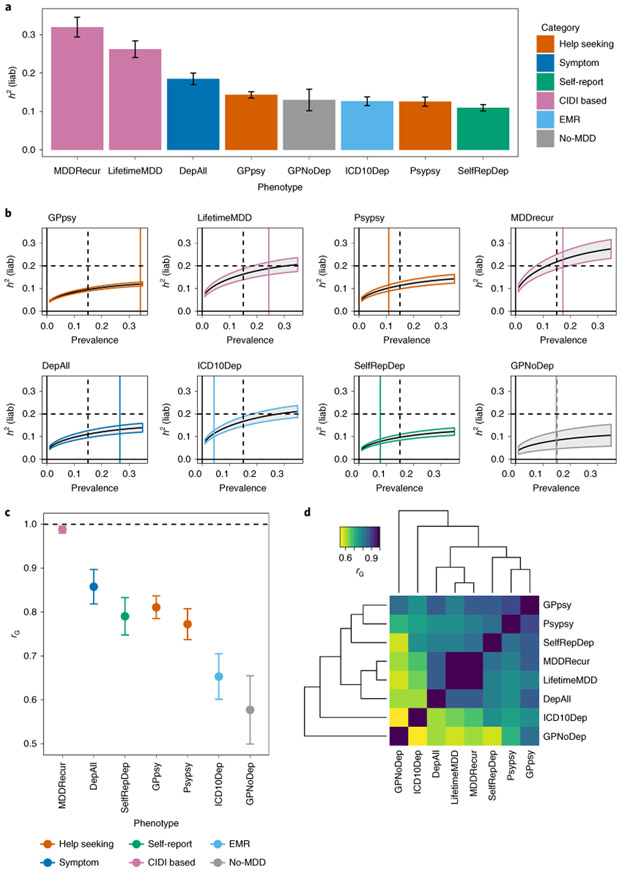
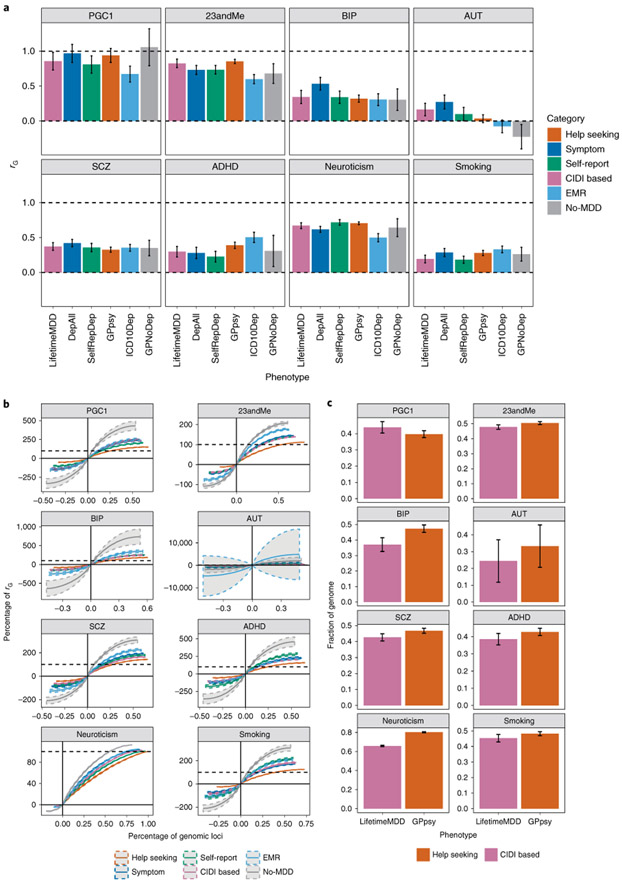
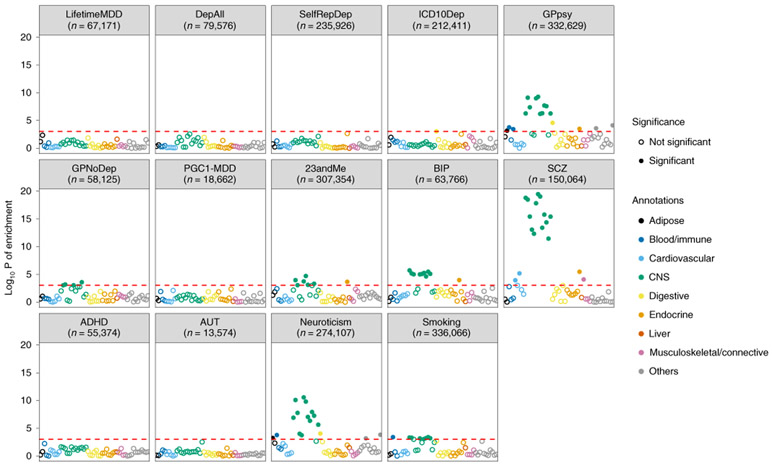
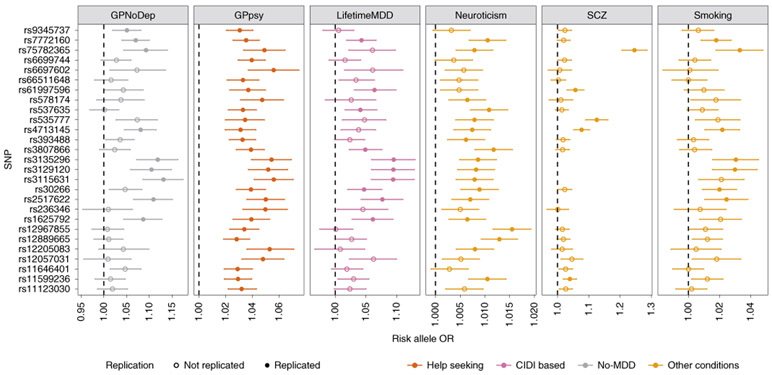
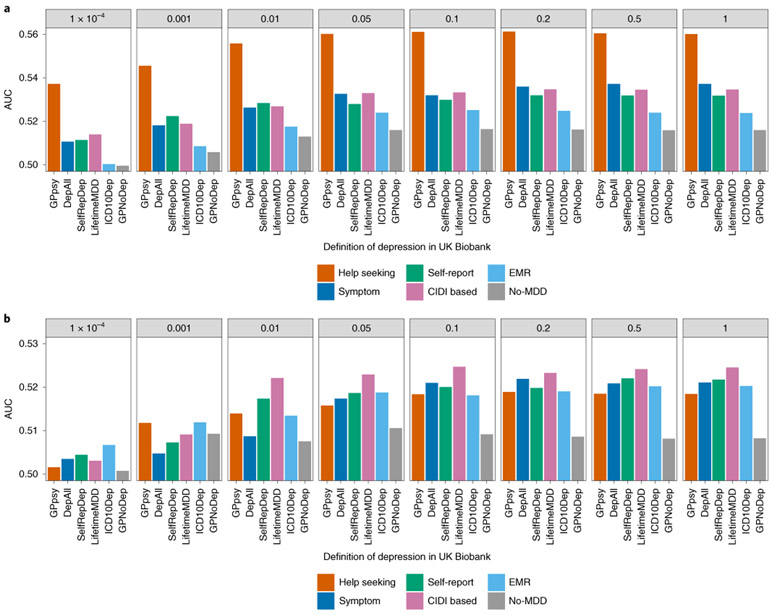
Minimal phenotyping refers to the reliance on the use of a small number of self-reported items for disease case identification, increasingly used in genome-wide association studies (GWAS). Here we report differences in genetic architecture between depression defined by minimal phenotyping and strictly defined major depressive disorder (MDD): the former has a lower genotype-derived heritability that cannot be explained by inclusion of milder cases and a higher proportion of the genome contributing to this shared genetic liability with other conditions than for strictly defined MDD. GWAS based on minimal phenotyping definitions preferentially identifies loci that are not specific to MDD, and, although it generates highly predictive polygenic risk scores, the predictive power can be explained entirely by large sample sizes rather than by specificity for MDD. Our results show that reliance on results from minimal phenotyping may bias views of the genetic architecture of MDD and impede the ability to identify pathways specific to MDD.


Figures

Extended Data Fig. 1 ∣
Extended Data Fig. 1 ∣. Simulations of misdiagnosis and misclassification.
a-c, Each boxplot show h2SNP estimates from 10 simulated phenotypes, with upper and lower boundaries of boxes represent the first to third quartiles of all estimates, and the whiskers extends to 1.5 times the interquartile range of the estimates. a, This figure shows that liability scale h2SNP does not change with shifting of liability threshold Ki∈{0.1, 0.2, 0.3, 0.4, 0.5} for simulated heritabilities hi2 ∈ {0.2, 0.4, 0.6, 0.8}. b, The figure shows that liability scale h2SNP is deflated with increasing percentage of controls being misdiagnosed as cases, when prevalence of diagnosed cases is kept constant at Ki=0.2, for simulated heritabilities hi2 ∈ {0.2, 0.4, 0.6, 0.8}. c, This figure shows liability scale h2SNP is deflated with increasing percentage of misclassification of cases of “other” disease as cases of focal disease, if rG between the two diseases are moderate to low, for simulated hi,12=0.4, for each of which all cases at prevalence Ki,1=0.2 are correctly identified as cases.
Extended Data Fig. 2 ∣
Extended Data Fig. 2 ∣. Simulations of misclassification at different heritabilities.
a-d, These figures shows the estimated h2SNP using-pcgc option with-prevalence K in LDAK, plotted on the y-axis) of binary traits (yi,1, where i ∈{1..10}) with simulated hi,120.2, 0.4, 0.6, and 0.8, for each of which all cases (at prevalence Ki,1 = 0.2) are correctly identified as cases, while varying numbers of cases misclassified from a genetically correlated binary trait (yi,2, where i∈{1..10}) of equal hi,12 and prevalence as cases of yi,1. Genetic correlations between yi,1 and yi,2 (rGi∈{0, 0.2, 0.4, 0.6, 0.8, 0.95}) are shown in the grey bars above each panel. Each boxplot show h2SNP estimates from 10 simulated phenotypes, with upper and lower boundaries of boxes represent the first to third quartiles of all estimates, and the whiskers extends to 1.5 times the interquartile range of the estimates.
Extended Data Fig. 3 ∣
Extended Data Fig. 3 ∣. GWAS on neuroticism and smoking in UK Biobank.
a, b, This figure shows the Manhattan plot of neuroticism score (data field 20127, quantitative trait from 0 to 12) in 274,107 individuals and ever smoked status (data field 20160, binary trait of 0 for “No”, and 1 for “Yes”) in 336,066 individuals in UK Biobank using linear regression on all 8,968,716 common SNPs (MAF > 5% in all 337,198 White-British, unrelated samples) for all the above analyses in PLINK (version 1.9) with 20 PCs and genotyping array as covariates. We report all associations with P-values smaller than 5×10⁻⁸ as genome-wide significant (red). We indicated the SNPs in SVs and the MHC in all Manhattan plots as hollow points instead of solid points due to lack of control for population structure in these regions, and show all top SNPs within peaks (1-Mb regions) in Supplementary Tables 10 and 11.
Extended Data Fig. 4 ∣
Extended Data Fig. 4 ∣. LDSC-SEG analysis of tissue-specific enrichment of h2SNP.
a, This figure shows −log10(P) of enrichment in heritability in genes specifically expressed in 44 GTEx tissues, estimated using partitioned heritability in LDSC-SEG, on LifetimeMDD (n = 67,171), PGC1-MDD (n = 18,759), PGC29 (n = 42,455) and a meta-analysis of LifetimeMDD and PGC29 (n = 109,626, PC29.LifetimeMDD, Methods). While PGC29 shows CNS enrichment, neither LifetimeMDD nor the meta-analysis shows the same enrichment. This suggests sample size and differences in genetic architecture and cohort heterogeneity affects results from LDSC-SEG. b, This figure shows the same analysis performed on down-sampled data for each definition of depression. Each definition is randomly down-sampled to 7,500 cases and 42,500 controls, a constant prevalence of 0.15, to remove confounding from sample size and difference in statistical power on the enrichment analysis. This figure shows that at equal sample size and prevalence, GPNoDep (no-MDD Help-seeking phenotype) is the only one showing CNS enrichment, suggesting it may be driving the CNS enrichment signal in GPpsy in Fig. 5.
Extended Data Fig. 5 ∣
Extended Data Fig. 5 ∣. GWAS hits from 23andMe are not specific to MDD.
This figure shows the odds ratios of risk alleles (Risk Allele ORs) at 17 loci significantly associated with help-seeking based definitions of MDD in 23andMe27, in GWAS conducted on CIDI-based (LifetimeMDD, in purple), help-seeking (GPpsy in red) and no-MDD (GPNoDep, in orange) based definitions of MDD, as well as conditions other than MDD: neuroticism, smoking and SCZ (all in brown). SNPs missing in each panel are not tested in the respective GWAS. For clarity of display, scales on different panels vary to accommodate the different magnitudes of ORs of SNPs in different conditions. ORs at all 17 loci are highly consistent across phenotypes, regardless of whether it is a definition or MDD or a risk factor or condition other than MDD. All results are shown in Supplementary Table 20. Error bars show the standard errors of the estimates.
Extended Data Fig. 6 ∣
Extended Data Fig. 6 ∣. Out-of-sample prediction in PGC cohorts.
a, This figure shows the Nagelkerke’s r2 of polygenic risk scores (PRS) calculated for each definition of depression in UK Biobank and MDD status indicated in 19 PGC29-MDD cohorts, while controlling for cohort specific effects. PRS were calculated using effect sizes at independent (LD r2 < 0.1) SNPs passing P-value thresholds 10−4, 0.001, 0.01, 0.05, 0.01, 0.2, 0.5 and 1 respectively, in GWAS performed on all definitions of depression in UK Biobank. b, This figure shows the same analysis performed on down-sampled data (7,500 cases, 42,500 controls) for each definition of depression.
Extended Data Fig. 7 ∣
Extended Data Fig. 7 ∣. Relationship between effective sample size and prediction accuracy.
a, This figure shows the relationship between the ratio of effective sample sizes between the full cohort (NFC) and down-sampled (NDS) data for each definition of depression and the ratio of their mean Chi-square (χ2) statistic from GWAS, with black line x = y for reference. Across all definitions of depression, χFC2¯1χDS2¯1 is highly correlated with NFCNDS (Pearson r2 = 0.999, P = 5.50×10⁻⁷), and NFCNDS has an effect of beta = 1.27 (s.e. = 0.02) on χFC2¯1χDS2¯1. b, This figure shows the Nagelkerke’s r2 (Nkr2) for MDD status in PGC29 cohorts predicted for PRS of different definitions of depression at NFC, plotted against their respective empirical Nkr2 at NFC, both at P-value threshold = 1. The Pearson correlation r2 between predicted and actual NKr2 across all definitions were 0.989 (P = 4.46×10⁻⁵). c, This figure shows for each definition of depression the effective sample size NX required for each predicted Nkr2 in out-of-sample prediction of MDD status in PGC29 cohorts. While Nx= 274,677 (indicated with orange vertical dotted line) for GPpsy to achieve a Nkr2 of 0.0172 (indicated with orange horizontal dotted line), a smaller Nx= 129,106 (indicated with pink vertical dotted line) is needed to achieve the same Nkr2 for LifetimeMDD.
Extended Data Fig. 8 ∣
Extended Data Fig. 8 ∣. Prediction accuracy in cohorts with different percentage of DSM MDD cases.
a, This figure shows the area under the curve (AUC) of polygenic risk scores (PRS) calculated for each definition of depression in UK Biobank and MDD status indicated in 20 PGC29-MDD cohorts at P-value threshold of 0.1 (using all SNPs after LD-clumping, see results at all P-value thresholds in Supplementary Table 23), plotting AUC for each cohort against their respective percentage of cases fulfilling DSM-5 criteria A for MDD (see Supplementary Table 21). It shows that strictly defined CIDI-based LifetimeMDD is the only definition of depression in UK Biobank that shows increases in AUC as percentage of cases fulfilling DSM-5 criteria A for MDD in PGC cohorts increases, despite not giving the highest AUC. b, This figure shows the same analysis removing the PGC29-MDD cohort rad3, which is the outlier giving AUC > 0.6 in GPpsy in a. As this is a UK-based cohort, it is possible it contains relatives of individuals in UK Biobank that upwardly biased prediction accuracy in it. For all analysis shown in Fig. 7, Extended Data Figs. 6 and 7 and Supplementary Table 23, we have removed this cohort.
Fig. 1 ∣
Fig. 1 ∣. Definitions of depression in UK Biobank.
This figure shows the different definitions of MDD in the UK Biobank and the color coding used consistently in this paper. The minimal phenotyping definitions of depression are shown in red for help-seeking definitions derived from the Touchscreen Questionnaire; blue for symptom-based definitions derived from the Touchscreen Questionnaire; and green for the self-report-based definition derived from the Verbal Interview. The EMR definition of depression is shown in orange for definitions based on ICD-10 codes. Strictly defined MDD is shown in purple for CIDI-based definitions derived from the Online Mental Health Follow-up. The no-MDD definition is shown in brown for GPNoDep, containing cases in help-seeking definitions that did not have cardinal symptoms for MDD. The data fields in the UK Biobank relevant for defining each phenotype are shown in ‘Data field in UK Biobank’; the number of individuals with non-missing entries for each definition are shown in ‘n entries’; the qualifying answers for cases and controls are shown in ‘Answers’; the case prevalence in each definition is shown in ‘Case prevalence’; and the study and definitions of depression most similar to our definitions are shown in ‘Most similar to’. The similarities and differences between help-seeking, EMR and symptom-based definitions in comparison to previously reported definitions of depression can be found in the Supplementary Note.
Fig. 2 ∣
Fig. 2 ∣. Relationship between definitions of depression and environmental risk factors.
a–g, Forest plots of ORs of known environmental risk factors and different types (categories) of definitions of depression in the UK Biobank (Definition) from logistic regression, using UK Biobank assessment center, age, sex and years of education as covariates to control for potential geographic and demographic differences between environmental risk factors, except when they were tested. The lifetime trauma measure was derived from the Online Mental Health Follow-up (Supplementary Note and Supplementary Table 7); the Townsend deprivation index, years of education, sex, age, recent stress and neuroticism were derived from Touchscreen Questionnaire (Supplementary Note). h, Hierarchical clustering of definitions of depression in the UK Biobank using ORs with environmental risk factors, performed using the hclust function in R; ‘height’ refers to the Euclidean distance between MDD definitions at the ORs of all six risk factors. MDDRecur was not included in this clustering analysis as it is a subset of the LifetimeMDD definition. The statistics used to generate these plots are presented as source data.
Fig. 3 ∣
Fig. 3 ∣. SNP heritability and genetic correlation estimates among definitions of MDD in UK Biobank.
a, h2SNP estimates from PCGC on each of the definitions of MDD in the UK Biobank (Methods). h2SNP (represented as h2(liab)) was converted to the liability scale, using the observed prevalence of each definition of depression in the UK Biobank as both population and sample prevalence (Supplementary Table 4). Error bars show the s.e. of the estimates. b, h2SNP estimates of definitions of MDD in the UK Biobank from LDSC using logistic regression summary statistics on all SNPs with minor allele frequency (MAF) > 5% (Methods), transformed to the liability scale assuming a range of population case prevalence values, from 0 to 0.5. We do not show results for case prevalence from 0.5 to 1, as they would mirror those from 0 to 0.5, with shaded area representing the s.e. of the estimates. We indicate with a black vertical dashed line the population prevalence of 0.15, used in PGC1-MDD; a colored vertical line shows the population prevalence of each definition of depression in the UK Biobank. We also indicate with a black horizontal dashed line the arbitrary liability-scale h2SNP of 0.2, previously estimated for MDD in PGC1-MDD. Using this, we show that at no prevalence would minimal phenotyping-defined depression such as GPpsy (help-seeking definition) reach this estimate. c, Genetic correlation ‘rG’ between CIDI-based LifetimeMDD and all other definitions of MDD in the UK Biobank, estimated using PCGC. Error bars show the s.e. of the estimates. d, Pairwise rG between all definitions of depression in the UK Biobank, also detailed in Supplementary Table 15.
Fig. 4 ∣
Fig. 4 ∣. Genetic correlation between definitions of MDD and other psychiatric conditions.
a, The genetic correlation estimated by cross-trait LDSC on the liability scale between definitions of MDD in the UK Biobank and other psychiatric conditions in both the UK Biobank (smoking and neuroticism) and PGC (Supplementary Table 1), including schizophrenia (SCZ) and bipolar disorder (BIP) (Supplementary Table 1). Error bars show the s.e. of the estimates. AUT, autism; ADHD, attention deficit/hyperactivity disorder. b, The cumulative fraction of regional genetic correlation (out of the sum of regional genetic correlation across all loci) between definitions of MDD in the UK Biobank and schizophrenia in 1,703 independent loci in the genome estimated using rho-HESS, plotted against the percentage of independent loci. CIDI-based LifetimeMDD is shown in purple, while help-seeking-based GPpsy is shown in red. The steeper the curve, the smaller the number of loci explaining the total genetic correlation. The dashed colored curves around each solid line represent the s.e. of the estimate computed using a jackknife approach as described in Shi et al. The dashed black line represents 100% of the sum of genetic correlation between each definition of MDD in the UK Biobank and schizophrenia. The cumulative sums of positive regional genetic correlations (right of y axis) go beyond 100%; this is mirrored by the negative regional genetic correlations (left of y axis) that go below 0%. c, We ranked all 1,703 loci by their magnitude of genetic correlation and asked what fraction of loci summed to 90% of total genetic correlation. This figure shows the percentage of loci summing to 90% of total genetic correlation between either LifetimeMDD (in purple) or GPpsy (in red) and all psychiatric conditions tested, with s.e. estimated using the same jackknife approach. The higher the percentage, the higher the number of genetic loci contributing to 90% of total genetic correlation. Error bars show the s.e. of the estimates.
Fig. 5 ∣
Fig. 5 ∣. Tissue-specific gene expression enrichment in definitions of MDD.
The −log10 P value is shown for enrichment in h2SNP in genes specifically expressed in 44 GTEx tissues, estimated using partitioned h2SNP in LDSC; the help-seeking based definition of MDD (GPpsy), as well as its constituent no-MDD phenotype (GPNoDep), showed enrichment of h2SNP in genes specifically expressed in CNS tissues, similarly to an independent cohort of help-seeking-based MDD (23andMe) and other psychiatric conditions such as bipolar disorder, schizophrenia, autism, personality dimension neuroticism, and the behavioral trait smoking. We indicate the sample size (n) for each definition of depression and psychiatric condition.
Fig. 6 ∣
Fig. 6 ∣. GWAS hits from minimal phenotyping definition of MDD in the UK Biobank are not specific to MDD.
ORs are shown for the risk alleles at 27 loci significantly associated with help-seeking definitions of MDD in the UK Biobank (GPpsy and Psypsy), in logistic regression GWAS conducted using MDD definitions based on on CIDI (LifetimeMDD, in purple), help seeking (GPpsy, in red) and no-MDD (GPNoDep, in brown) based definitions of MDD. For comparison, we show the same in conditions other than MDD: neuroticism, smoking and schizophrenia (all in pink). SNPs missing in each panel were not tested in the respective GWAS. For clarity of display, scales on different panels vary to accommodate the different magnitudes of ORs of SNPs in different conditions. ORs at all 27 loci were highly consistent across phenotypes, being completely aligned in direction of effect, regardless of whether it was a definition of MDD or a risk factor or condition other than MDD. All results are shown in Supplementary Table 14. Error bars show the s.e. of the estimates.
Fig. 7 ∣
Fig. 7 ∣. Out-of-sample prediction of MDD in PGC cohorts.
a, The AUC of PRSs calculated for each definition of depression in the UK Biobank and MDD status indicated in 19 PGC29-MDD cohorts, while controlling for cohort-specific effects. PRSs were calculated using effect sizes at independent (LD r2 < 0.1) SNPs passing P-value thresholds of 10−4, 0.001, 0.01, 0.05, 0.01, 0.2, 0.5 and 1, in GWAS performed on all definitions of depression in the UK Biobank. b, This figure shows the same analysis performed on downsampled data (7,500 cases and 42,500 controls) for each definition of depression.

References

    1. Lu JT, Campeau PM & Lee BH Genotype–phenotype correlation: promiscuity in the era of next-generation sequencing. Obstet. Gynecol. Surv 69, 728–730 (2014). - PubMed
    1. Ripke S et al. Genome-wide association analysis identifies 13 new risk loci for schizophrenia. Nat. Genet 45, 1150–1159 (2013). - PMC - PubMed
    1. Howard DM et al. Genome-wide association study of depression phenotypes in UK Biobank identifies variants in excitatory synaptic pathways. Nat. Commun 9, 1470 (2018). - PMC - PubMed
    1. Hyde CL et al. Identification of 15 genetic loci associated with risk of major depression in individuals of European descent. Nat. Genet 48, 1031–1036 (2016). - PMC - PubMed
    1. Wray NR et al. Genome-wide association analyses identify 44 risk variants and refine the genetic architecture of major depression. Nat. Genet 50, 668–681 (2018). - PMC - PubMed

Publication types