. 2020 May;21(5):578-587.
doi: 10.1038/s41590-020-0633-5. Epub 2020 Mar 30.

Beta cell-specific CD8+ T cells maintain stem cell memory-associated epigenetic programs during type 1 diabetes

Affiliations

Beta cell-specific CD8+ T cells maintain stem cell memory-associated epigenetic programs during type 1 diabetes

Hossam A Abdelsamed et al. Nat Immunol. 2020 May.

Abstract

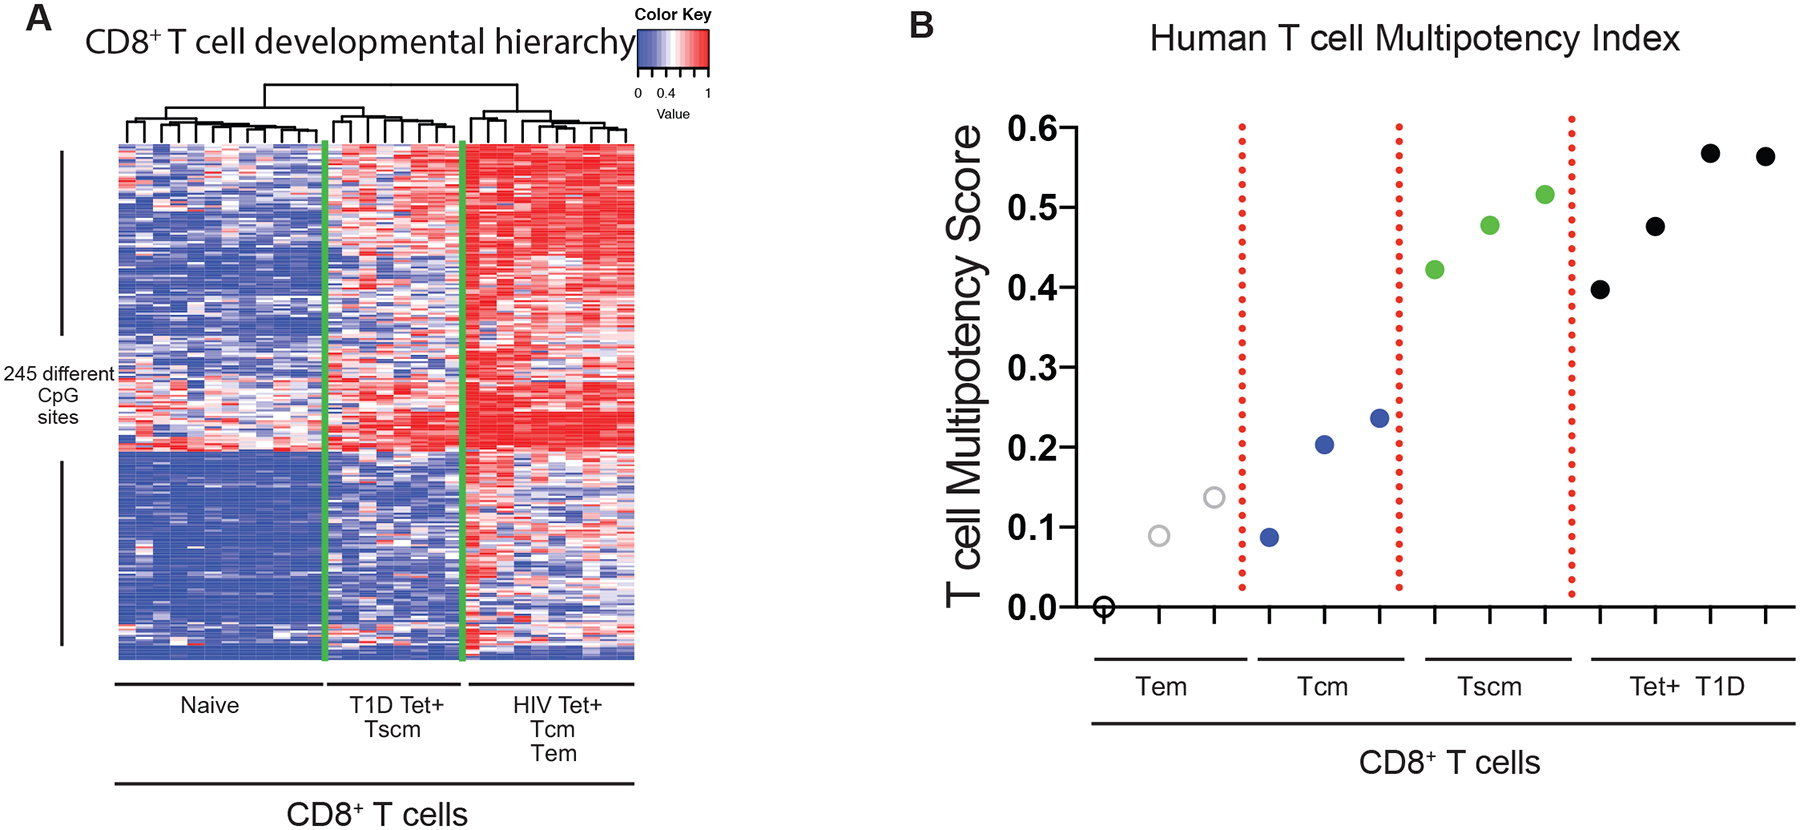
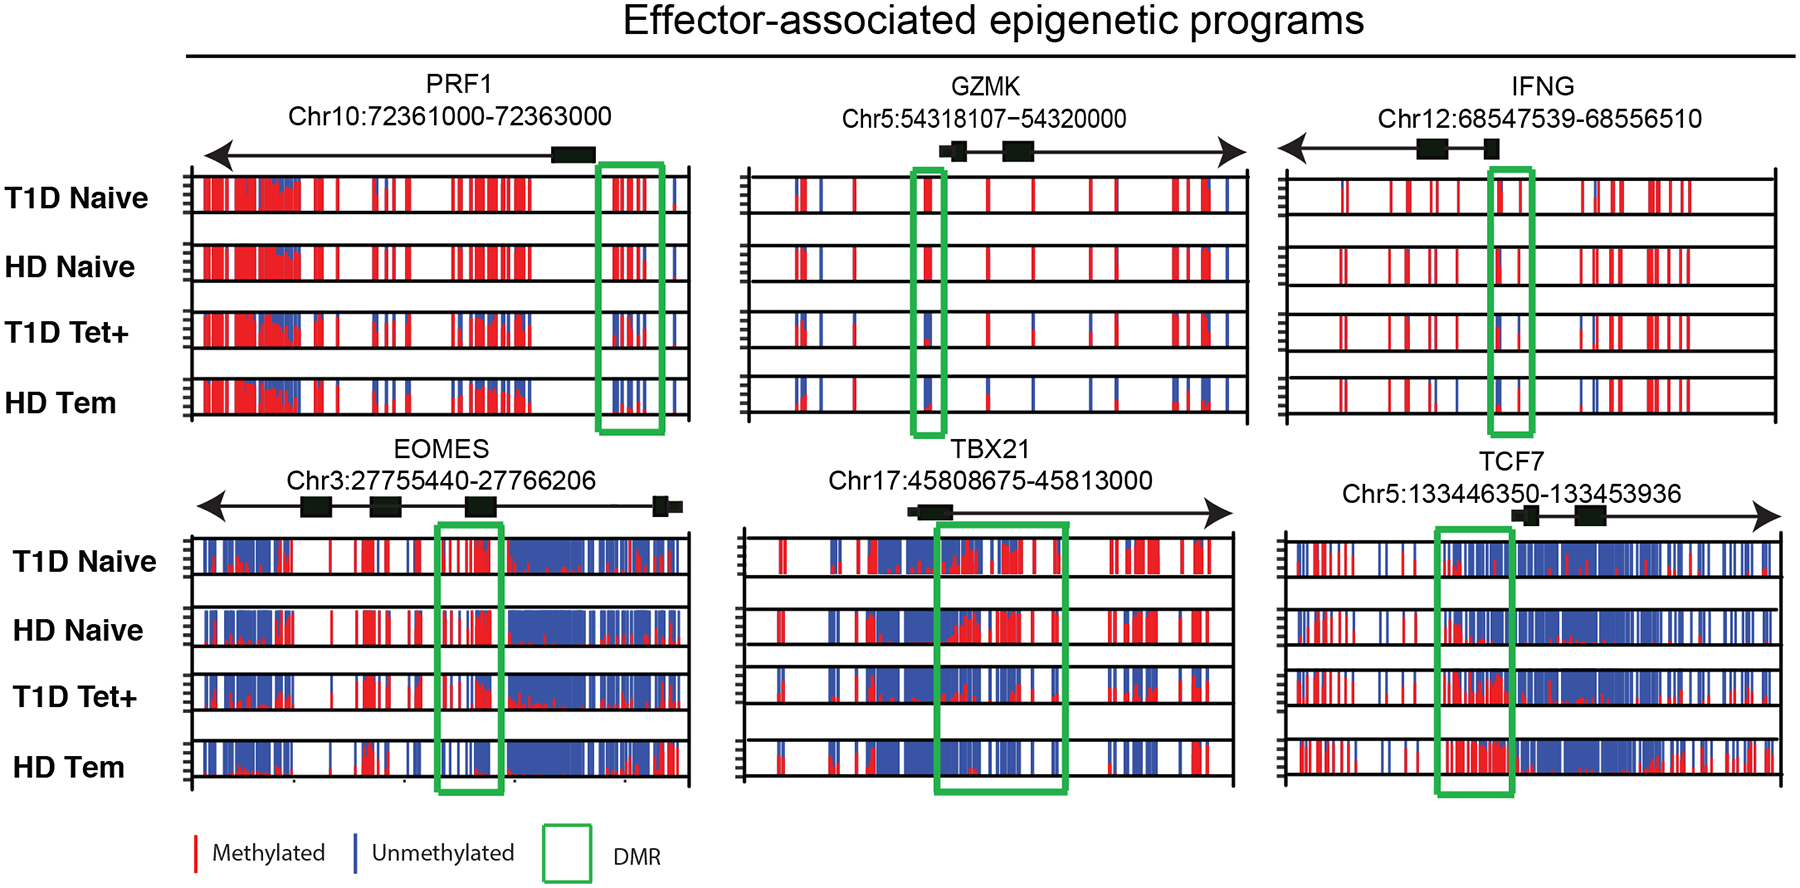
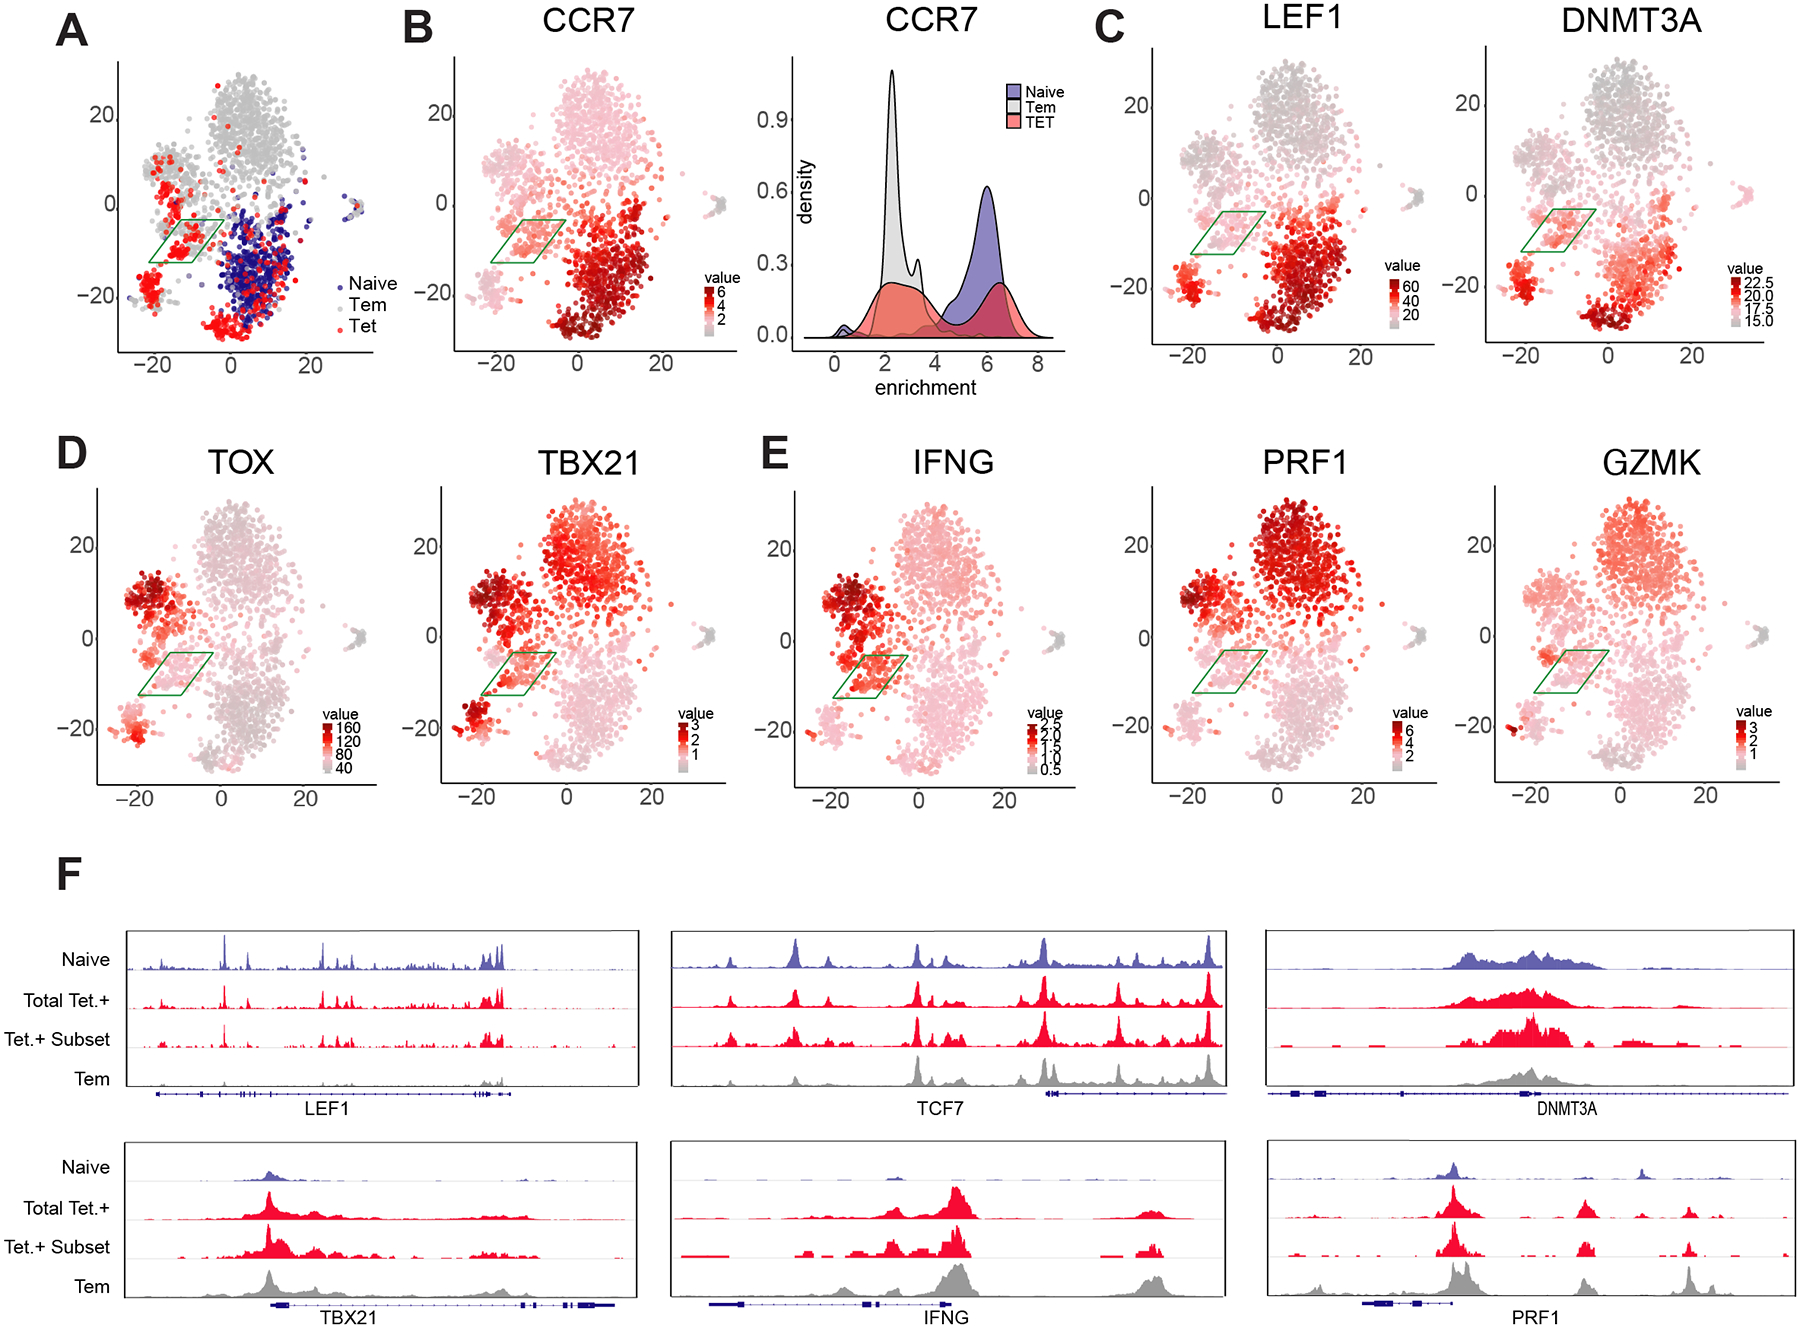
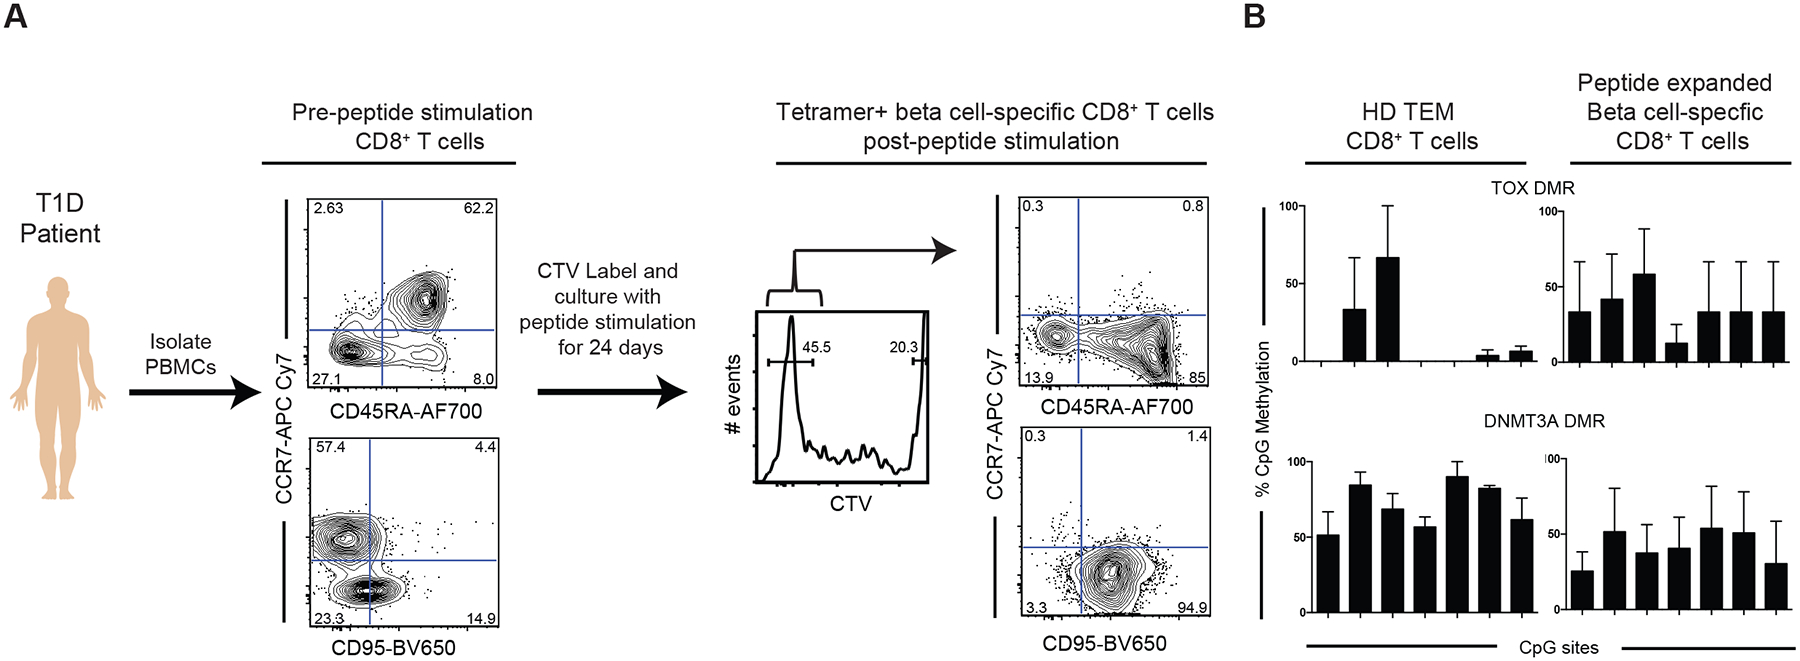
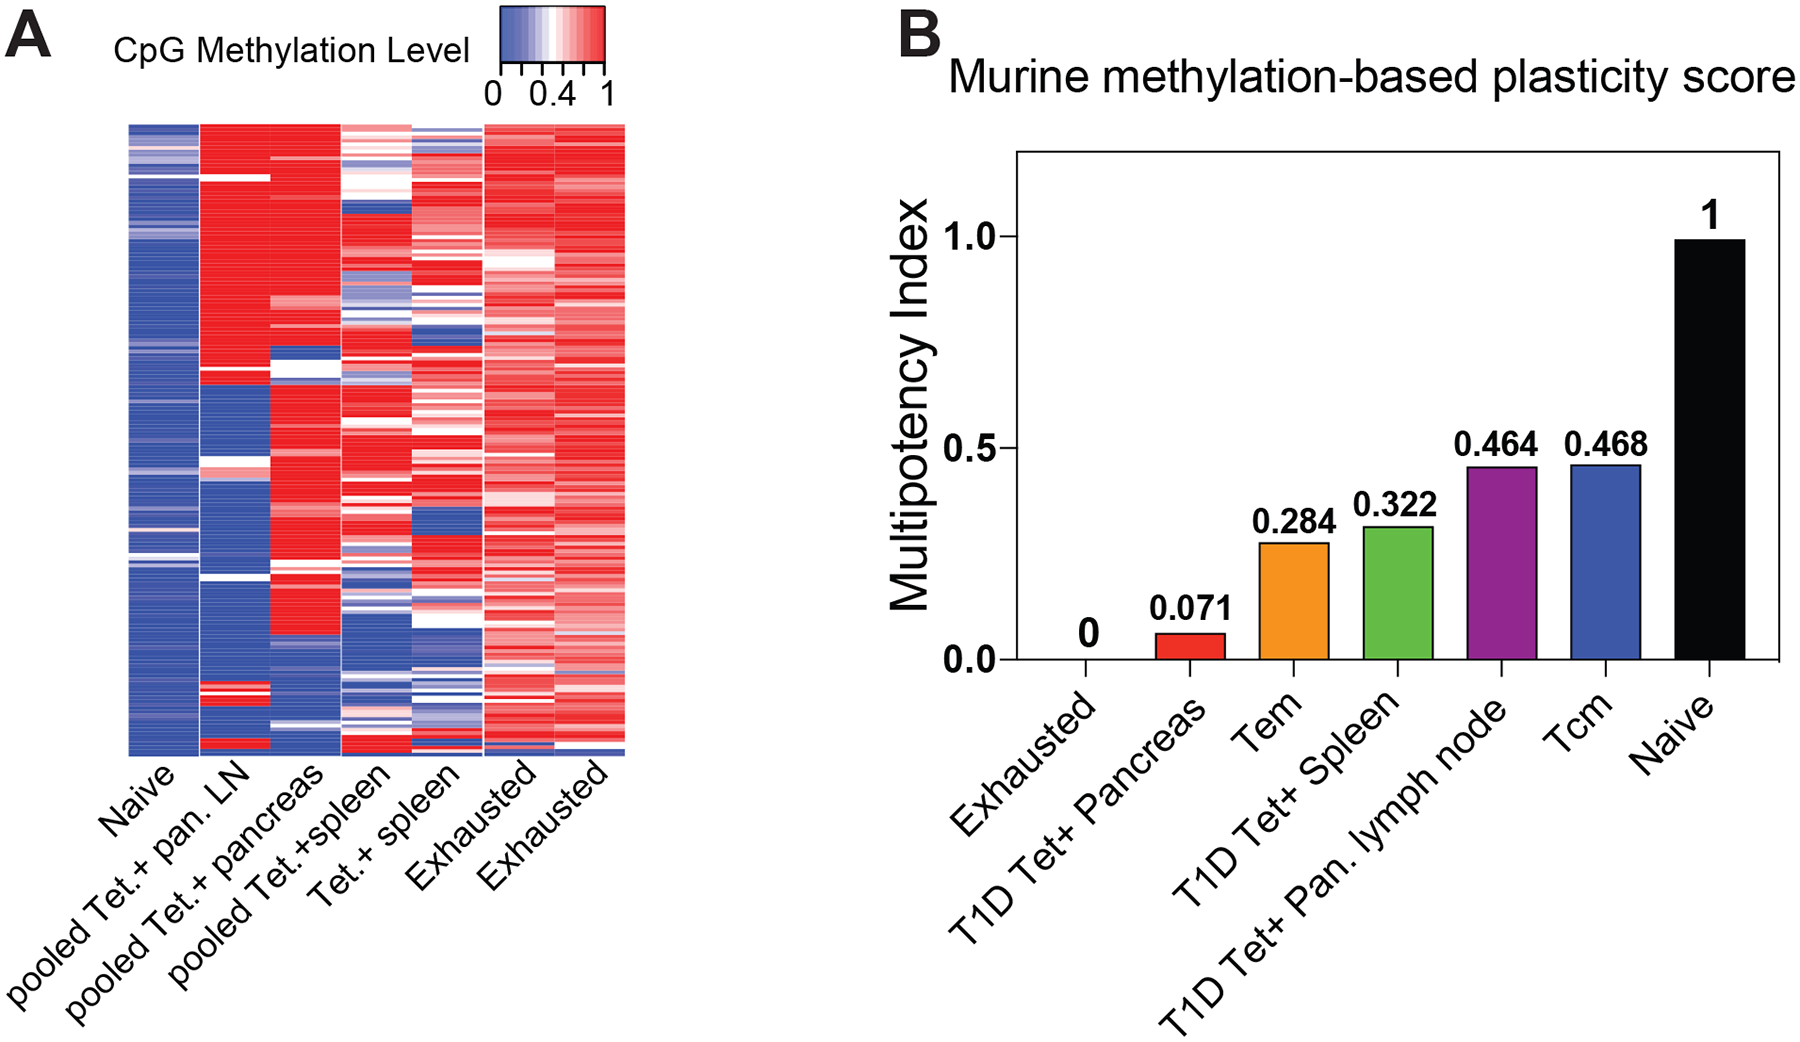
The pool of beta cell-specific CD8+ T cells in type 1 diabetes (T1D) sustains an autoreactive potential despite having access to a constant source of antigen. To investigate the long-lived nature of these cells, we established a DNA methylation-based T cell 'multipotency index' and found that beta cell-specific CD8+ T cells retained a stem-like epigenetic multipotency score. Single-cell assay for transposase-accessible chromatin using sequencing confirmed the coexistence of naive and effector-associated epigenetic programs in individual beta cell-specific CD8+ T cells. Assessment of beta cell-specific CD8+ T cell anatomical distribution and the establishment of stem-associated epigenetic programs revealed that self-reactive CD8+ T cells isolated from murine lymphoid tissue retained developmentally plastic phenotypic and epigenetic profiles relative to the same cells isolated from the pancreas. Collectively, these data provide new insight into the longevity of beta cell-specific CD8+ T cell responses and document the use of this methylation-based multipotency index for investigating human and mouse CD8+ T cell differentiation.


Conflict of interest statement

Competing interests

The authors declare no competing interests

Figures

Figure 1:
Figure 1:. Generation of the human CD8+ T cell DNA methylation landscape for assessment of beta cell -specific CD8+ T cell differentiation
(A) Representative FACS plots showing expression of PD-1 expression among true naive and memory CD8+ T cells subsets from healthy adult subjects (Upper panel) and cell surface expression of CCR7, CD45RO, and PD-1 among HIV-specific CD8+ T cells from HIV-ART patients (Lower Panel). (B) PCA of methylation status of the total CpG sites in CD8+ T cells showing 63.5% of principal component 1 (PC1). Principal component 2 = 4% of variance (not shown). Naive CD8+ T cells from HIV patients (n=3), T1D patient (n=5), and healthy adult donors [HD] (n=4), T1D Tetramer+ (n=5), HD Tscm (n=3), Tcm (n=3), Tem (n=3), and HIV Tetramer+ (n=4). (mean +/− SEM). (C) Venn diagram showing the number of DMRs in T1D-specific CD8+ T cells genomes relative to Tcm, Tem, Tscm, and HIV-specific CD8+ T cell genome. The number of demethylated regions was calculated based on >or= 30%methylation between the two population. The number of methylated regions was calculated based on <or= - 30%methylation between the two population. (D) Normalized plots of CpG methylation at sites surrounding and within DMRs of stemness programs including transcription factors (BATF and TOX), and the de novo DNA methyl transferase enzyme (DNMT3A). Red and blue lines depict methylated and unmethylated CpG sites, respectively.
Figure 2:
Figure 2:. Novel human multipotency index predicts beta cell-specific CD8+ T cells to retain a degree of developmental plasticity comparable to Tscm
(A) Heat map showing the methylation status of 245 CpG sites of HIV-specific, T1D-specific, naive, Tem, Tcm, and Tscm CD8+ T cells used to define the human T cell multipotency index. The CpG sites were identified from a machine learning algorithm using naive and HIV-specific CD8+ T cells as the training data sets. Red and blue intensity depict methylated and unmethylated CpG sites. (B) A normalized human T cell multipotency score (0–1) was generated (see methods) based on the newly identified CpG sites that delineate the developmental potential of human T cells. Weight assignment for the methylation status at the 245 CpG sites is provided in supplemental table 1. The normalized multipotency index was applied to T1D-specific, Tem, Tcm, and Tscm CD8+ T cell methylomes.
Figure 3:
Figure 3:. Self-reactive human CD8+ T cells acquire effector-associated epigenetic programs
Normalized plots of CpG methylation at sites surrounding and within DMRs of effector molecules (PRF1, GZMK, and IFNg) and transcription factors (Eomes, TBX21 and Tcf7) obtained from WGBS analysis. Red and blue lines depict methylated and unmethylated CpG sites, respectively.
Figure 4:
Figure 4:. Single cell ATACseq profiling identifies naive and effector epigenetic programming within individual beta cell-specific CD8+ T cells
(A) t-SNE analysis of individual cell chromatin accessibility profiles for all (aggregated) Tetramer+ CD8+ T cells and representative naive and Tem populations from three donors. For all cells, heatmap for the chromatin accessibility profile of CCR7 (B), LEF1 and DNMT3a (C) TOX and TBX21 (D), IFNG, PRF1, and GZMK (E). (F) Composite (N = 3) ATACseq profiles showing accessibility peaks across the loci of LEF1, TCF7, DNMT3a, TBX21, IFNg, and PRF1 loci for naive, Tem, and beta cell-specific CD8+ T cells (Tetramer +).
Figure 5:
Figure 5:. Stemness-associated DNA methylation programs are maintained during in vitro antigen-driven proliferation of human T1D-specific CD8+ T cells
(A) Experimental setup for in vitro stimulation of total PBMCs from T1D patients. PBMCs were labeled with cell proliferation dye (cell trace violet-CTV) and subsequently maintained in culture in the presence of mixture of peptides specific for T1D-specific CD8+ T cells for 14–24days. Phenotypic analyses of beta cell- specific CD8+ T cells prior to and after 14–24 days of peptide stimulation. Antigen-driven expansion of beta-cell specific CD8+ T cells results in down regulation of CCR7 and upregulation of CD95. (B) Representative bisulfite sequencing analysis and bar graph showing % CpG methylation for individual CpG sites of stemness programs DNMT3A (CpG sites 12–18 shown) and TOX (CpG sites 4–10 shown) from beta cell-specific CD8+ T cells post peptide stimulation relative to the methylation status of bona fide effector memory CD8+ T cells N = 2.
Figure 6:
Figure 6:. Lymphoid-homing murine beta cell-specific CD8+ T cells retain phenotypic and epigenetic programs indicating developmental plasticity
(A) Representative FACS plots showing the phenotype of tetramer positive beta cell-specific CD8+ T cells isolated from murine spleen, pancreatic lymph node, and pancreas. Phenotypic characterization includes cell surface expression of CD44, PD-1, CD127, and CD62L. N = 3. (B) Summary graph from three different mice of tetramer positive beta cell-specific CD8+ T cells isolated from spleen, pancreatic lymph node, and pancreas (n=3). (C) Normalized plots of CpG methylation at sites surrounding and within DMRs of effector molecules (Ifng, Gzmk) and transcription factors (Tcf7, Batf, Eomes, and TBX21) obtained from WGBS analysis. Red and blue lines depict methylated and unmethylated CpG sites, respectively.
Figure 7:
Figure 7:. Novel murine multipotency index predicts terminal differentiation of beta cell-specific CD8+ T cells isolated from the pancreas
(A) Heat map showing the methylation status of 177 CpG sites of exhausted, lymphatic-derived, pancreas-derived, and naive CD8+ T cells used to define the murine T cell multipotency index. The CpG sites were identified from a machine learning algorithm using naive and LCMV-specific exhausted CD8+ T cells as the training data sets. Red and blue intensity depict methylated and unmethylated CpG sites. (B) A murine T cell multipotency score was generated as described in methods based on newly identified CpG sites that delineate the developmental potential of murine T cells. The multipotency score was derived from a machine learning algorithm using naive and LCMV-specific exhausted CD8+ T cell methylomes as the training datasets. LCMV-specific CD8+ T cell methylomes were used as test datasets for the multipotency index. The multipotency score was based on weight assignment for methylation status at 177 CpG sites.

Comment in

  • The persistence of stemness.
    Petiti L, Pace L. Petiti L, et al. Nat Immunol. 2020 May;21(5):492-494. doi: 10.1038/s41590-020-0644-2. Nat Immunol. 2020. PMID: 32231299 No abstract available.

References

    1. Sun D et al. Myelin antigen-specific CD8+ T cells are encephalitogenic and produce severe disease in C57BL/6 mice. J Immunol 166, 7579–7587 (2001). - PubMed
    1. Huseby ES et al. A pathogenic role for myelin-specific CD8(+) T cells in a model for multiple sclerosis. J Exp Med 194, 669–676 (2001). - PMC - PubMed
    1. Vizler C, Bercovici N, Cornet A, Cambouris C & Liblau RS Role of autoreactive CD8+ T cells in organ-specific autoimmune diseases: insight from transgenic mouse models. Immunol Rev 169, 81–92 (1999). - PubMed
    1. Coppieters KT et al. Demonstration of islet-autoreactive CD8 T cells in insulitic lesions from recent onset and long-term type 1 diabetes patients. J Exp Med 209, 51–60 (2012). - PMC - PubMed
    1. Willcox A, Richardson SJ, Bone AJ, Foulis AK & Morgan NG Analysis of islet inflammation in human type 1 diabetes. Clin Exp Immunol 155, 173–181 (2009). - PMC - PubMed

Publication types