. 2020 Jun;21(6):684-694.
doi: 10.1038/s41590-020-0643-3. Epub 2020 Mar 30.

Sestrins induce natural killer function in senescent-like CD8+ T cells

Affiliations

Sestrins induce natural killer function in senescent-like CD8+ T cells

Branca I Pereira et al. Nat Immunol. 2020 Jun.

Abstract

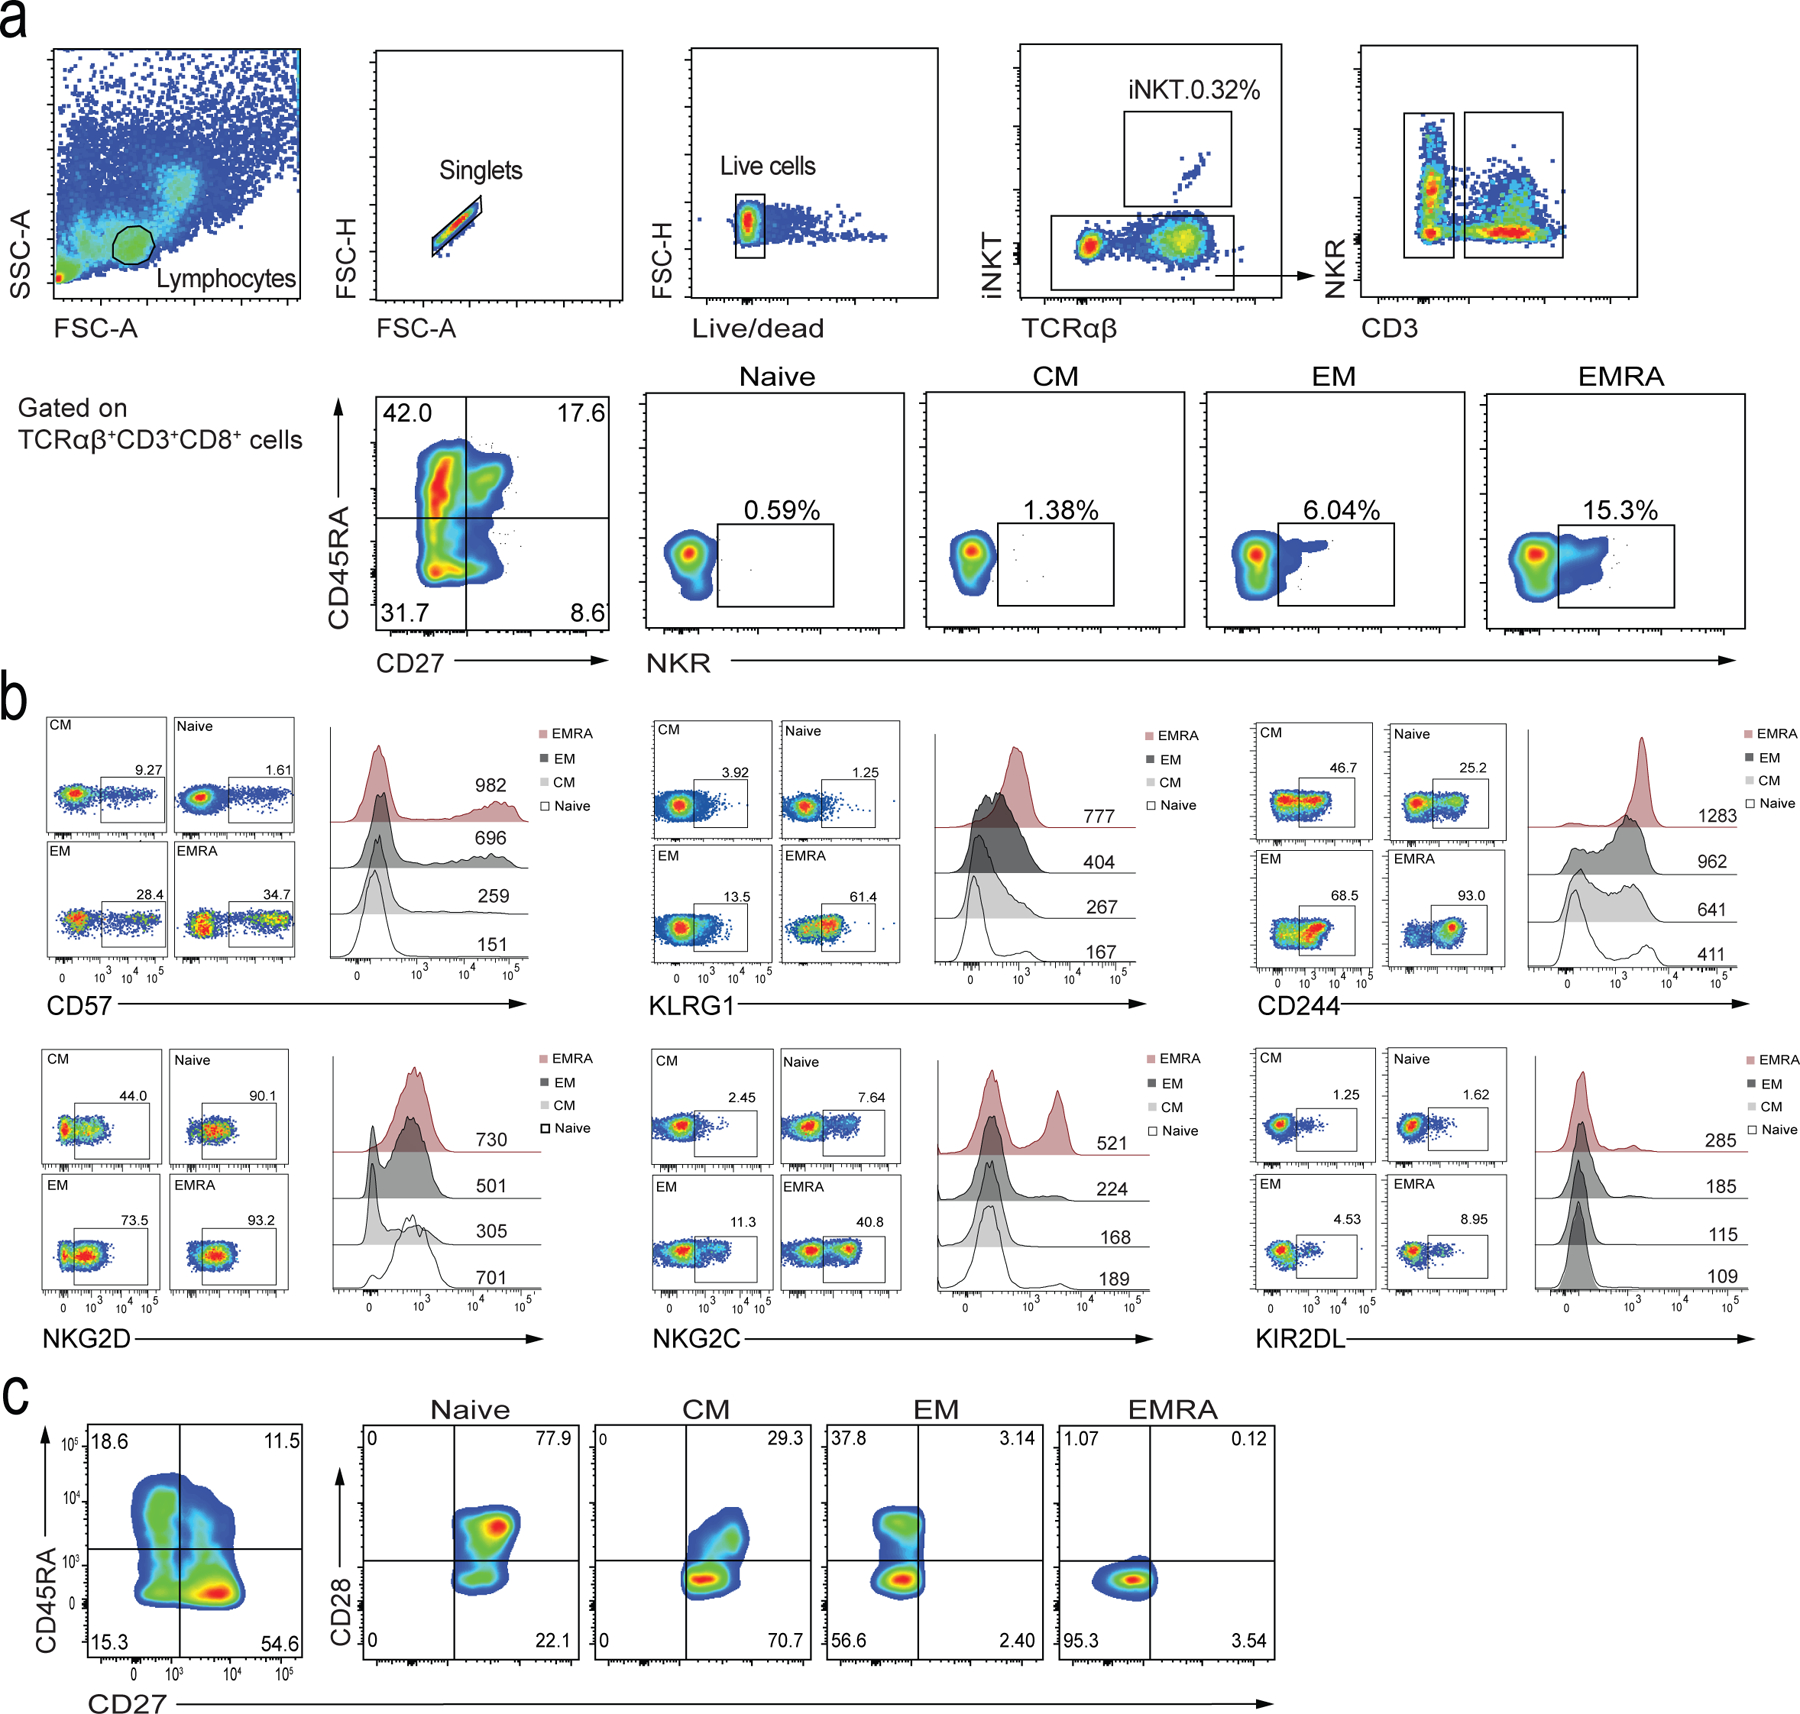
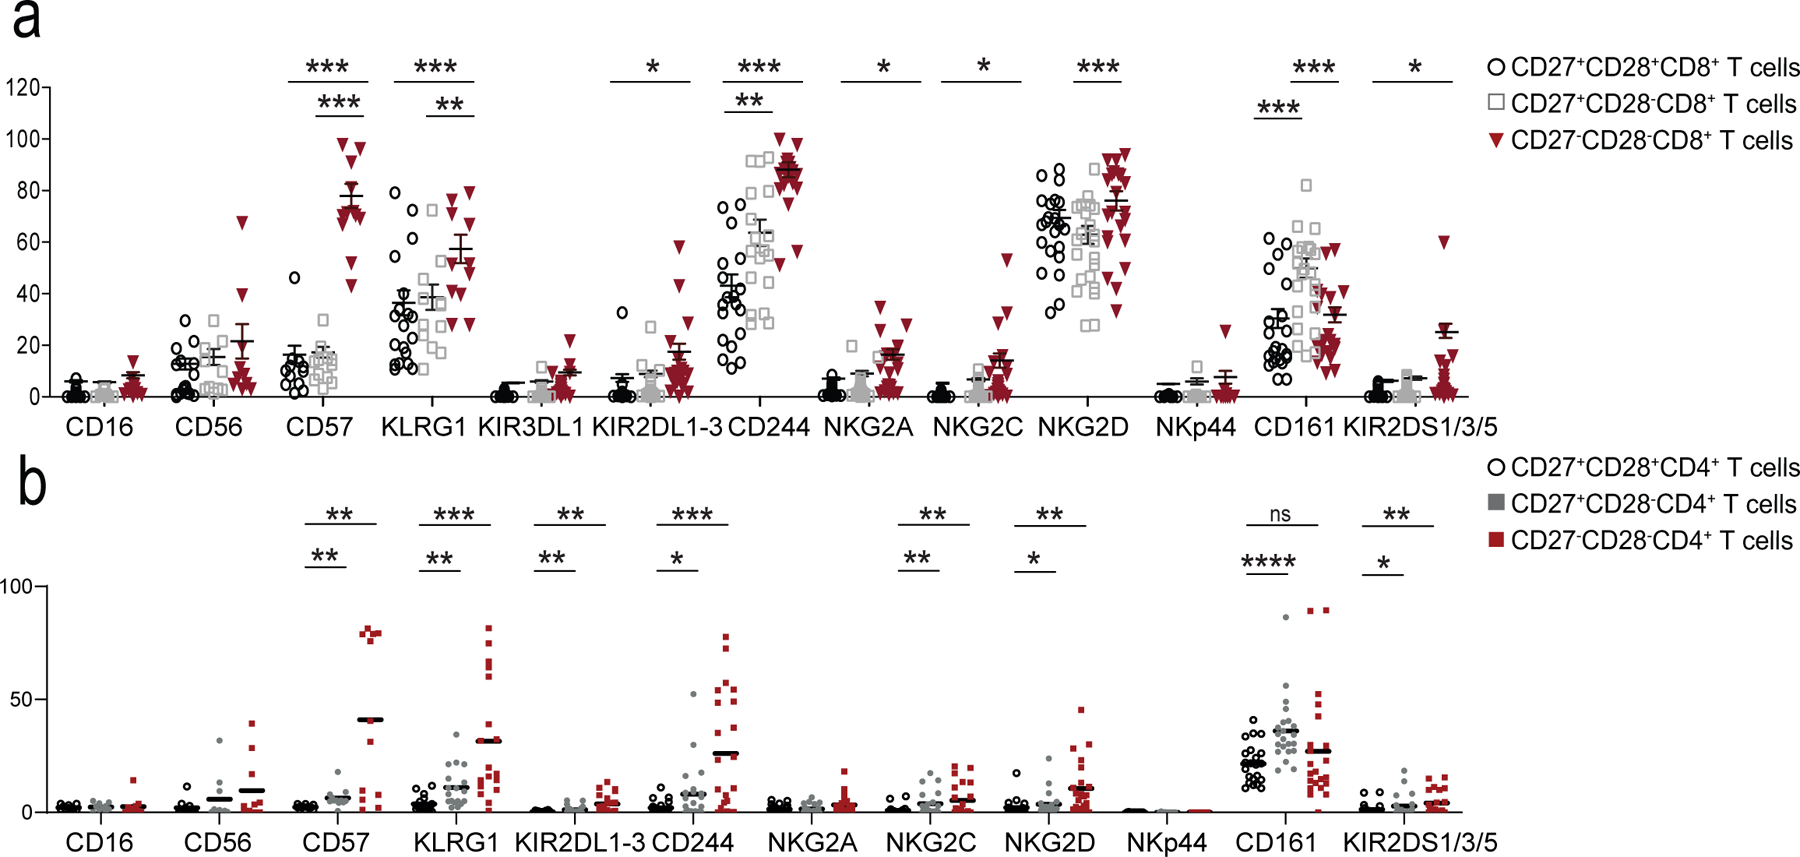
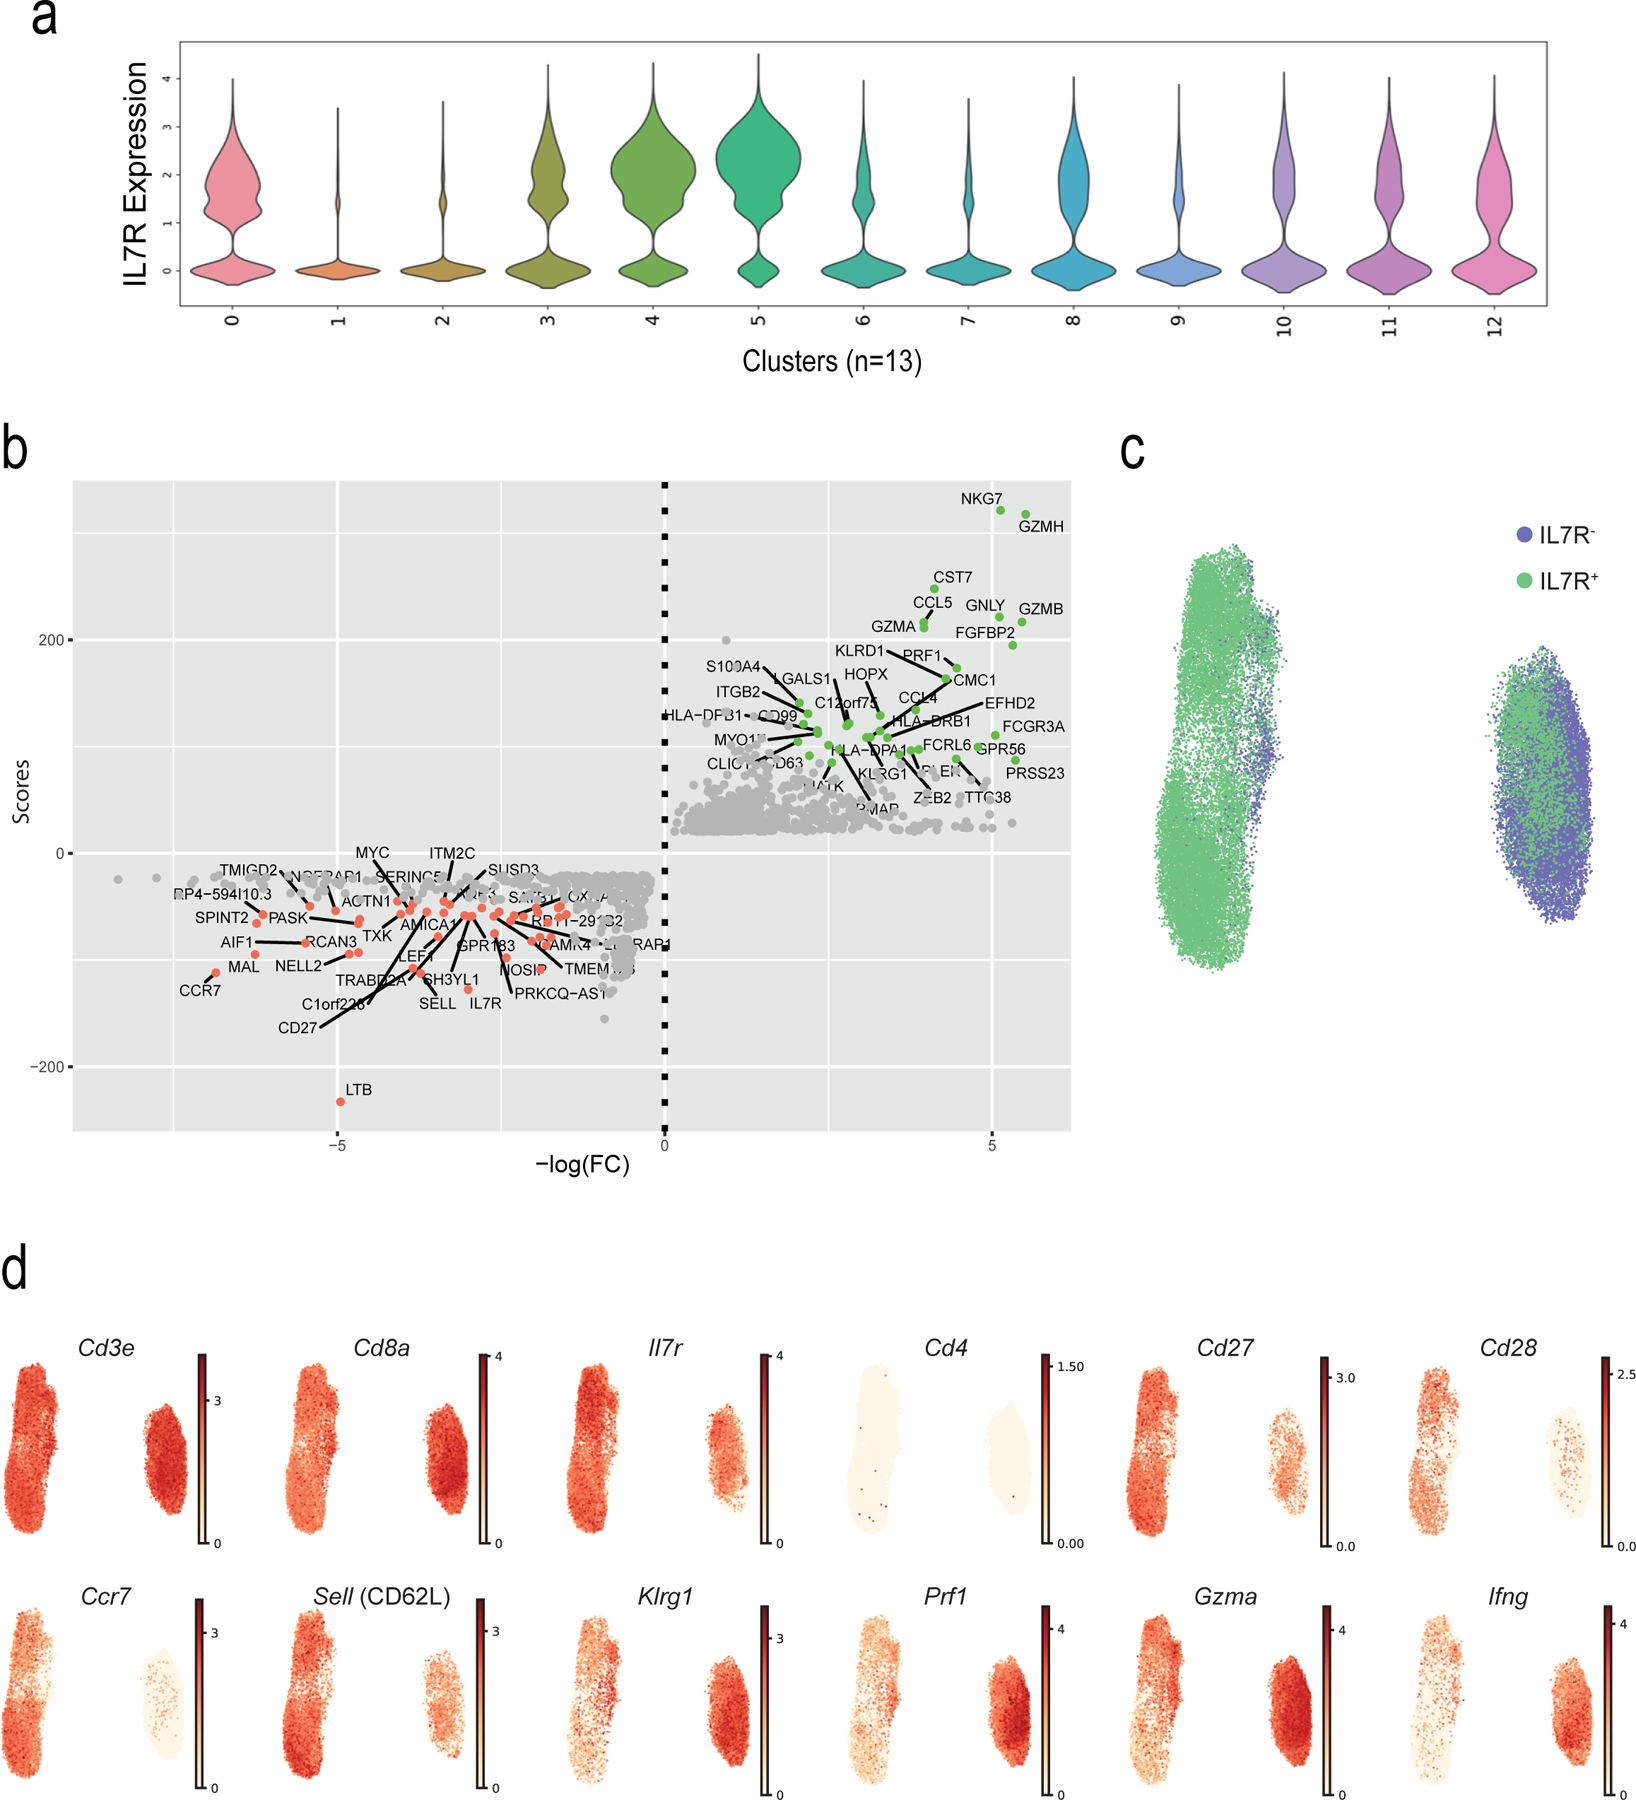
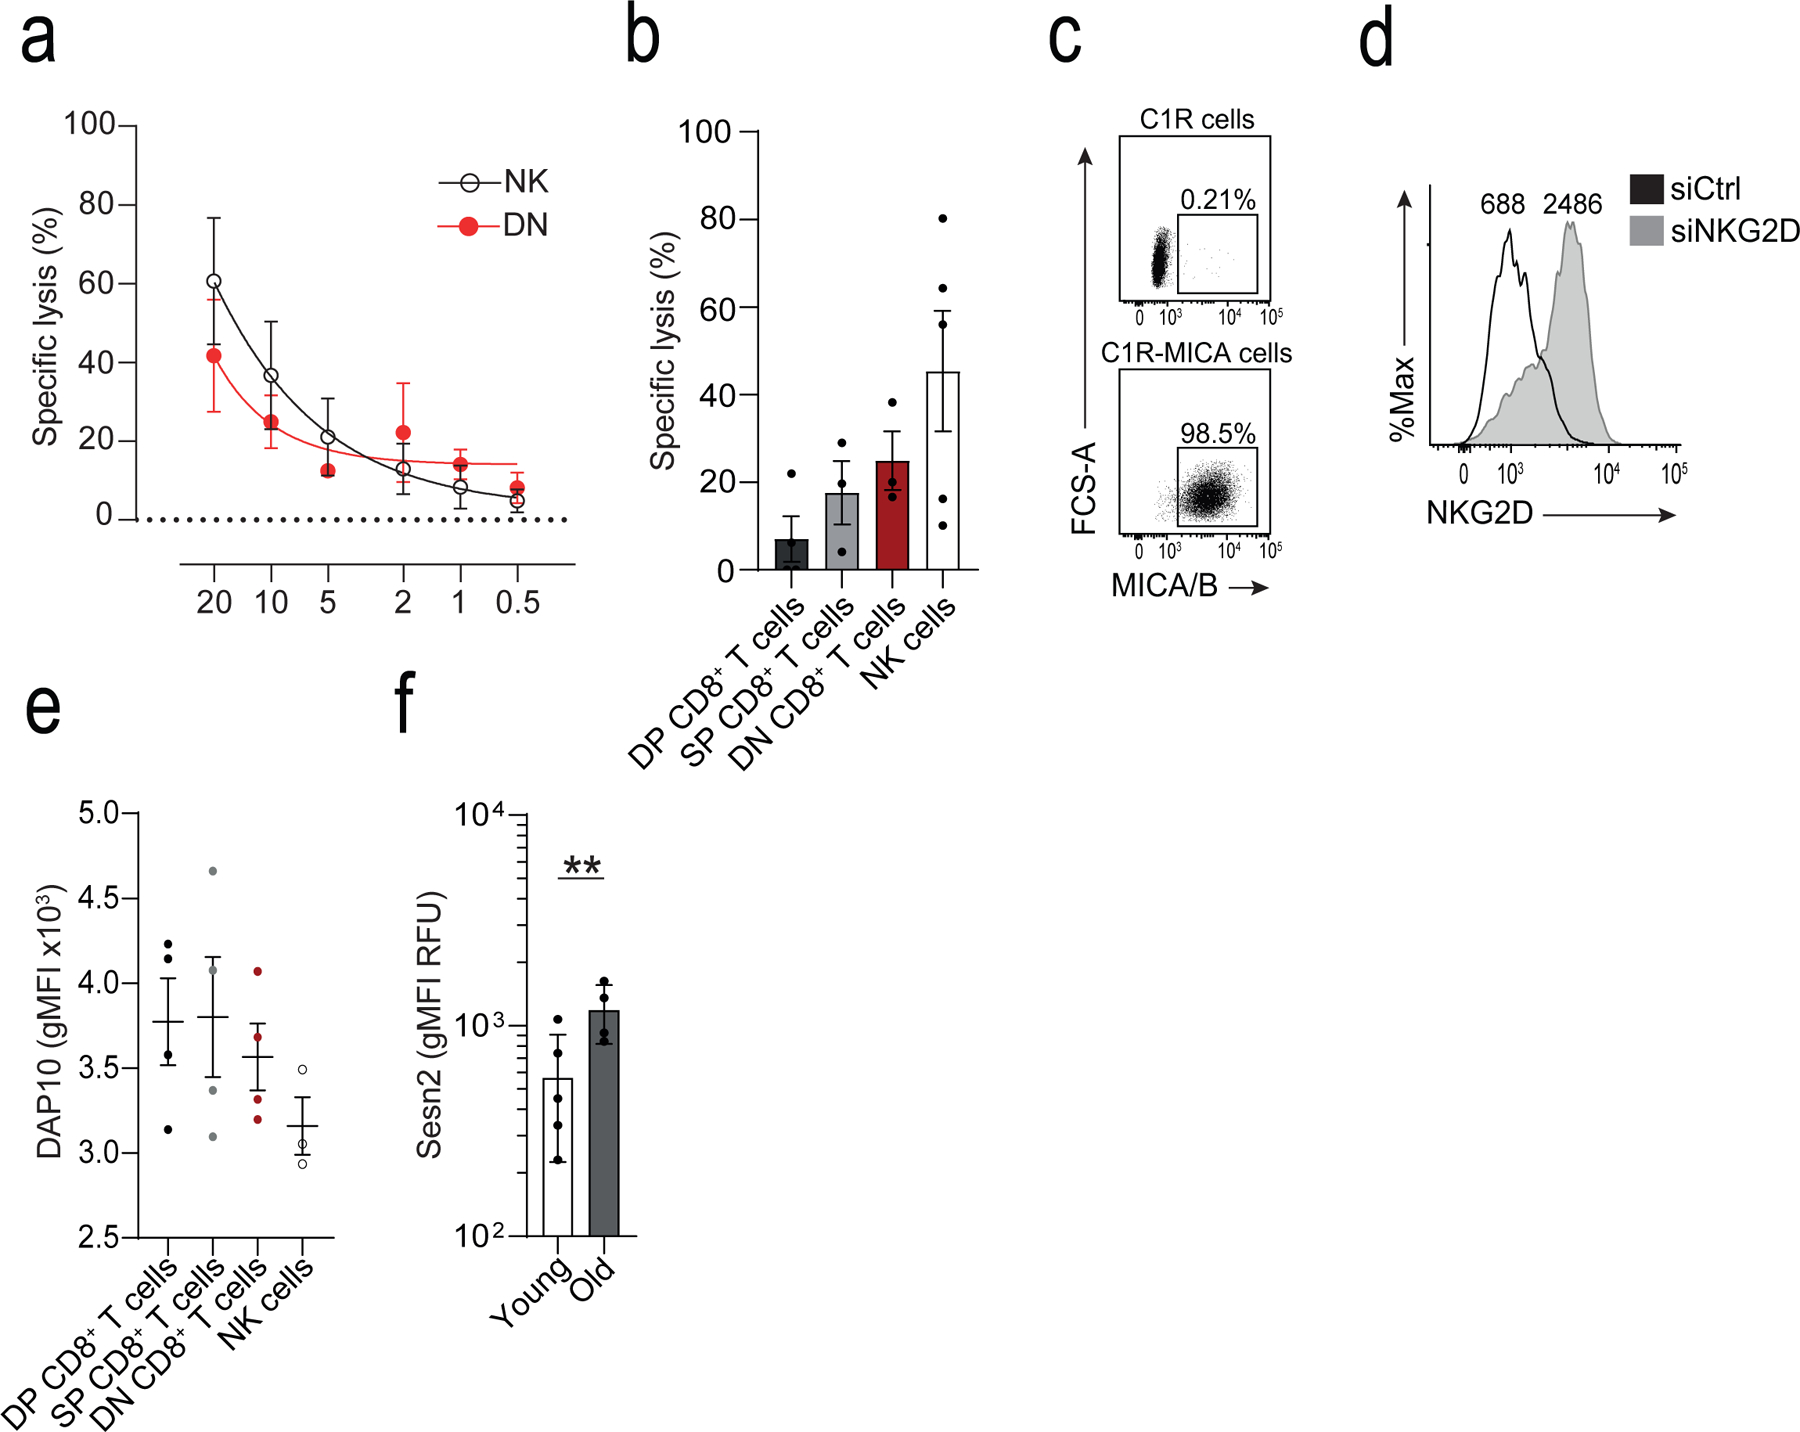
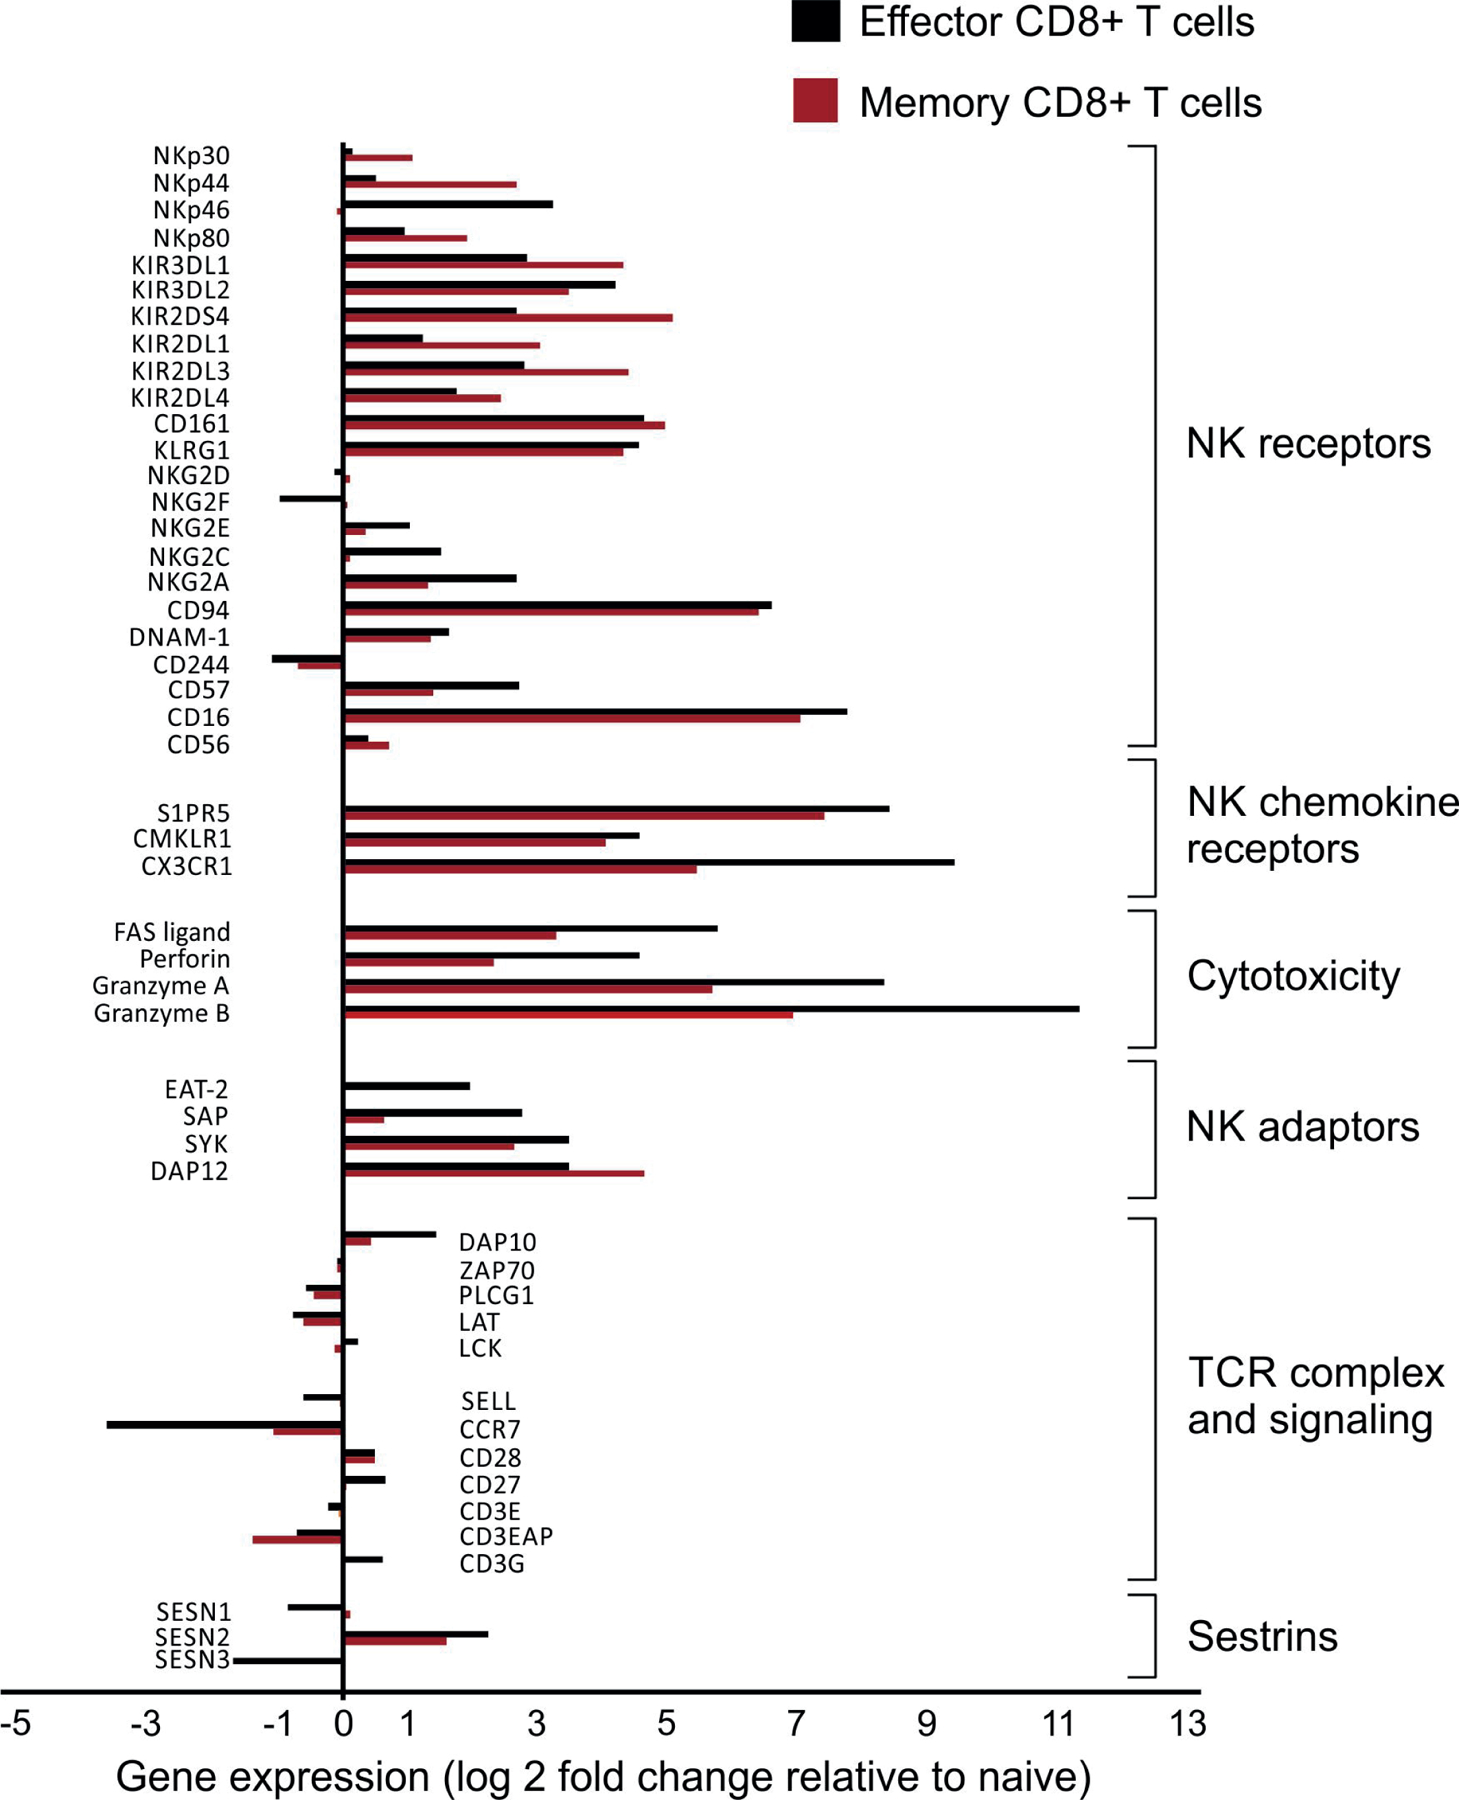
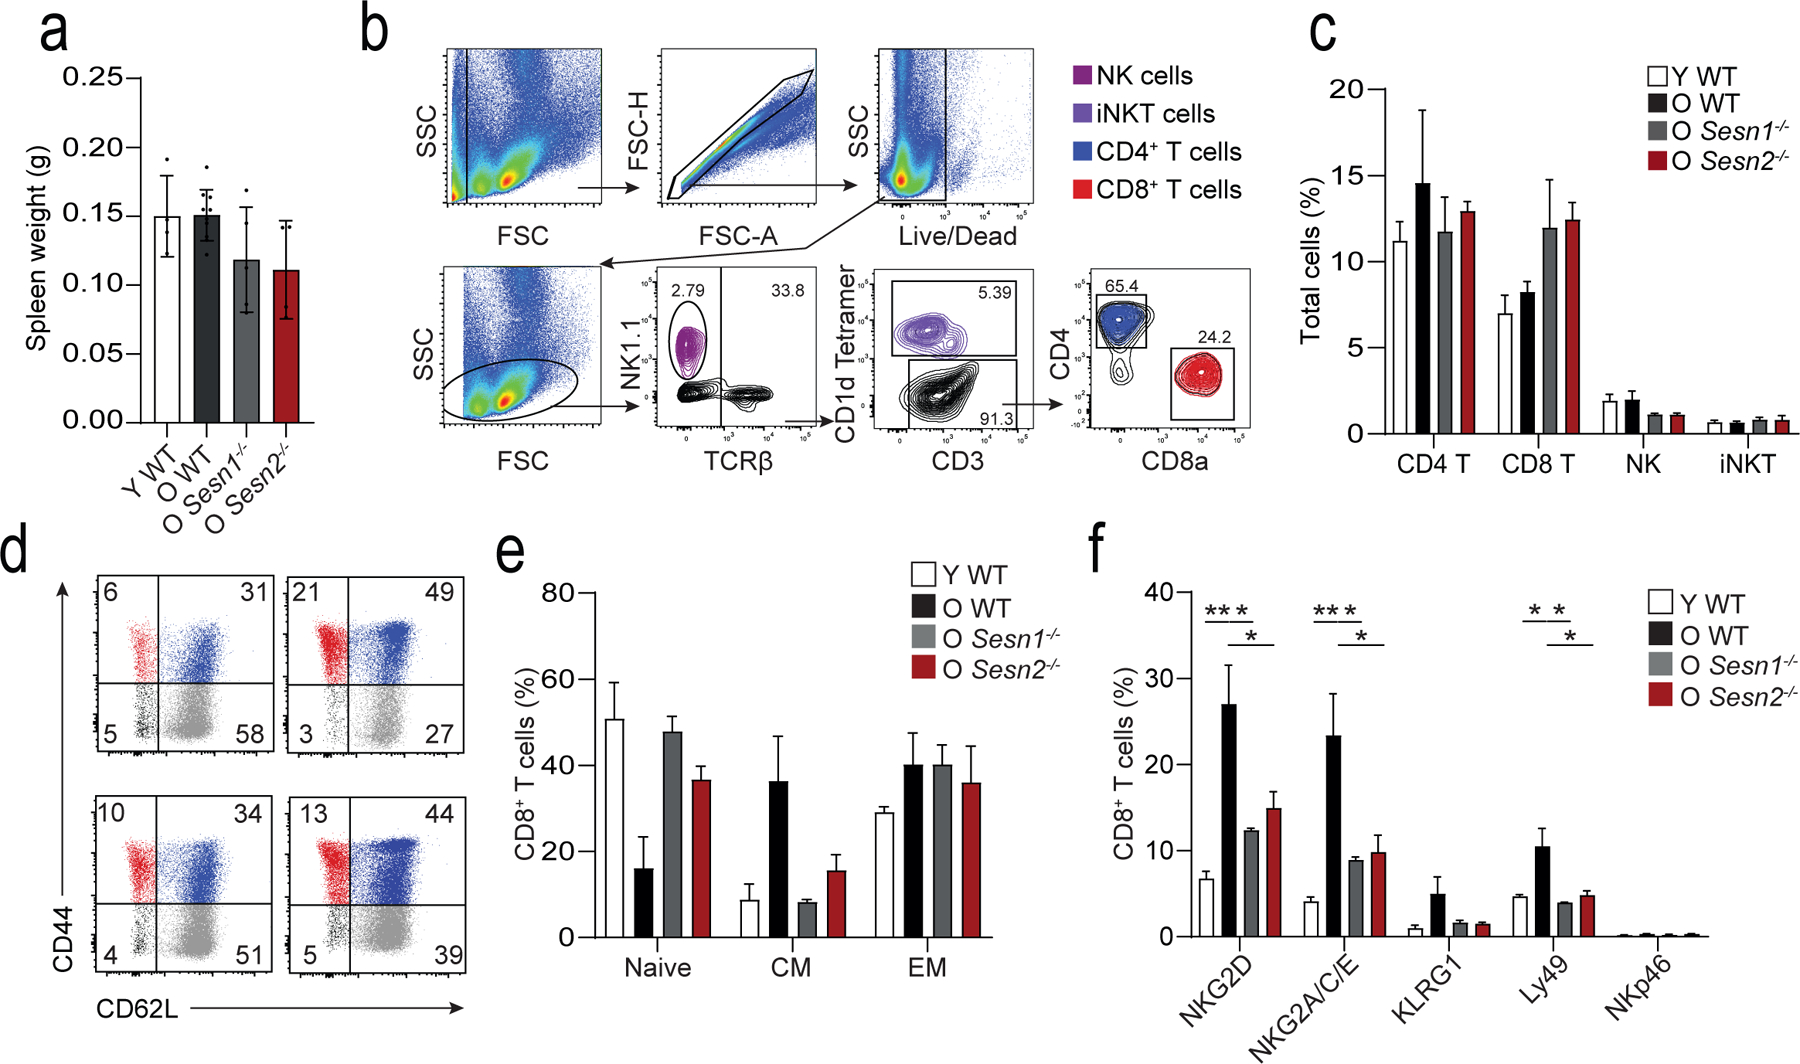
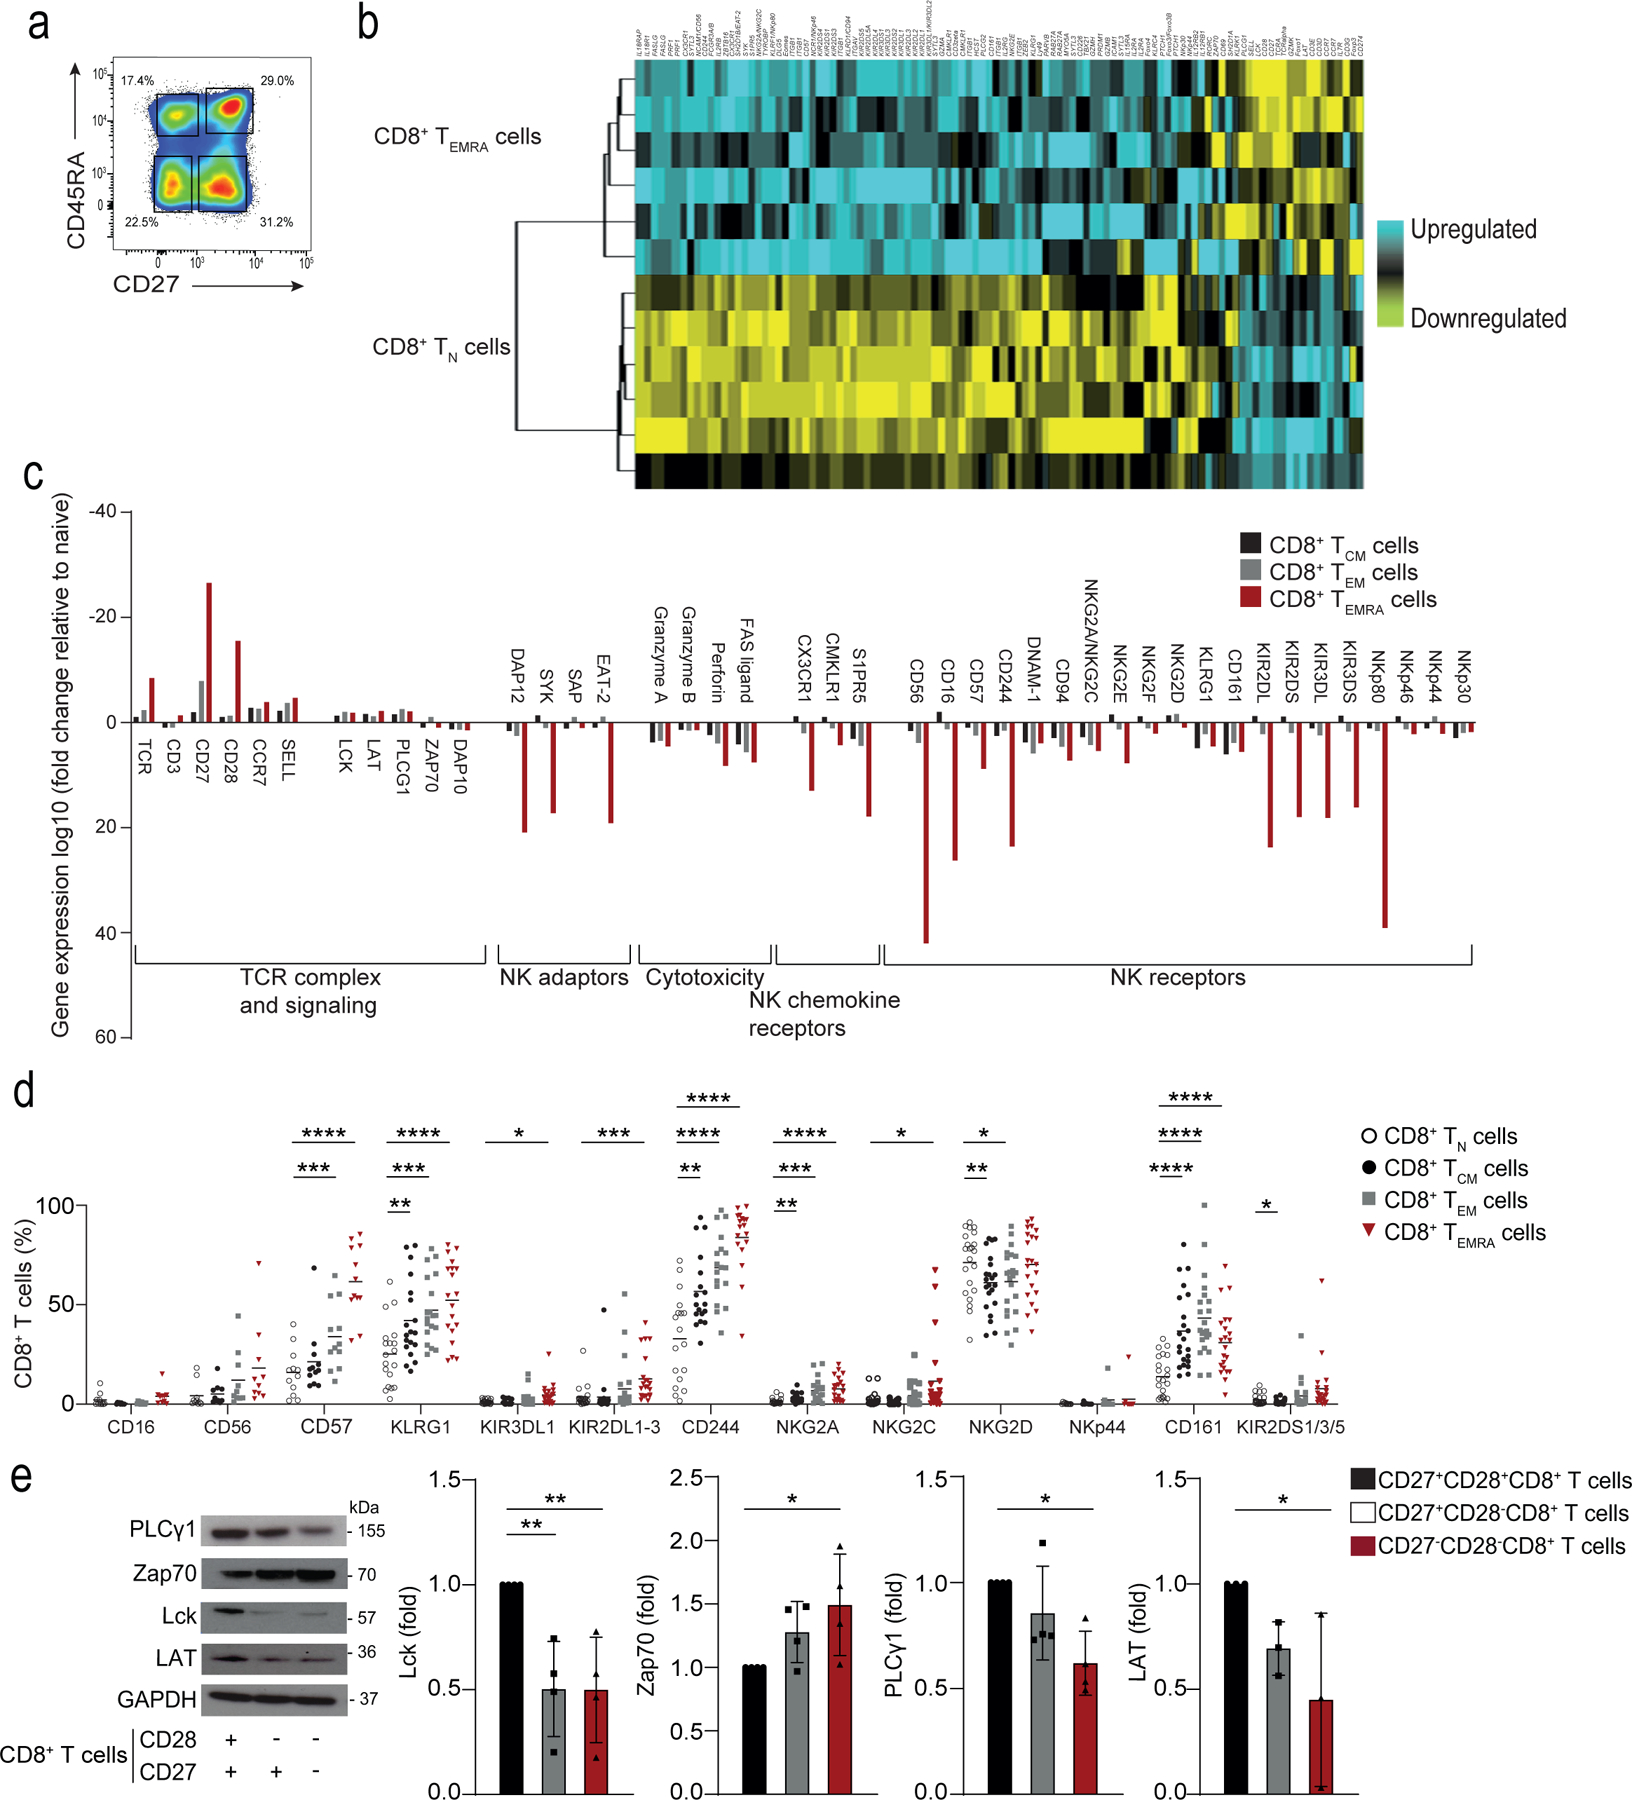
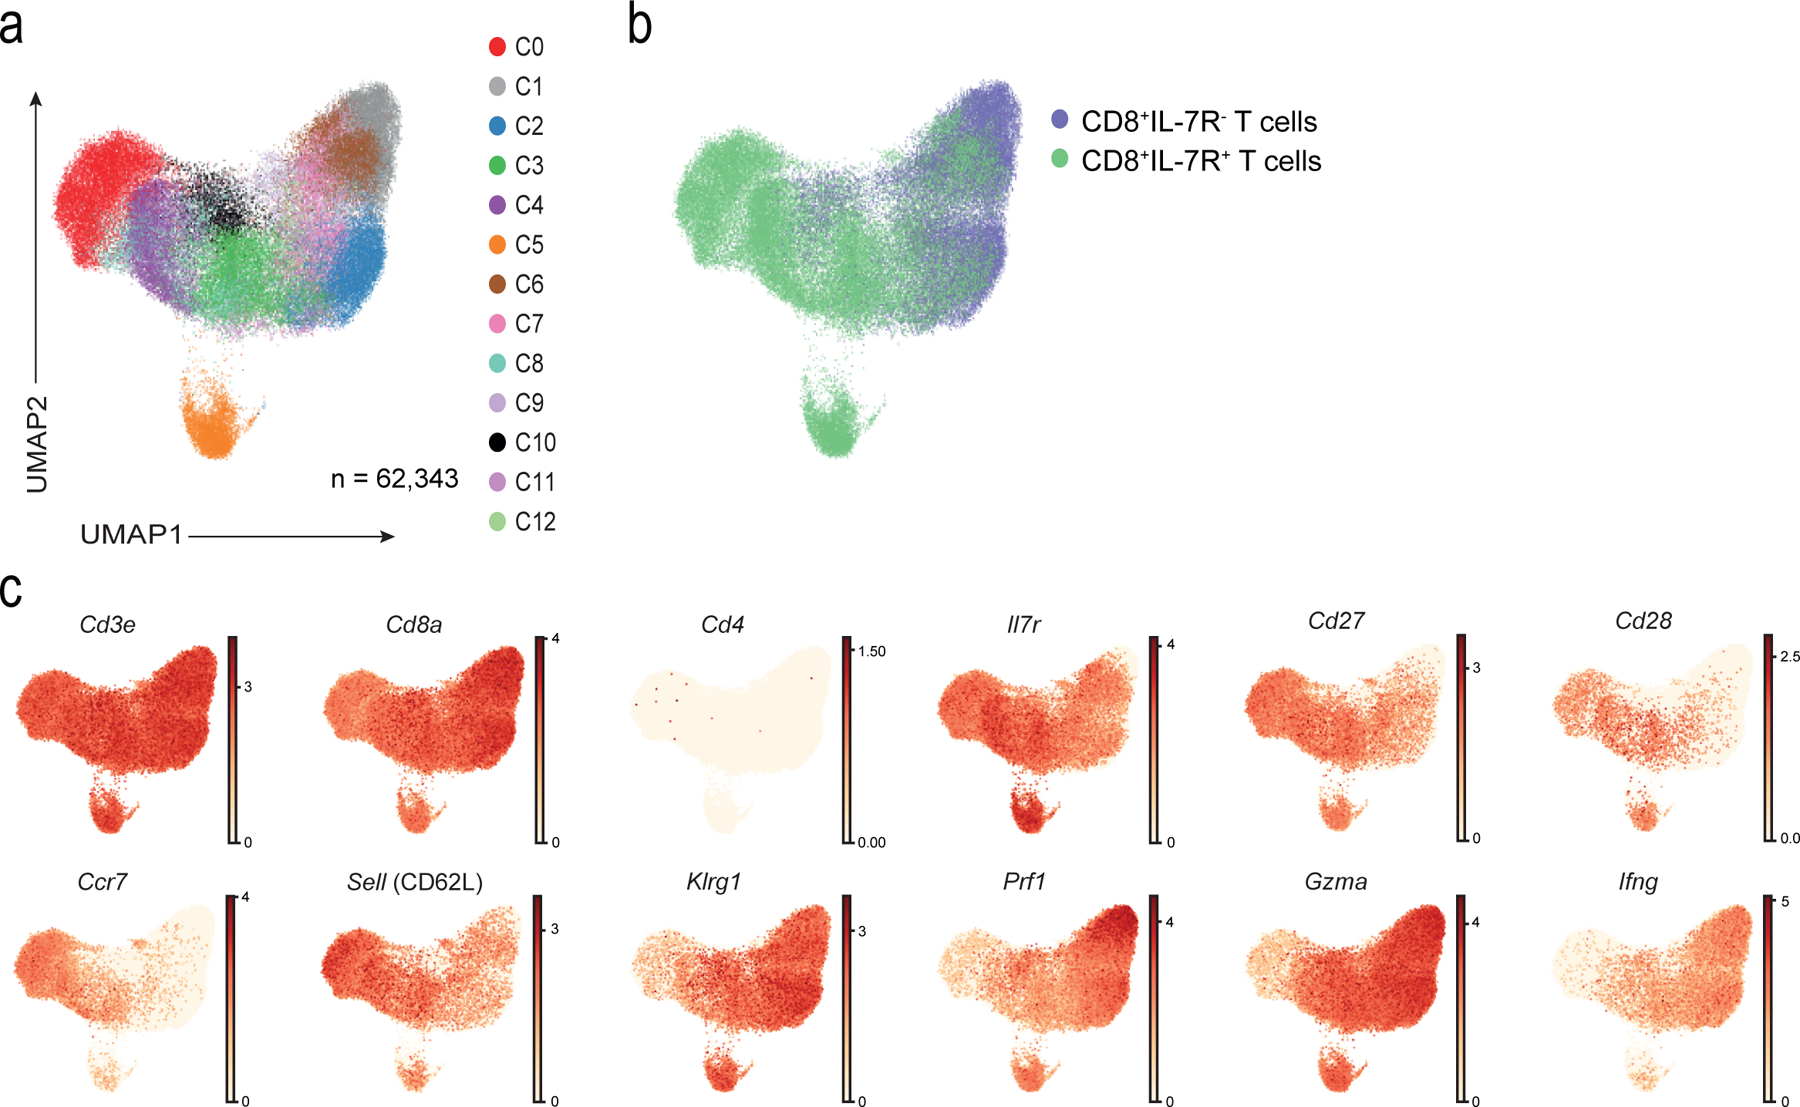
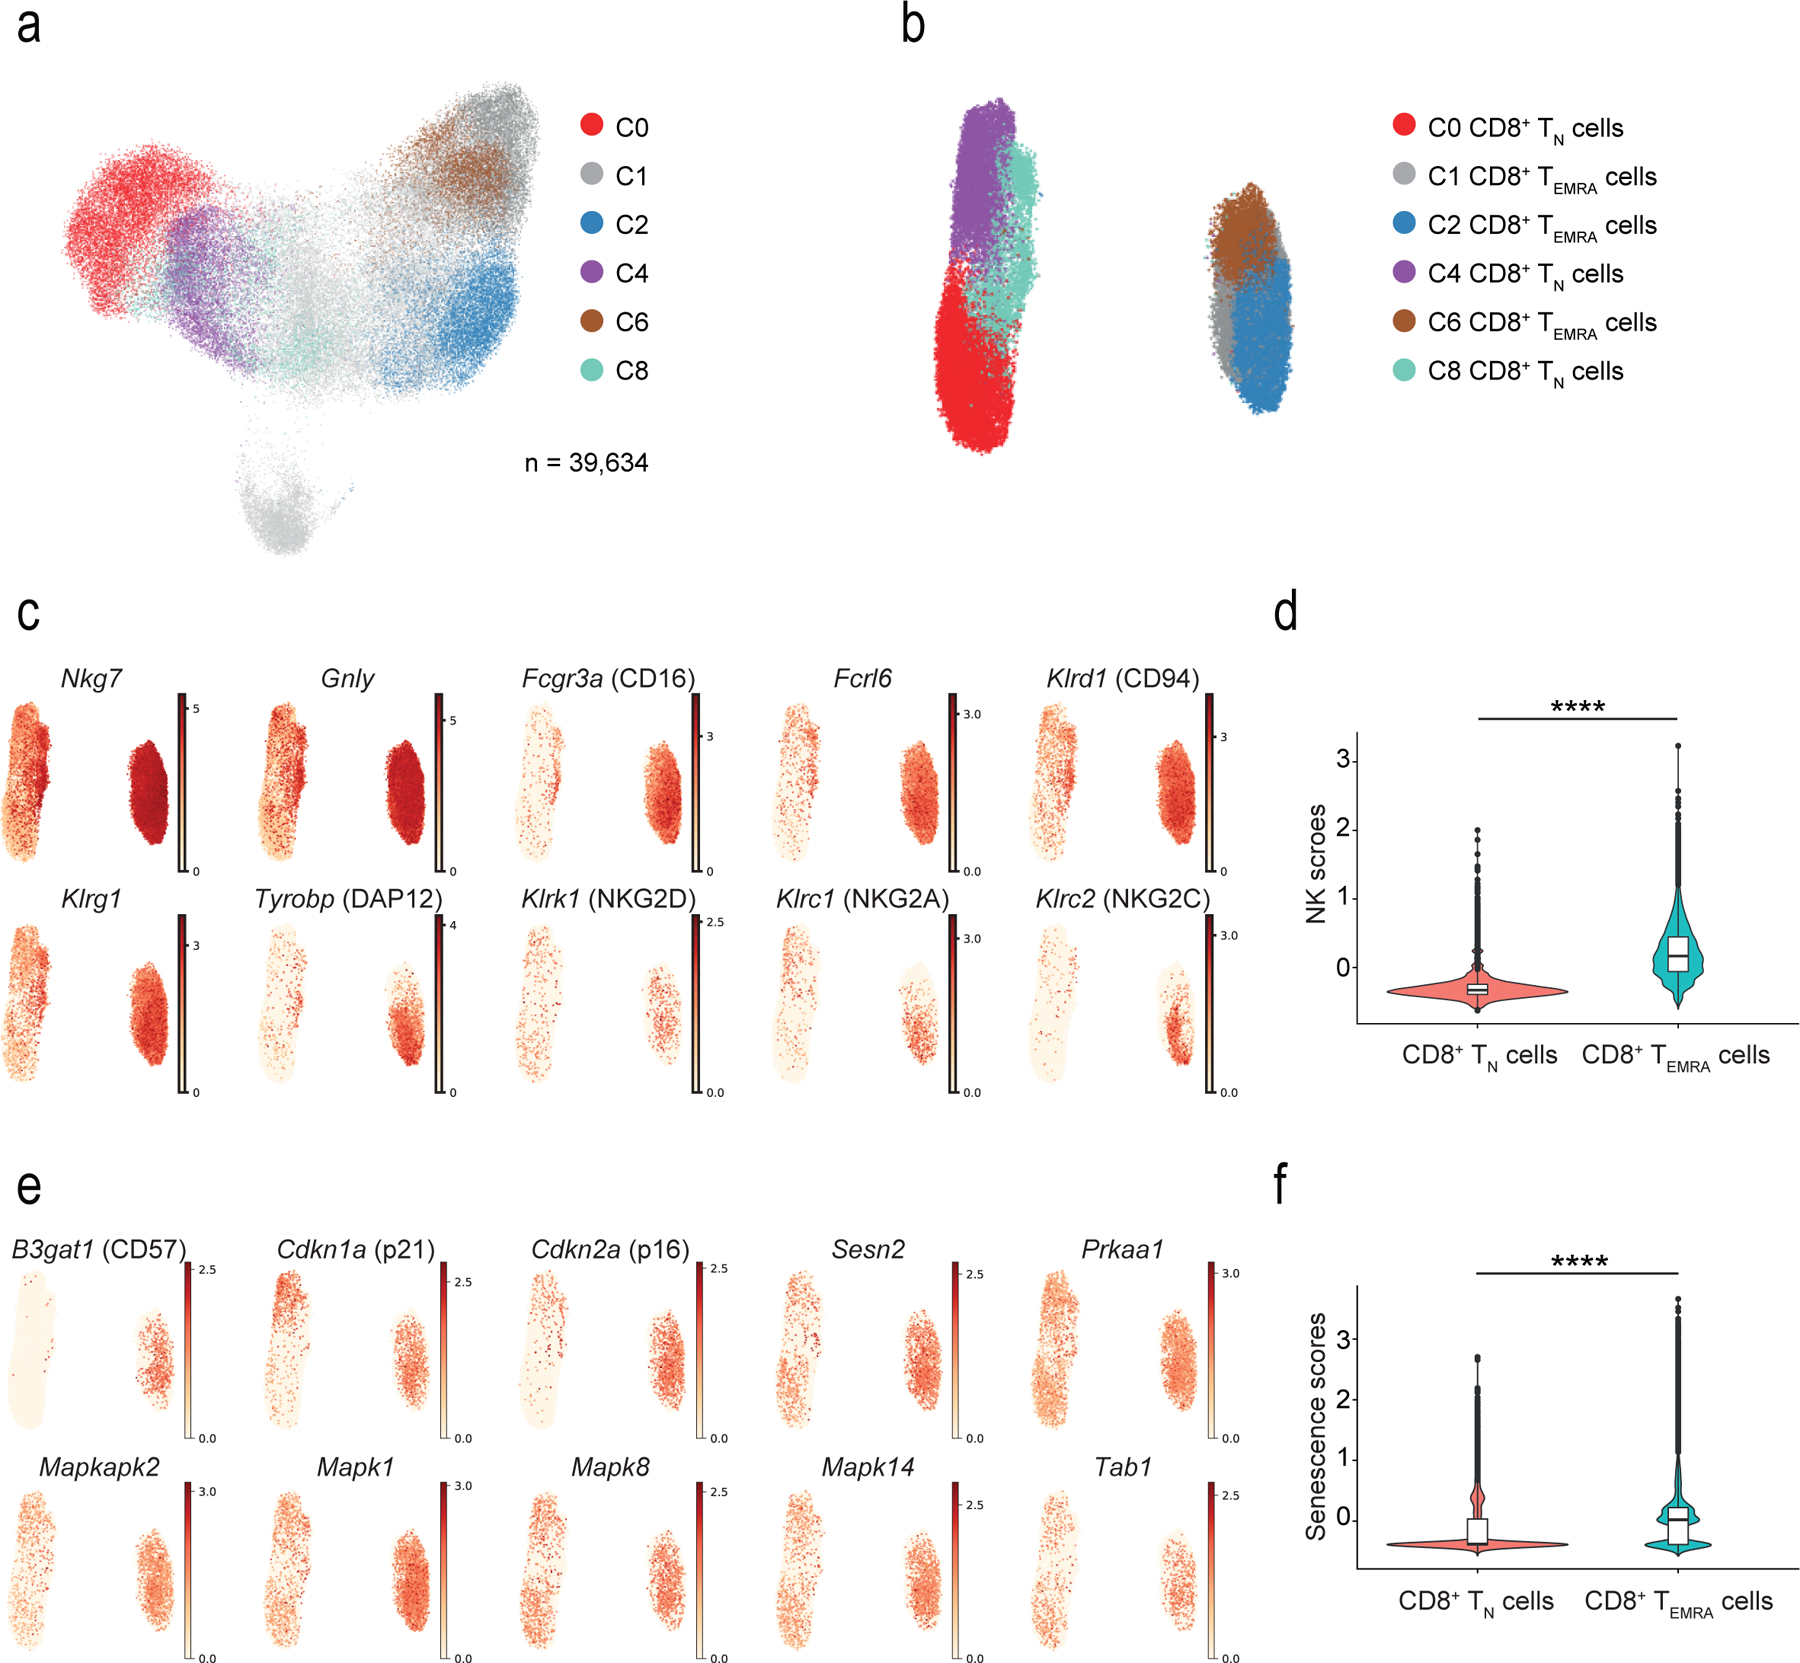
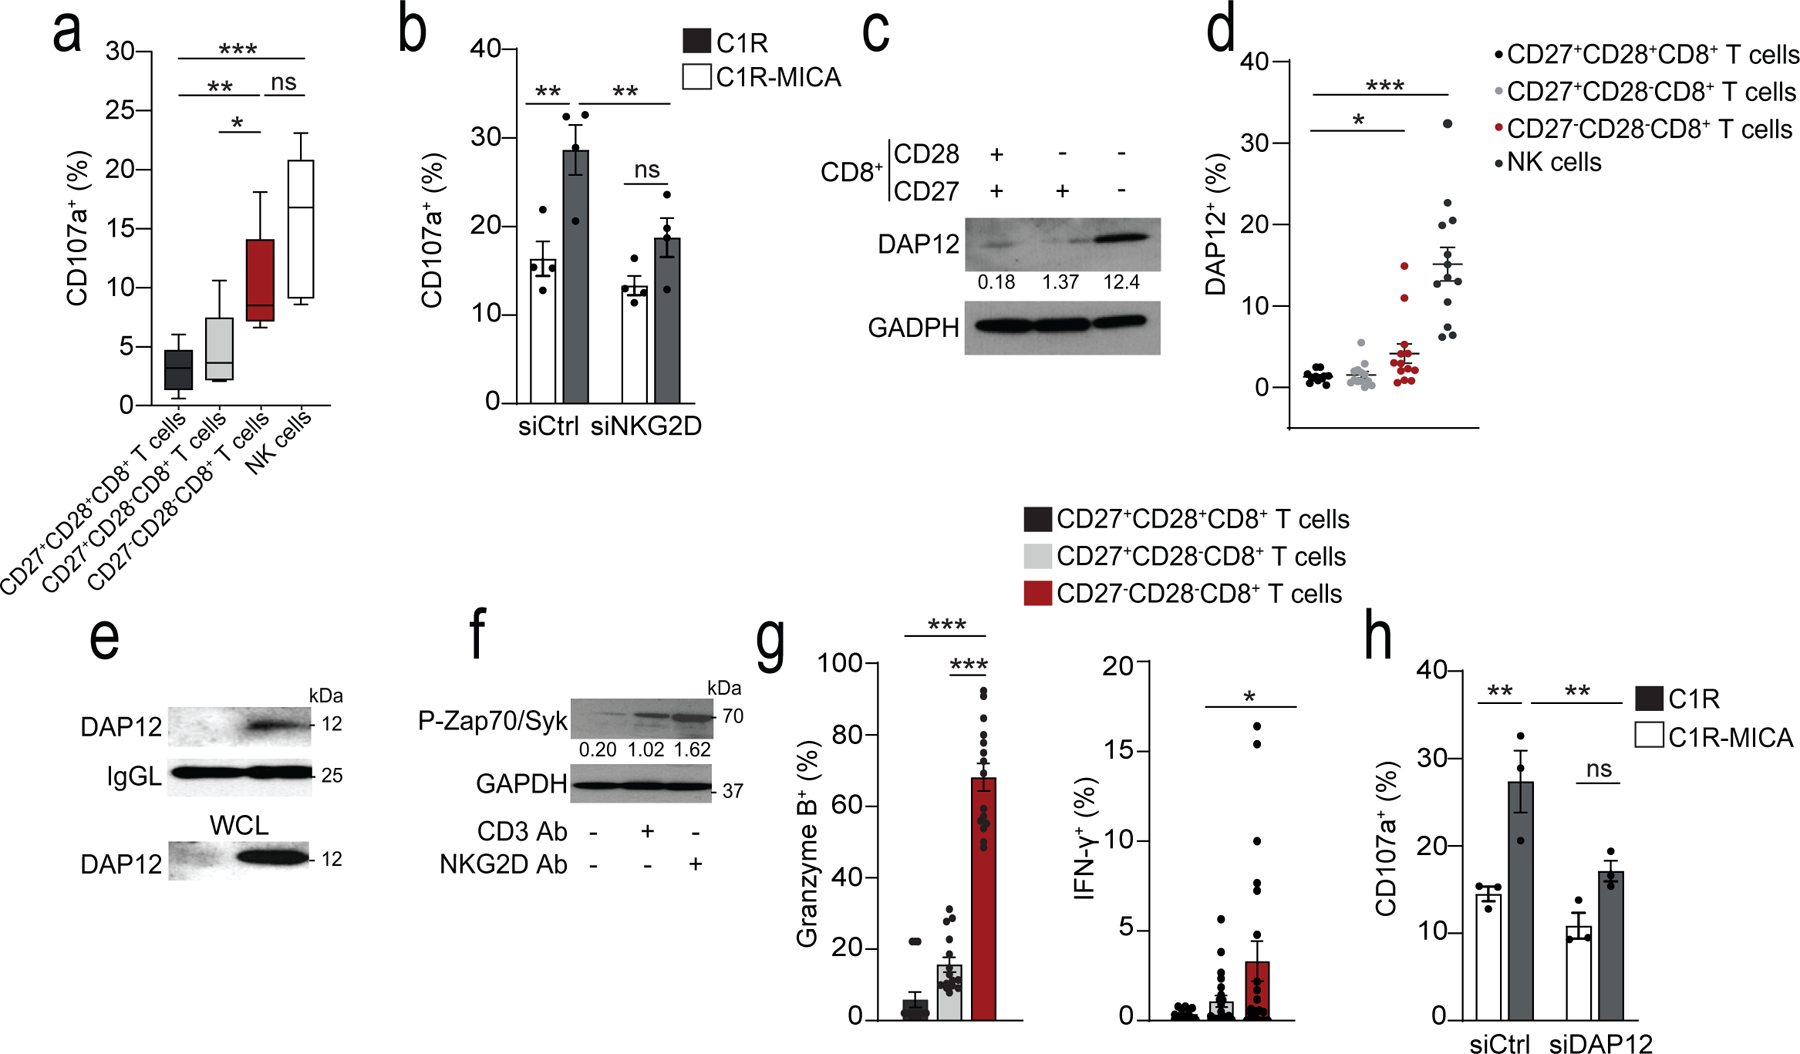
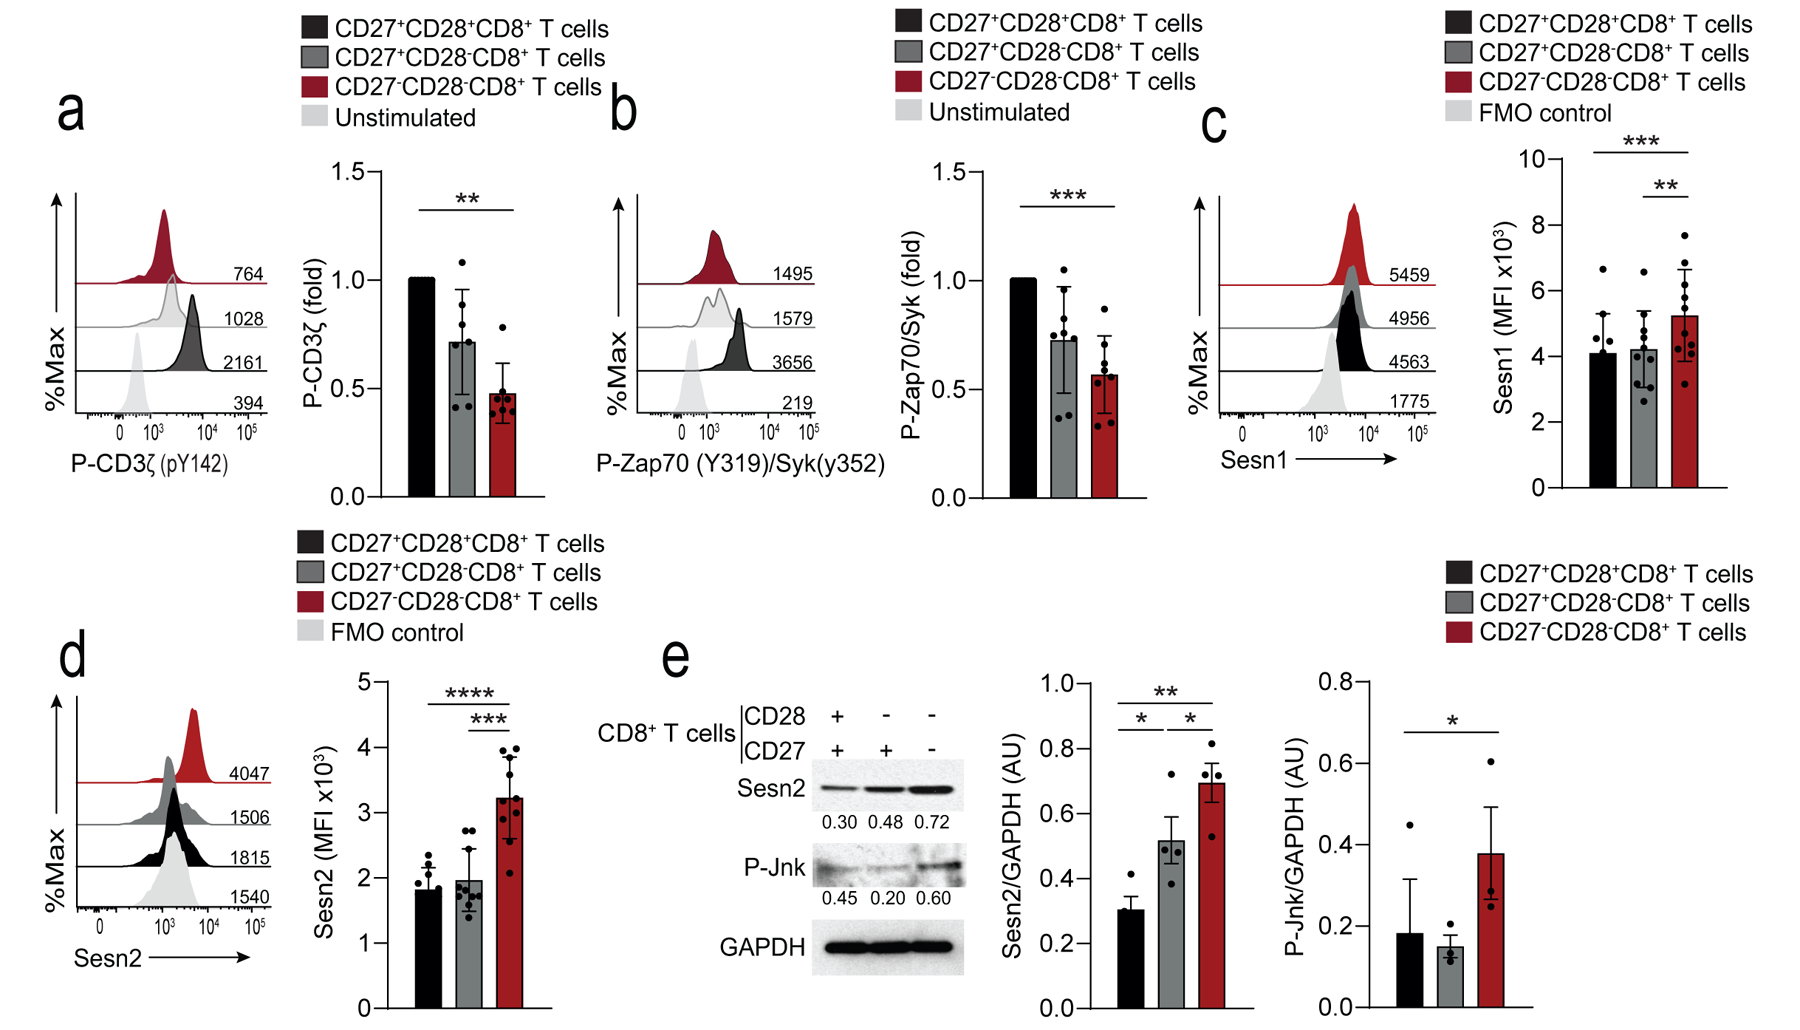
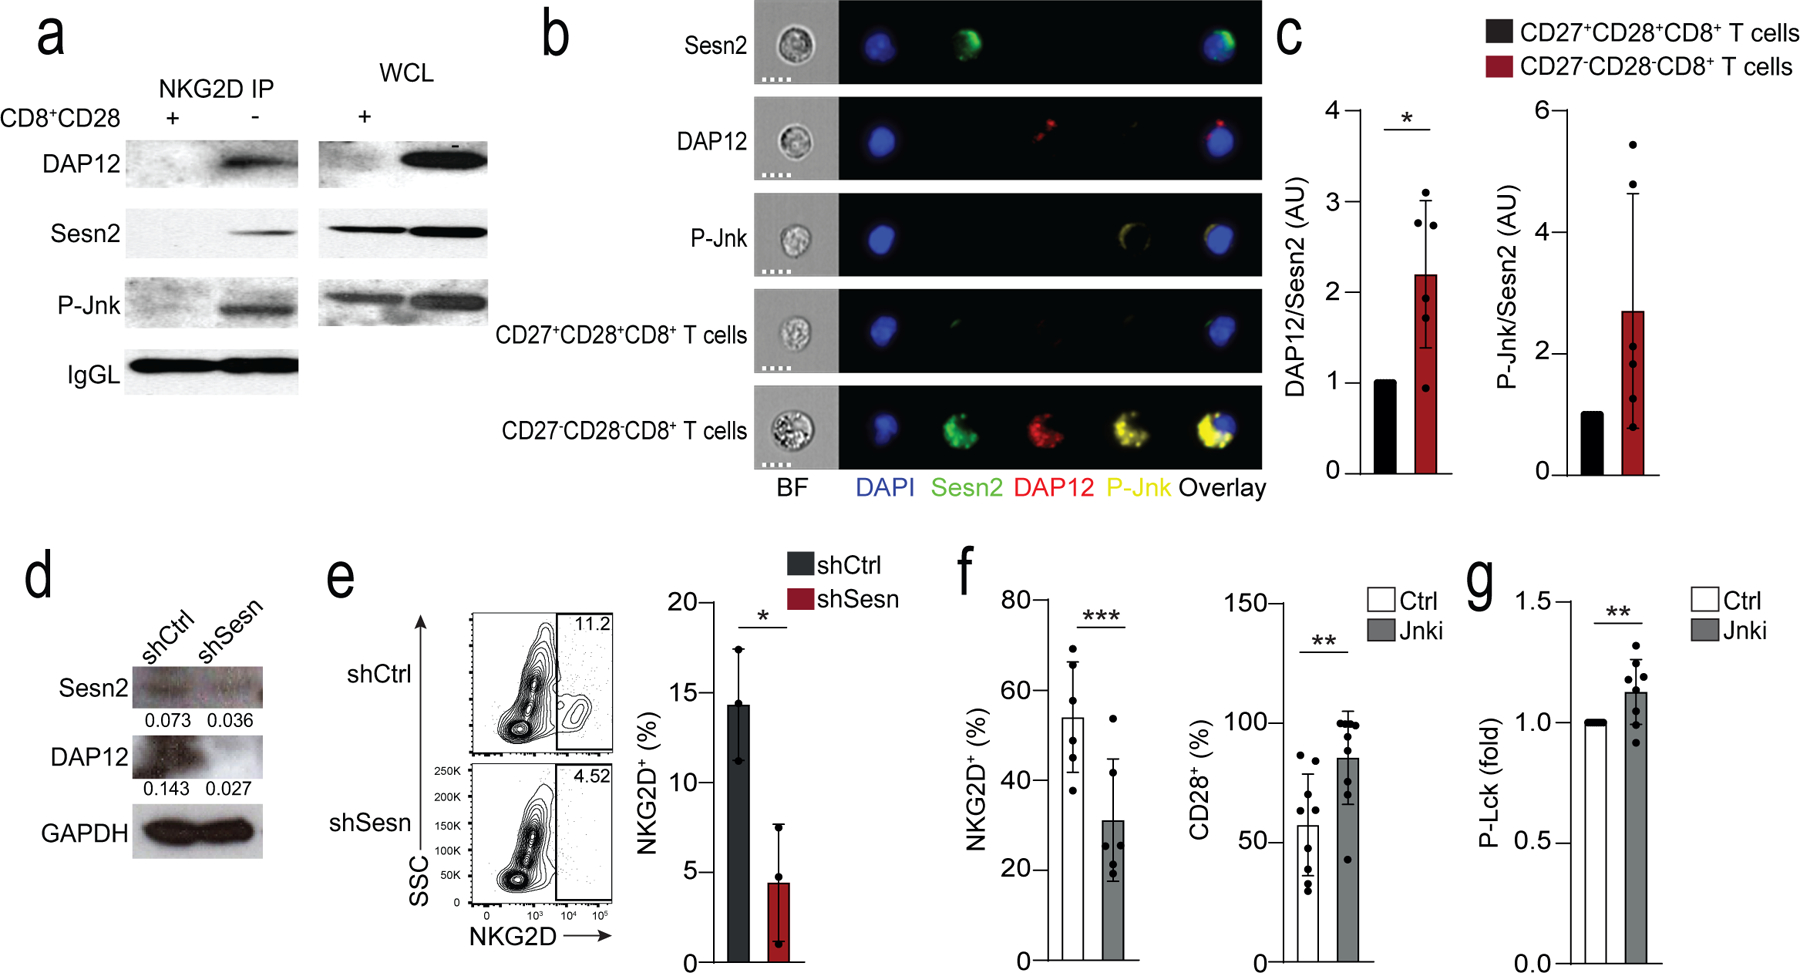
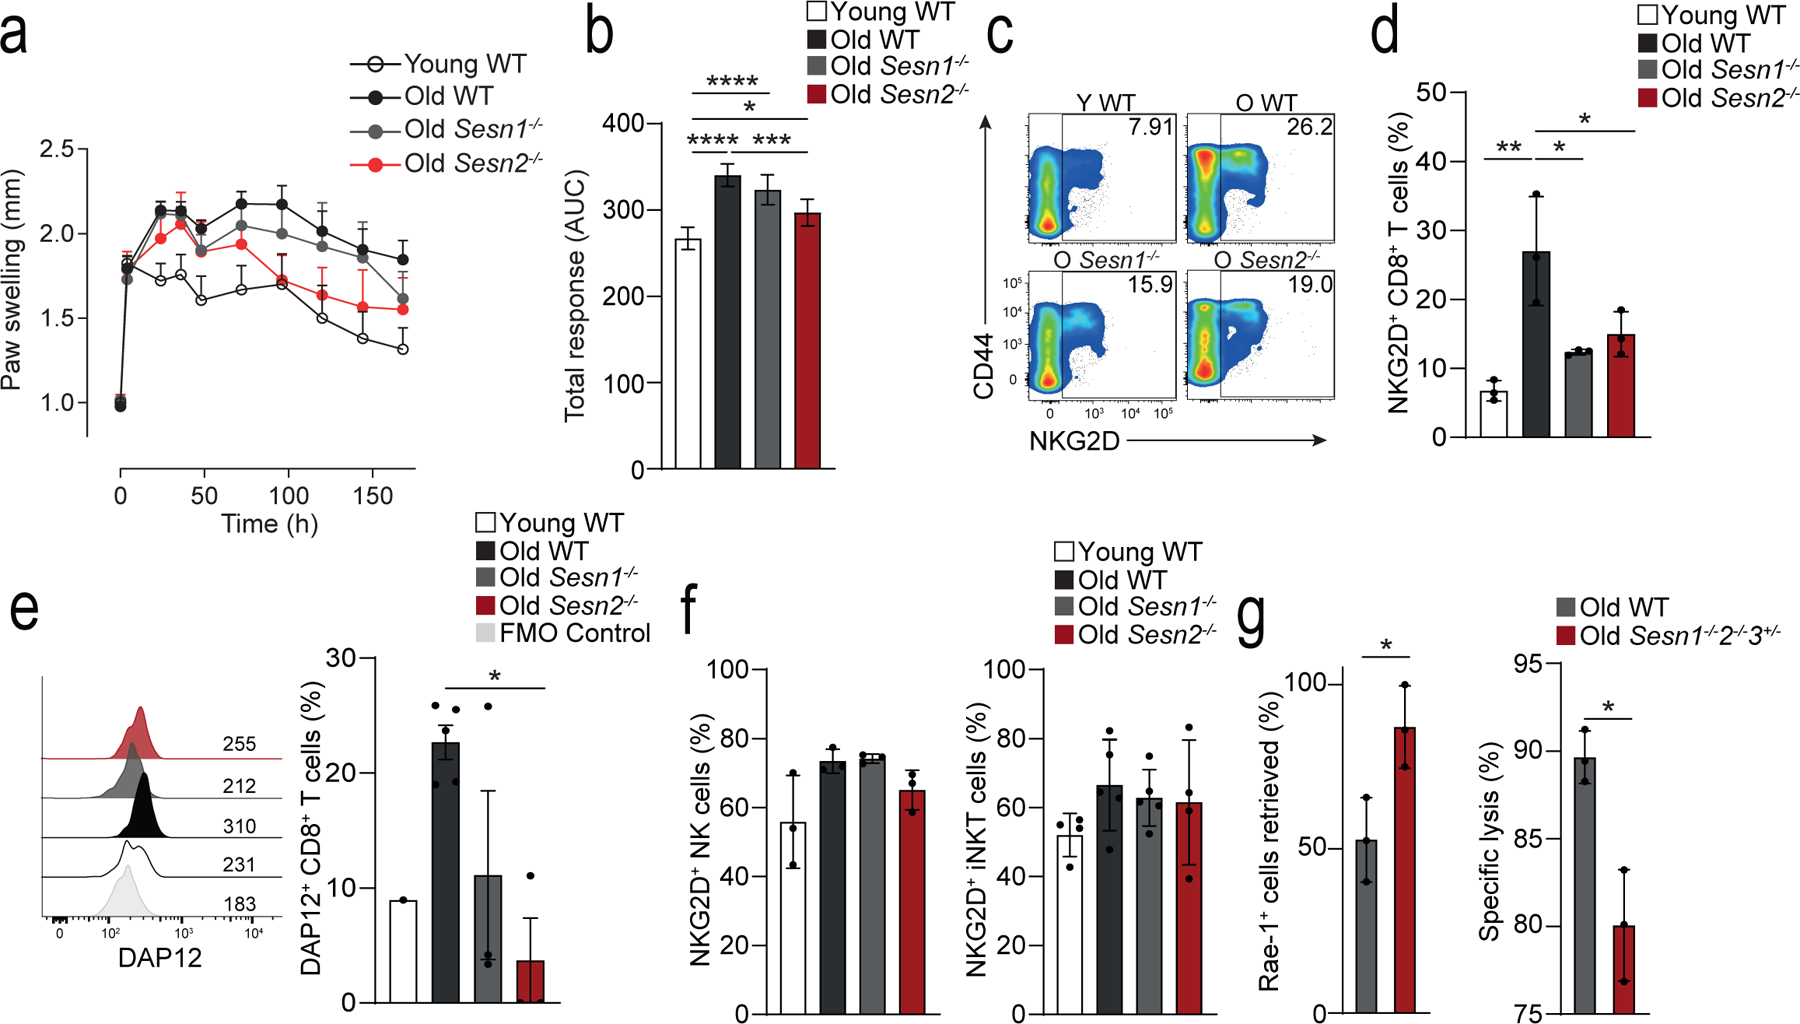
Aging is associated with remodeling of the immune system to enable the maintenance of life-long immunity. In the CD8+ T cell compartment, aging results in the expansion of highly differentiated cells that exhibit characteristics of cellular senescence. Here we found that CD27-CD28-CD8+ T cells lost the signaling activity of the T cell antigen receptor (TCR) and expressed a protein complex containing the agonistic natural killer (NK) receptor NKG2D and the NK adaptor molecule DAP12, which promoted cytotoxicity against cells that expressed NKG2D ligands. Immunoprecipitation and imaging cytometry indicated that the NKG2D-DAP12 complex was associated with sestrin 2. The genetic inhibition of sestrin 2 resulted in decreased expression of NKG2D and DAP12 and restored TCR signaling in senescent-like CD27-CD28-CD8+ T cells. Therefore, during aging, sestrins induce the reprogramming of non-proliferative senescent-like CD27-CD28-CD8+ T cells to acquire a broad-spectrum, innate-like killing activity.


Conflict of interest statement

Competing interests: The authors have declared that no conflict of interest exists.

Figures

Extended data 1:
Extended data 1:. CD8+ T cell gating and NKR expression
a) Representative flow cytometry plots showing T cell gating and NKR expression on peripheral blood lymphocytes, specifically focusing on CD8+ T cell subsets stratified by the expression of CD27/CD45RA in healthy donors. Defined subsets are CD27+CD45RA+ TN, CD27+CD45RA TCM, CD27CD45RA TEM, and CD27CD45RA+ TEMRA cells. b) Confirmation of expression of CD57, KLRG1, CD244, NKG2D, NKG2C, and KIR2DL on TN (naïve), TCM, TEM, and TEMRA CD8+ T cell subsets. Numbers in quadrants represent percentages of cells in each subset. Numbers above the histograms indicate the MFI. c) Flow cytometry gating of CD8+ T cells to confirm CD27 and CD28 expression in subpopulations based on CD27/CD45RA gating.
Extended data 2:
Extended data 2:. NKR expression in CD8+ and CD4+ T cells defined by CD27/CD28
Expression of NK cell receptors (NKR) on a) CD8+ and b) CD4+ T cells assessed by flow cytometry on PBMCs from 22 healthy donors (median age = 52, range 25–83). Total CD8+ and CD4+ T cells were stratified into three subsets according to CD27/CD28 expression as shown in Extended Data 1a.
Extended data 3:
Extended data 3:. scRNA-seq method and quality control
a) Overview of the scRNA-seq processing pipeline. Raw data (n=82,061 sorted CD8+ T cells) from six healthy older adult donors (six IL7R+ and six IL7R− CD8+ T cell samples) were first cleaned from the multiplets, using Scrublet36, then merged, resulting in a dataset containing 62,343 cells. After batch correction using BBKNN37, the Scanpy66 -based pipeline was ran (see Methods section). b) Number of cells per individual (n=12). IL7R+ (n=6, in green) and IL7R− (n=6; in purple). c) Number of genes per distribution across the IL7R+ (in green) and IL7R− (in purple) cells. d) Number of cells before (light orange) and after (light blue) filtration (i.e. doublet removal and other filtration steps that are described in Methods), within each individual. e) Bar plot highlighting the cell abundances across clusters (n=13) for 10X run batches (upper panel) and IL7R+ and IL7R groups (lower panel) after BBKNN batch effect correction. f) Bar plot highlighting the individual (n=12) cell abundances across clusters (n = 13) after BBKNN batch effect correction. Each color represents an individual. g) Number of cells in each cluster.
Extended data 4:
Extended data 4:. scRNA-seq comparison of re-clustered CD8+ T cells
a) Violin plot showing the IL7R expression (as defined by scRNA-seq) across the 13 clusters. b) Dotplot showing the genes that are modulated in TN (top genes in red) and TEMRA (top genes in green) compartments. The scores (y-axis) were defined using the Scanpy function (sc.tl.rank_genes_groups), based on Wilcoxon statistical test. FC = Fold change. TN (C0, C4 and C8) and TEMRA (C1, C2 and C6) compartments were extracted, a second round of clustering on the selected clusters (n = 39,634) was performed (as in Fig. 3) and UMAP plots highlighting c) IL7R groups (IL7R+ in green, IL7R in purple, as defined by flow sorting) and d) of representative genes are shown.
Extended data 5:
Extended data 5:. Extended data on cytotoxicity and Sesn2 expression
a) Titration curve of varying effector to target (E:T) ratios on cytotoxicity measured as specific lysis of K562 cells using a calcein-release of CD27CD28CD8+ (DN) T cells and NK cells isolated by FACS. Non-linear regression (5-parameter asymmetric) was performed (means and s.d., n = 3 donors). b) Calcein-release cytotoxicity assay of K562 cells by CD27+CD28+ (DP), CD27+CD28 (SP), DN CD8+ T cells, and NK cells at E:T 20:1. Cytotoxicity was assessed over a period of six hours (means and s.d., n = 3 donors). c) Representative dot plot of MICA/B expression in C1R and C1R-MICA*008 cells. d) Representative histogram of NKG2D expression on CD28CD8+ T cells after transfection with NKG2D siRNA (siNKG2D, black) or scrambled siRNA (siCtrl, grey), determined 36 hours after transfection. Numbers indicate MFI. e) Expression of DAP10 on human NK cells, and DP, SP, and DN CD8+ T cell subsets. Mean fluorescence intensity is shown (means and s.d., n = 4 for T cell, n = 3 NK cells). f) Sestrin 2 on CD8+ T cells from young (<35 years, n = 5) and old (>65 years, n = 4) donors. MFIs are shown (geometric means and geometric s.d. factor). Two-tailed, unpaired Welch’s t test, ** p < 0.01.
Extended data 6:
Extended data 6:. YFV-tet+CD8+ T cells exhibit an NK phenotype
Data mined from Akondy et al. (GSE100745) showing the relative fold-change (log2) of differentially expressed genes of interest in YFV-tetramer+ effector (14 days post-vaccination, black bars, n = 3) or memory (4–12 years post-vaccination, red bars, n = 5) compared to naïve (n = 6) CD8+ T cells.
Extended data 7:
Extended data 7:. Extended data on the murine delayed-type hypersensitivity model
a) Spleen weight following mBSA-driven DTH response in young wild-type (Y WT, n = 4 mice), old wild-type (O WT, n = 8 mice), old Sesn1−/− (O Sesn1−/−, n = 5 mice), and old Sesn2−/− (O Sesn2−/−, n = 4 mice). Bars represent means and s.d.. b) Representative gating strategy to identify NK1.1+ NK cells (violet), TCRβ+CD1d tetramer reactive iNKT cells (purple), TCRβ+CD3+ CD4+ (blue) and CD8+ (red) T cells in mice. Similar results were obtained in all mice (n = 3 per group). c) Quantification of these cell types in the spleen (means and s.e.m., n = 3 mice per group). d) Dot plots showing relative frequencies of CD44CD62L+ naïve (grey), CD44+CD62L+ central (blue), and CD44+CD62L effector (red) CD8+ T cells. e) Quantification of these cell types as a proportion of total splenic CD8+ T cells (means and s.e.m., n = 3 per group). f) Enumeration of NKG2D, NKG2A/C/E, KLRG1, Ly49, and NKp46 expression on CD8+ T cells from Y WT, O WT, O Sesn1−/−, and O Sesn2−/− mice (means and s.e.m., n = 3 per group). One-way ANOVA with Tukey’s multiple comparisons test. * p < 0.05, ** p < 0.01, *** p < 0.001, **** p < 0.0001.
Fig. 1:
Fig. 1:. Transcriptional signature of human CD8+ T cell subsets
a) Representative image of CD8+ T cells gated on CD27+CD45RA+ TN cell, CD27+CD45RA TCM cells, CD27CD45RATEM cells, and CD27CD45RA+TEMRA cells isolated from the PBMCs from 6 healthy donors. Numbers in gates represent percentages of cells in each subset from a representative donor. Similar results were obtained in other experiments. b) Heat map of gene expression of Affymetrix U133 plus 2 microarrays of sorted TN and TEMRA CD8+ T cell subsets, showing downregulated (in yellow) and upregulated genes (in blue). c) The relative fold-change (log10) of differentially expressed genes of interest in TCM, TEM and TEMRA CD8+ T cell subsets compared to TN CD8+ T cells. The list of genes of interest is shown in Supplementary table 2 and the complete list of differentially expressed genes from the whole-transcriptome analysis (≥2-fold change, p<0.05, FDR<0.05%) is available in Supplementary table 1. d) NKR expression TN, TCM, TEM, and TEMRA CD8+ T cells assessed by flow cytometry on PBMCs from 22 healthy donors (median age = 52, range 25–83). e) Representative immunoblots of proximal TCR components Lck, PLCγ1, LAT and Zap70 on CD27+CD28+, CD27+CD28 and CD27CD28 CD8+ T cells freshly isolated from PBMCs using magnetic activated cell. Similar data were obtained in 4 independent experiments. Summary data (n = 4) of Lck, Zap70, PLCγ1 and LAT expression normalized to the loading control (GAPDH) and presented relative to the basal expression in CD27+28+CD8+ cells set to 1. d) Two-way ANOVA with Dunnett’s post-test correction and e) one-way ANOVA with Tukey’s correction (*p < 0.05, **p < 0.01, ***p < 0.001, ****p < 0.0001).
Fig. 2:
Fig. 2:. Single cell RNA-seq (scRNA-seq) of TN and TEMRA CD8+ T cells
a) UMAP visualisation with clusters demarcated by colours identifying 13 CD8+ T cell clusters (C0 to C12) from RNA-seq analysis of single-cell sorted IL-7R+CD8+ (n = 37,192 single cells) and IL-7RCD8+ (n = 25,151 single cells) T cells from six healthy older donors. b) UMAP plot from a) pseudo-coloured to show clustering of IL7-R+ (in green) and IL7-R (in purple) CD8+ T cells as identified during sorting. c) UMAP plot from a) representing expression values of selected individual genes. Scales show low expression (yellow) to high expression (red). Other aliases or CD numbers of proteins encoded by the listed genes are shown in brackets.
Fig. 3:
Fig. 3:. NK and senescence markers within TN and TEMRA
a) UMAP plot of single-cell sorted IL-7R+CD8+ and IL-7RCD8+ T cells from six healthy older donors. Highlighted clusters were considered as TN (C0, C4 and C8) and TEMRA (C1, C2 and C6) compartments. b) UMAP plot showing re-clustering of selected TN (C0, C4, and C8) and TEMRA (C1, C2, and C6) CD8+ cells from a) (n = 39,634 cells). c) UMAP plots representing the expression values of NK-related genes in re-clustered TN and TEMRA CD8+ cells from b). Scales show low expression (yellow) to high expression (red). d) Violin plots of NK-related gene expression determined by scRNA-seq in TN and TEMRA CD8+ T cells clustered as in b) (means, range, and distribution of individual data; n = 39,364 single cells). e) UMAP plots showing expression of senescence-associated determined by scRNA-seq in TN and TEMRA CD8+ T cells re-clustered as in b). Scales show low expression (yellow) to high expression (red). Other aliases or CD numbers of some gene products are shown in brackets. f) Violin plots of senescence scores calculated based on the average normalized expression of each senescence-associated gene across TN and TEMRA CD8+ cells clustered as in b) (means, range, and distribution of individual data; n = 39,364 single cells). The gene lists used to define NK- and senescence-scores are given in Supplementary table 4).
Fig. 4:
Fig. 4:. NKG2D-DAP12 complex mediates NK cytotoxicity in CD27CD28CD8+ T cells
a) Box-and-whisker plot of cell-surface CD107a expression of CD27+CD28+CD8+, CD27+CD28CD8+, CD27CD28CD8+, and CD3CD56+ NK cells isolated from healthy donors co-cultured with K562 cells at E:T 2:1 (median and range, n = 5). b) CD107a expression on CD28CD8+ T cells transfected with NKG2D siRNA (siNKG2D) or control siRNA (siCtrl) and cultured with C1R-MICA or C1R (E:T ratio 2:1) for 6 hours (mean and s.e.m., n = 4). c) Immunoblots (representative of five independent experiments with similar results) and d) flow cytometry (means and s.e.m., n = 12) showing DAP12 expression on CD27+CD28+CD8+, CD27+CD28CD8+, CD27CD28CD8+, and CD3CD56+ NK cells. g) Expression of DAP12 in lysed CD28+CD8+ T cells and CD28CD8+ T cells co-immunoprecipitated with antibody against NKG2D. Loading control, light-chain IgG (IgGL). Whole-cell lysate immunoblot shown as a control. Representative of two independent experiments. f) Phosphorylation of Zap70(Tyr319) and Syk(Tyr352) in freshly isolated CD27CD28CD8+ T cells after treated with CD3 mAb (OKT3, 10 μg/mL, 15 minutes) and/or NKG2D Ab (1D11, 5 μg/mL, 15 minutes). Numbers indicate relative expression normalized to total Zap70. Representative of 2 experiments. g) Granzyme B expression (left) and IFN-γ secretion (right) in CD27+CD28+CD8+, CD27+CD28CD8+, and CD27CD28CD8+ T cells after stimulation with NKG2D Ab (5 μg/mL, means and s.e.m., n = 15 donors). h) CD107a expression in human CD28CD8+ T cells transfected with DAP12 siRNA (siDAP12) or control siRNA (siCtrl) cultured with C1R-MICA*008 or C1R cells for 6 hours (E:T ratio 2:1; means and s.e.m., n = 4). Statistical significance determined with Kruskal-Wallis test in a) Friedman test with Dunńs correction in d), two-way ANOVA with Bonferroni correction in b, j) and one-way ANOVA with Tukey’s in g) (*p <0.05, **p <0.01, ***p <0.001).
Fig. 5:
Fig. 5:. Sestrins and Jnk MAPK dampen TCR signalling in CD27CD28CD8+ T cells
a) Representative histograms of P-CD3ζ in CD27+CD28+CD8+, CD27+CD28CD8+, and CD27 CD28CD8+ T cells stimulated with anti-CD3 (OKT3, 10 μg/mL, 15 minutes). Unstimulated CD27+CD28+CD8+ are shown as a control. Numbers on histograms represent the mean fluorescence intensity (MFI) for each subset. Summary data are given (means and s.d., n = 8 donors). b) Representative histograms of P-Zap70-Syk in CD27+CD28+CD8+, CD27+CD28 CD8+, and CD27CD28CD8+ T cells stimulated as in a). Unstimulated CD27+CD28+CD8+ are shown as a control. Numbers on histograms represent the mean fluorescence intensity (MFI) for each subset. Summary data are given (means and s.d., n = 8). Summary results presented as the MFI relative to that of DP CD8+ T cells, set to 1. c, d) Expression of Sesn1 c) and Sesn2 d) proteins determined by flow cytometry in CD27+CD28+CD8+, CD27+CD28CD8+, and CD27CD28CD8+ T cells (means and s.d., n = 10 donors). e) Immunoblot of Sesn2 and p-Jnk (T183/Y185) in CD27+CD28+CD8+, CD27+CD28CD8+, and CD27CD28CD8+ T cells, freshly isolated from peripheral blood of healthy donors. Representative of three independent experiments with similar results. Densitometry data from western blots for all donors is also shown (means and s.e.m., n = 3 donors for p-Jnk, n = 4 donors for Sesn2). Statistical significance determined with ANOVA with Friedman test and Dunn’s post-test correction in a-b), repeated measures one-way ANOVA with Tukey’s multiple comparisons test in c-e) (*p <0.05, **p <0.01, ***p <0.001, ****p <0.0001).
Fig. 6:
Fig. 6:. Sestrins regulate DAP12 and NKG2D expression in CD8+ T cells.
a) Expression of DAP12, sestrin 2 and p-Jnk (T183/Y185) in lysed CD28+CD8+ T cells and CD28CD8+ T cells immunoprecipitated with NKG2D. Loading control: IgG light chain (IgGL). Results are representative of two independent experiments. b) Cellular localization of Sesn2 (AF488, green), DAP12 (PE, red) and P-Jnk (T183/Y185, AF647, yellow) in CD27+CD28+CD8+ and CD27CD28CD8+ T cells. “Sesn2”, “DAP12”, and “p-Jnk” denote single stain controls in CD27CD28CD8+. Nuclei are stained with DAPI (blue). Scale bars – 7 μm. c) Overlap of Sesn2 and DAP12 or P-Jnk in CD27+CD28+CD8+ and CD27CD28CD8+ T cells. Bright detail similarity scores exceeding 2 were considered to be overlapping. Data are normalized to the CD27+CD28+CD8+ T cell subset for each donor (means and s.d., n = 6). d-e) Isolated human CD8+CD28 T cells were transduced with control (shCtrl) or anti-sestrin (shSesn) vectors. d) Representative immunoblot for Sesn2 and DAP12 (representative of two experiments). e) Representative contour plots and summary data of NKG2D expression. Results are presented relative to cells transduced with shCtrl for each donor, set as 1 (means and s.d., n = 3 donors). f) Frequency of NKG2D and CD28 in isolated CD28CD8+ T treated with siJnk (means and s.d., n = 6 donors). g) Lck phosphorylation in CD28CD8+ T cells pre-treated with Jnk inhibitor (SP-600125, 10 μM) prior to anti-CD3 stimulation (OKT3, 10 μg/ml, 15 minutes; means and s.d., n = 8 donors). Two-tailed paired Student’s t tests in c,f-g) (*p <0.05, **p <0.01, ***p <0.001).
Fig. 7:
Fig. 7:. Sestrins induce an age-dependent NK phenotype in CD8+ T cells in vivo
a) Measurement of paw size (normalized to the contralateral, PBS control paw) over time (0h, 4h, 24h, 36h, 2, 3, 4, 5, 6, 7 days) in young wild-type (young WT; n = 4), old WT (n = 10), old Sesn1−/− (n = 5) and old Sesn2−/− (n = 4) mice following intra-plantar treatment with mBSA. b) Area under the curve integration of the time course data shown in a) (means and s.d.) c) Representative pseudo-colour density plots showing CD44 vs NKG2D expression on TCRβ+CD3+CD8+ T cells isolated from spleens of young WT, old WT, old Sesn1−/−, and old Sesn2−/− mice. Frequencies of parent gates are shown in the top right-hand corner. d) Cumulative data of NKG2D expression in splenic TCRβ+CD3+CD8+ T cells from young WT, old WT, old Sesn1−/−, and old Sesn2−/− mice (n = 3 mice per group). e) Representative histogram of DAP12 expression from splenic TCRβ+CD3+CD8+ T cells from young WT, old WT, old Sesn1−/−, and old Sesn2−/− mice. FMO control is shown. Cumulative data shown (n = 3 per group, n = 1 young WT). f) NKG2D expression in splenic NK- and iNKT cells from the same mice as in c-d) (means and s.d., n = 3 mice per group). g) Retrieval of Rae-1+ 5TGM1 cells as a fraction of injected cells (left panel) and killing and specific lysis of injected Rae-1+ 5TGM1 cells (right panel) from the spleens of NK-depleted (24h, anti-NK1.1, i.p.) old WT and old Sesn1−/−Sesn2−/−Sesn3+/− mice 6 hours after i.v. challenge (means and s.d., n = 3 mice per group). Statistical significance determined with one-way ANOVA with Tukey’s multiple comparisons test in b,d-g); two-tailed unpaired Student’s t tests in h-i). (*p <0.05, **p <0.01, ***p <0.001, ****p <0.0001).

Comment in

References

    1. Akbar AN, Beverley PC & Salmon M Will telomere erosion lead to a loss of T-cell memory? Nature Reviews Immunology 4, nri1440 (2004). - PubMed
    1. Gray D A role for antigen in the maintenance of immunological memory. Nat Rev Immunol 2, nri706 (2002). - PubMed
    1. Mitri D et al. Reversible Senescence in Human CD4+CD45RA+CD27− Memory T Cells. The Journal of Immunology 187, 2093–2100 (2011). - PubMed
    1. Henson SM et al. p38 signaling inhibits mTORC1-independent autophagy in senescent human CD8+ T cells. Journal of Clinical Investigation 124, 4004–4016 (2014). - PMC - PubMed
    1. Lanna A, Henson SM, Escors D & Akbar AN The kinase p38 activated by the metabolic regulator AMPK and scaffold TAB1 drives the senescence of human T cells. Nature immunology 15, 965–72 (2014). - PMC - PubMed

Methods references

    1. Callender LA et al. Human CD8+ EMRA T cells display a senescence‐associated secretory phenotype regulated by p38 MAPK. Aging Cell 17, (2018). - PMC - PubMed
    1. Gérart S, Sibéril S, Martin E, Lenoir C, Aguilar C, Picard C, Lantz O, Fischer A, Latour S (2013). Human iNKT and MAIT cells exhibit a PLZF-dependent proapoptotic propensity that is counterbalanced by XIAP Blood 121(4), 614–623. - PMC - PubMed
    1. Wolock SL, Lopez R & Klein AM Scrublet: computational identification of cell doublets in single-cell transcriptomic data. bioRxiv(2018). doi:10.1101/357368 - DOI - PMC - PubMed
    1. Wolf FA, Angerer P & Theis FJ SCANPY: large-scale single-cell gene expression data analysis. Genome Biol 19, 15 (2018). - PMC - PubMed
    1. Satija R, Farrell JA, Gennert D, Schier AF & Regev A Spatial reconstruction of single-cell gene expression data. Nat. Biotechnol 33, 495–502 (2015). - PMC - PubMed

Publication types

MeSH terms

Substances