. 2020 Apr;22(4):476-486.
doi: 10.1038/s41556-020-0496-x. Epub 2020 Mar 30.

Cystine transporter regulation of pentose phosphate pathway dependency and disulfide stress exposes a targetable metabolic vulnerability in cancer

Affiliations

Cystine transporter regulation of pentose phosphate pathway dependency and disulfide stress exposes a targetable metabolic vulnerability in cancer

Xiaoguang Liu et al. Nat Cell Biol. 2020 Apr.

Abstract

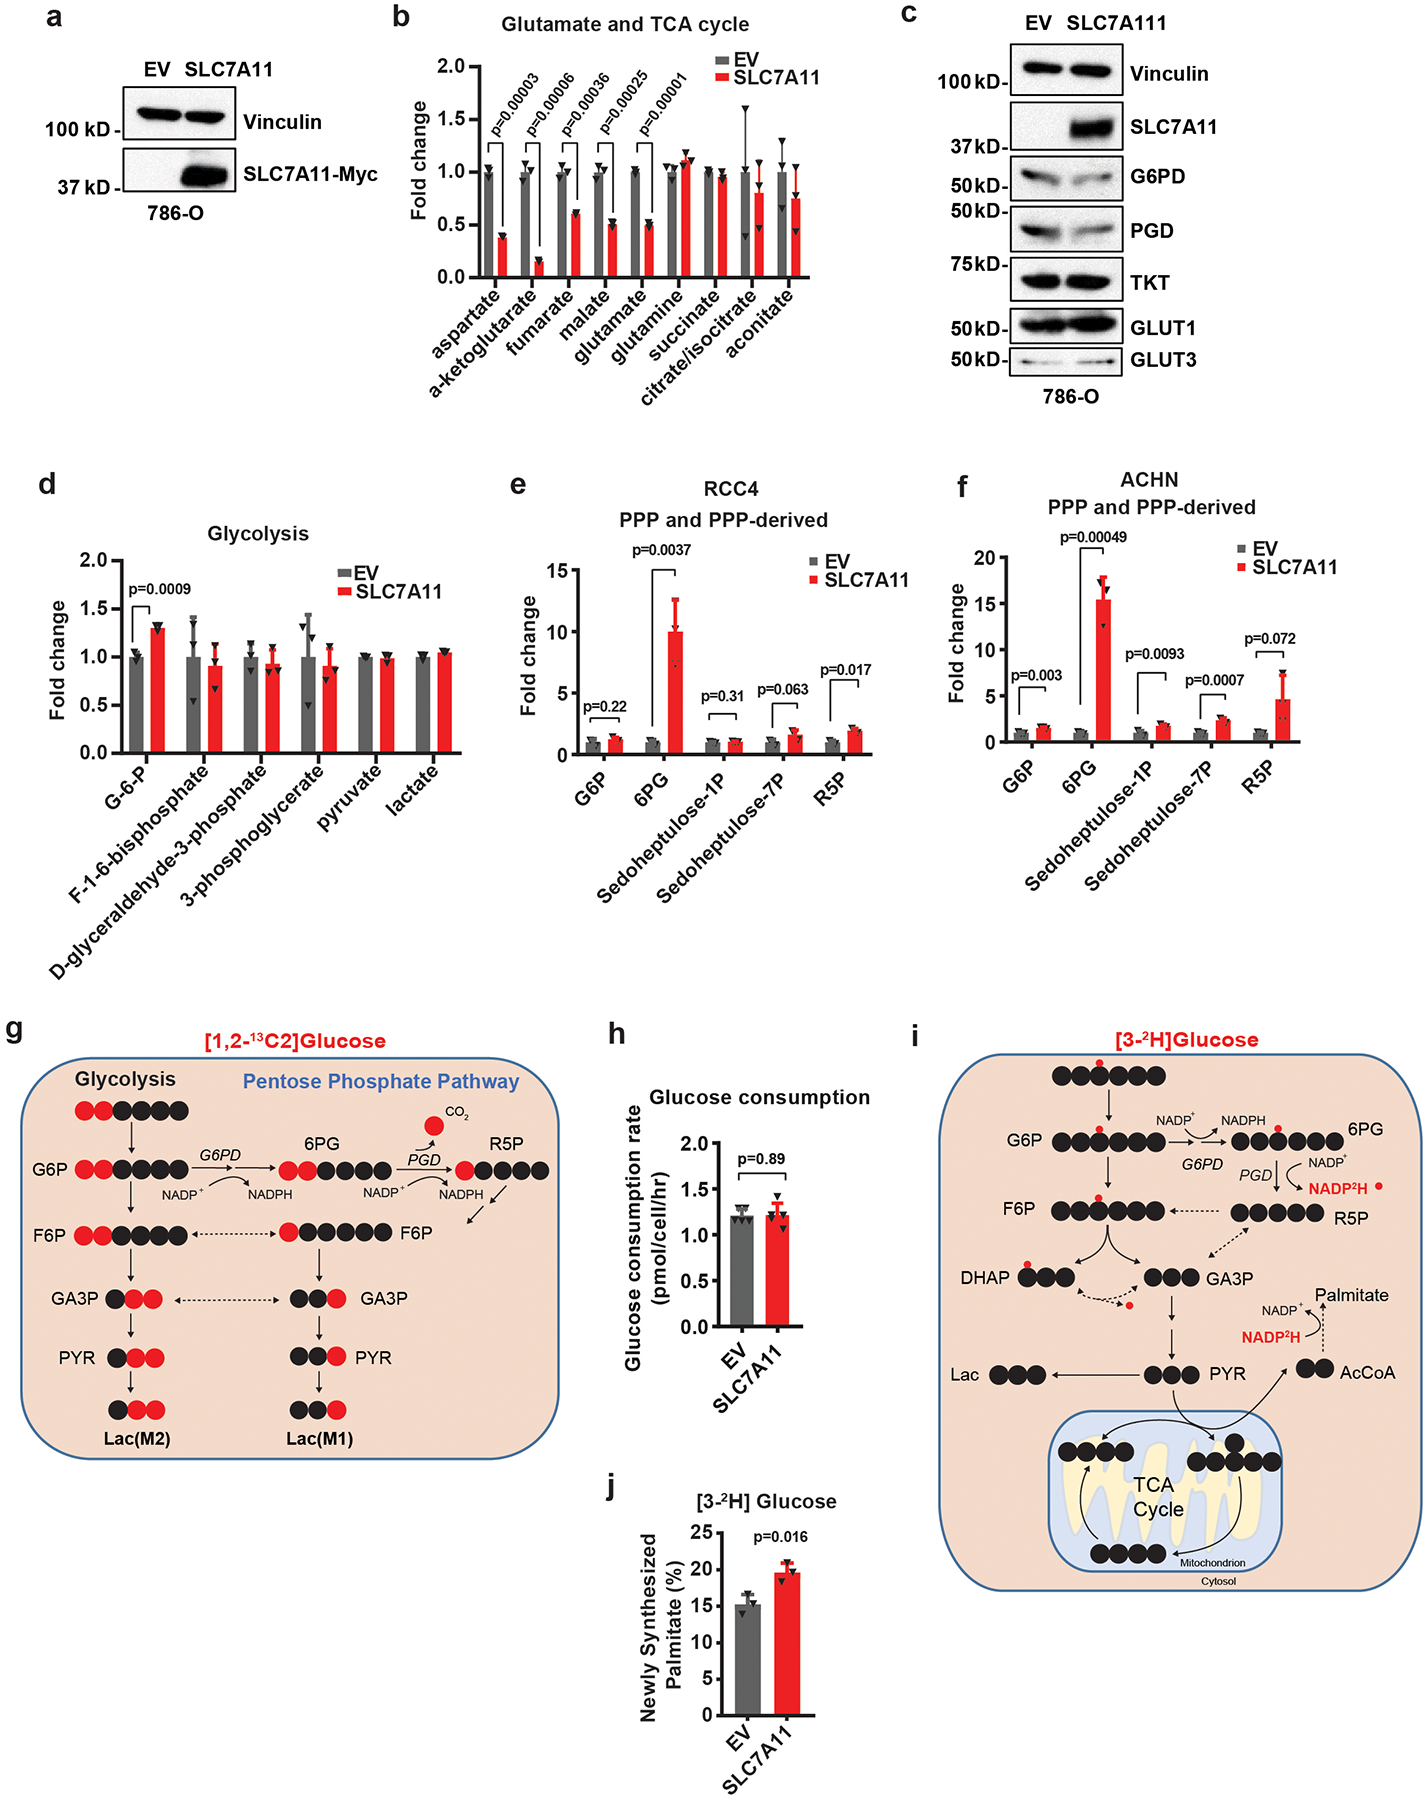
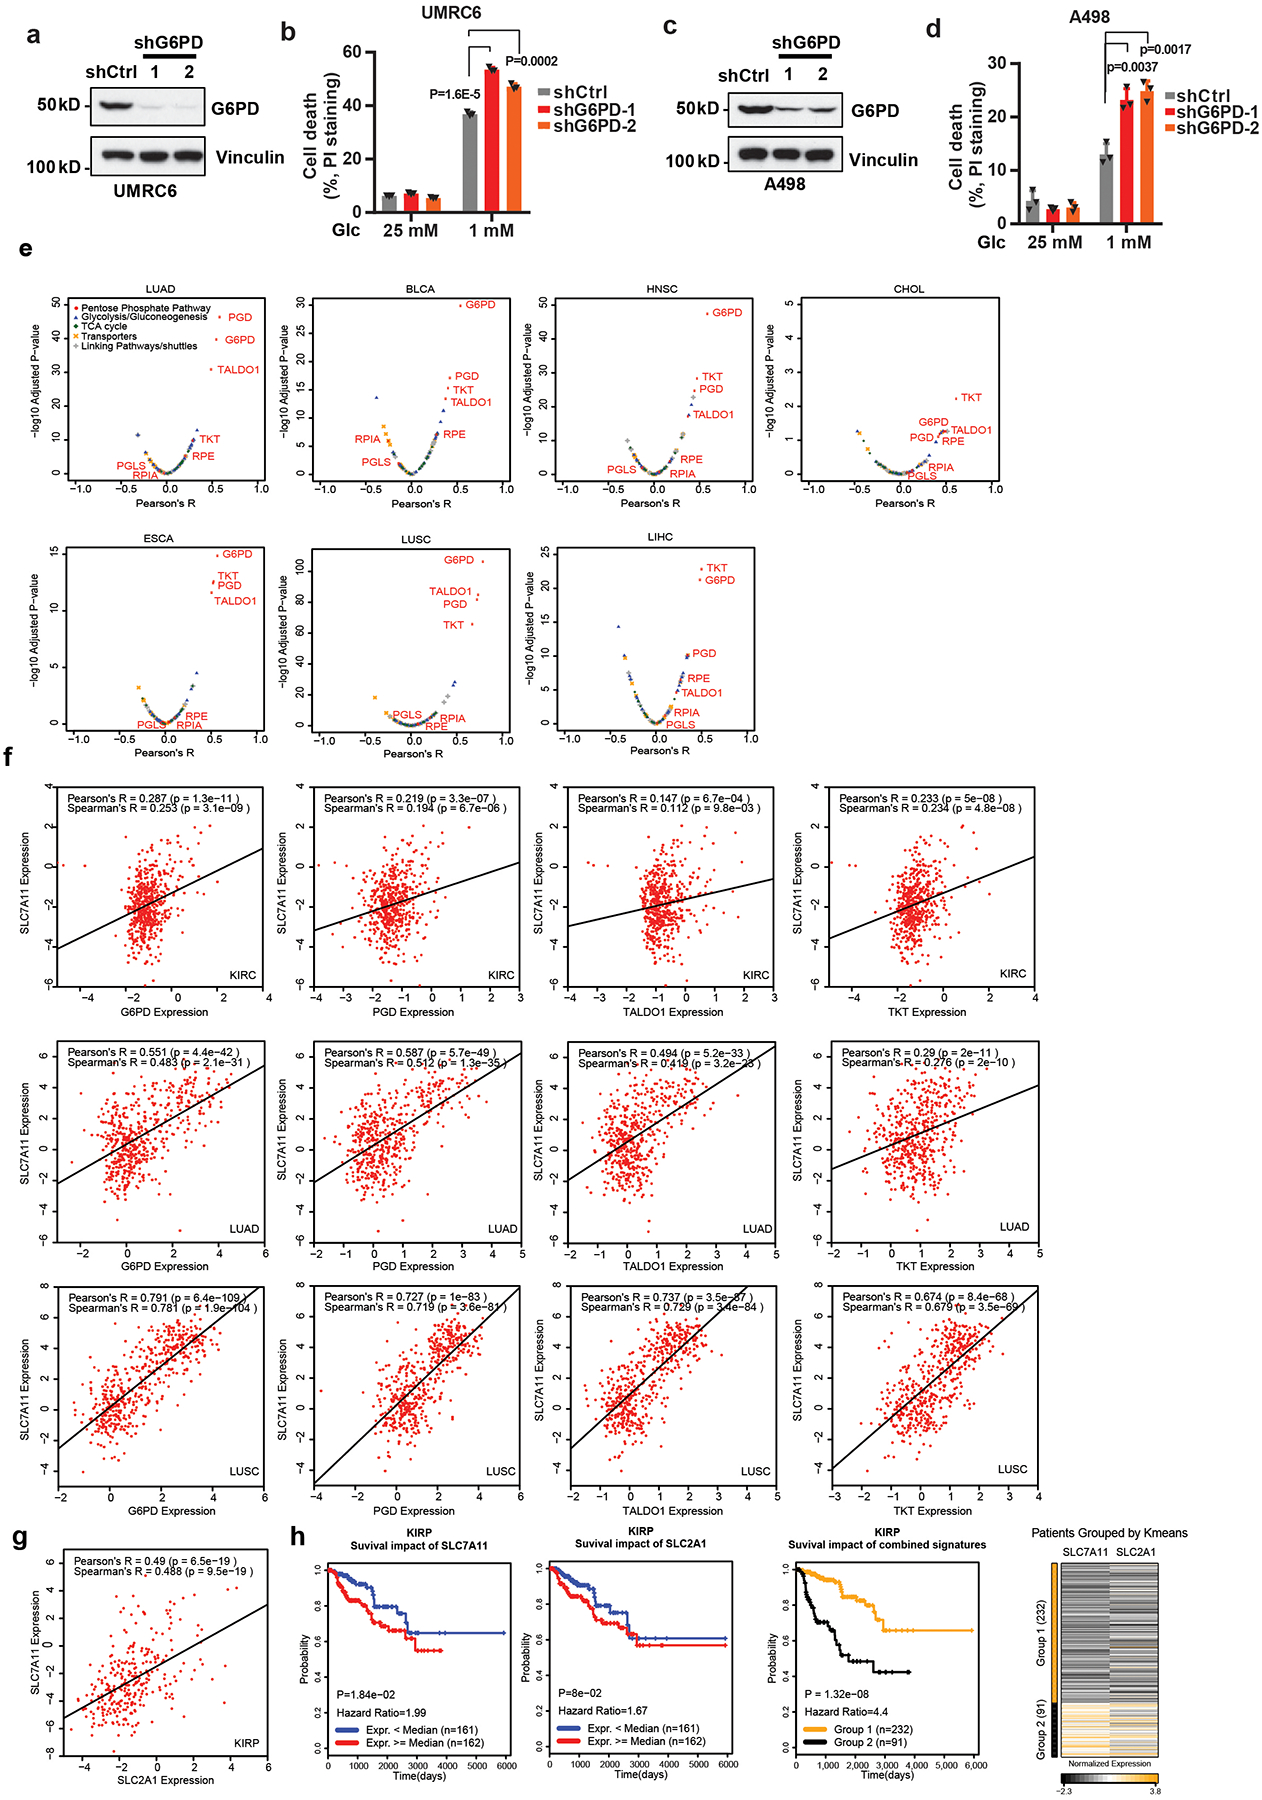
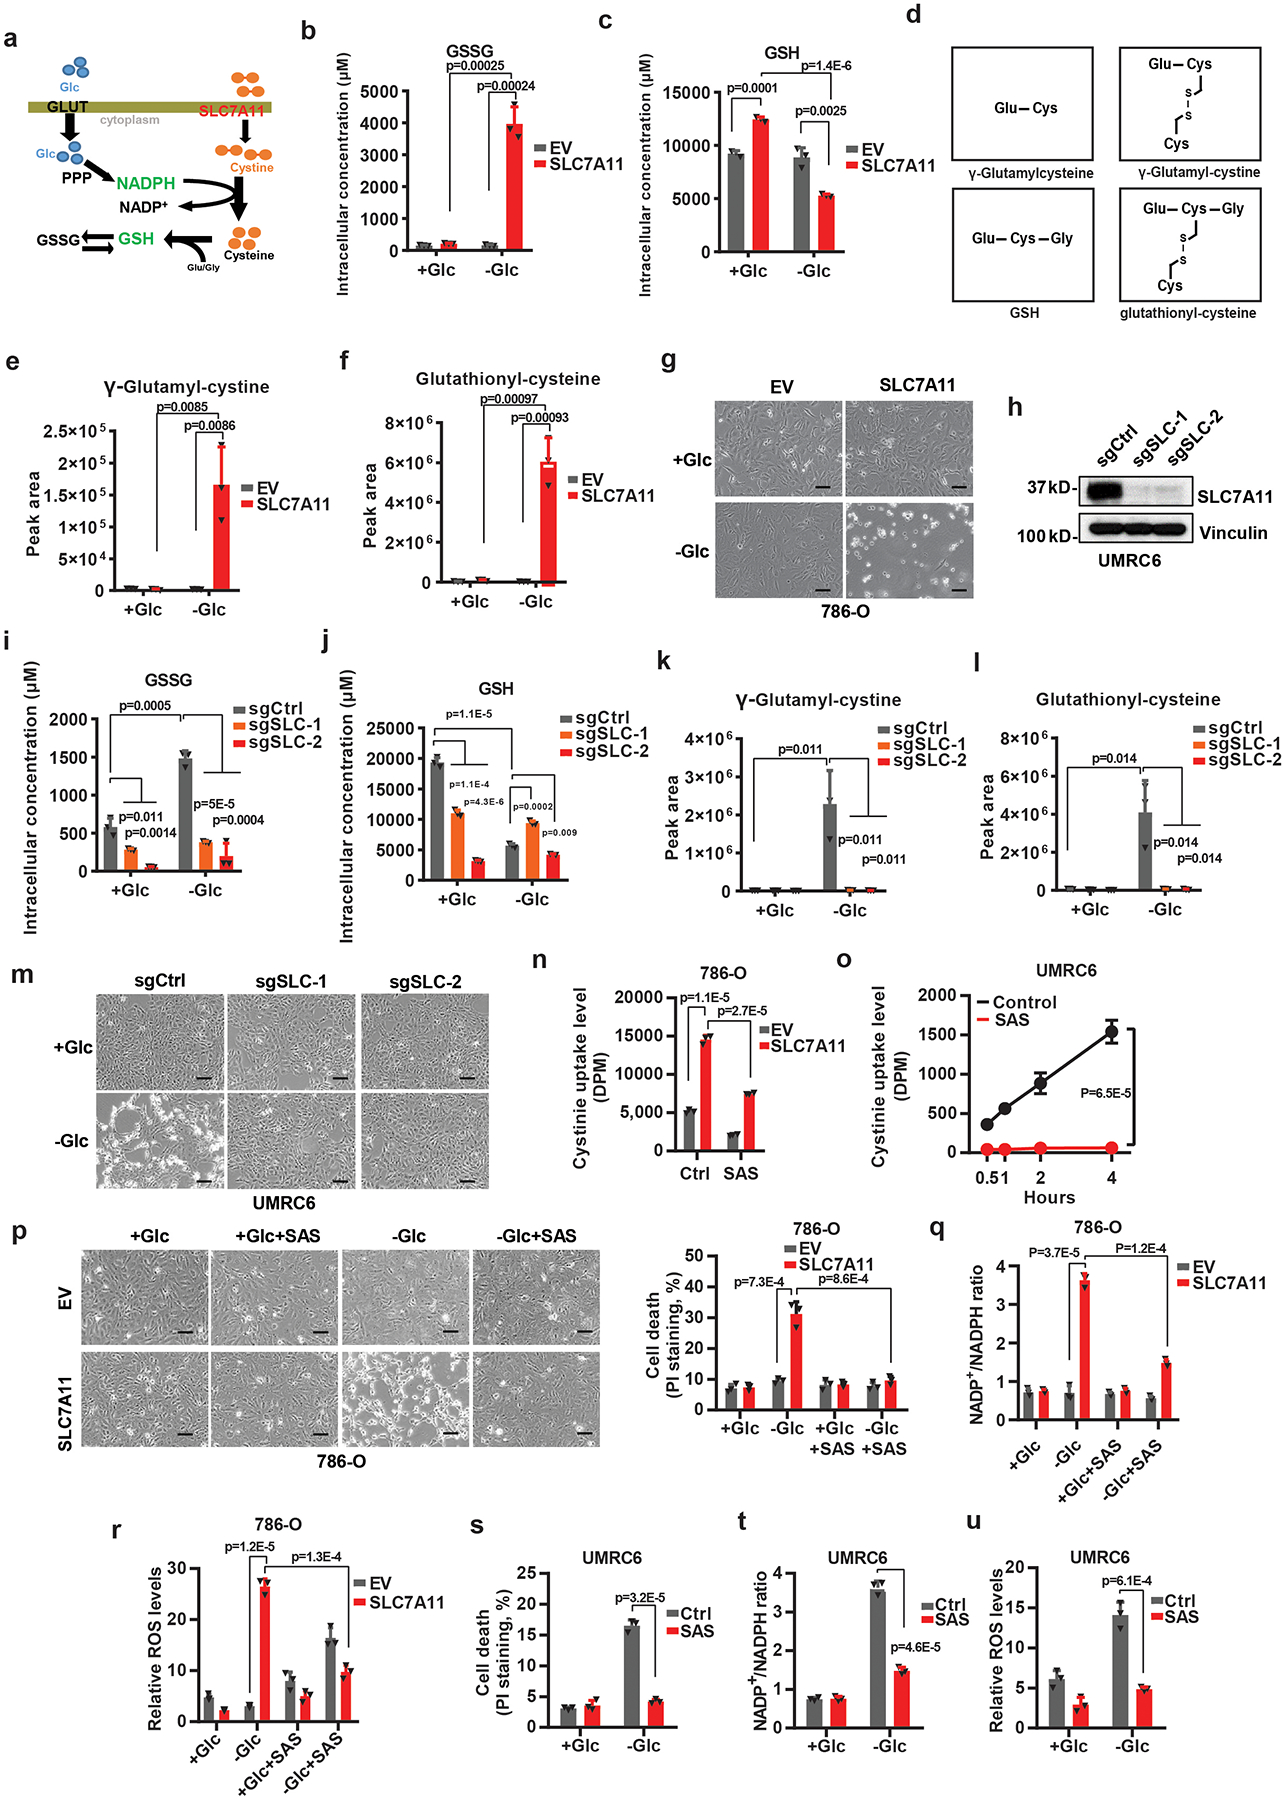
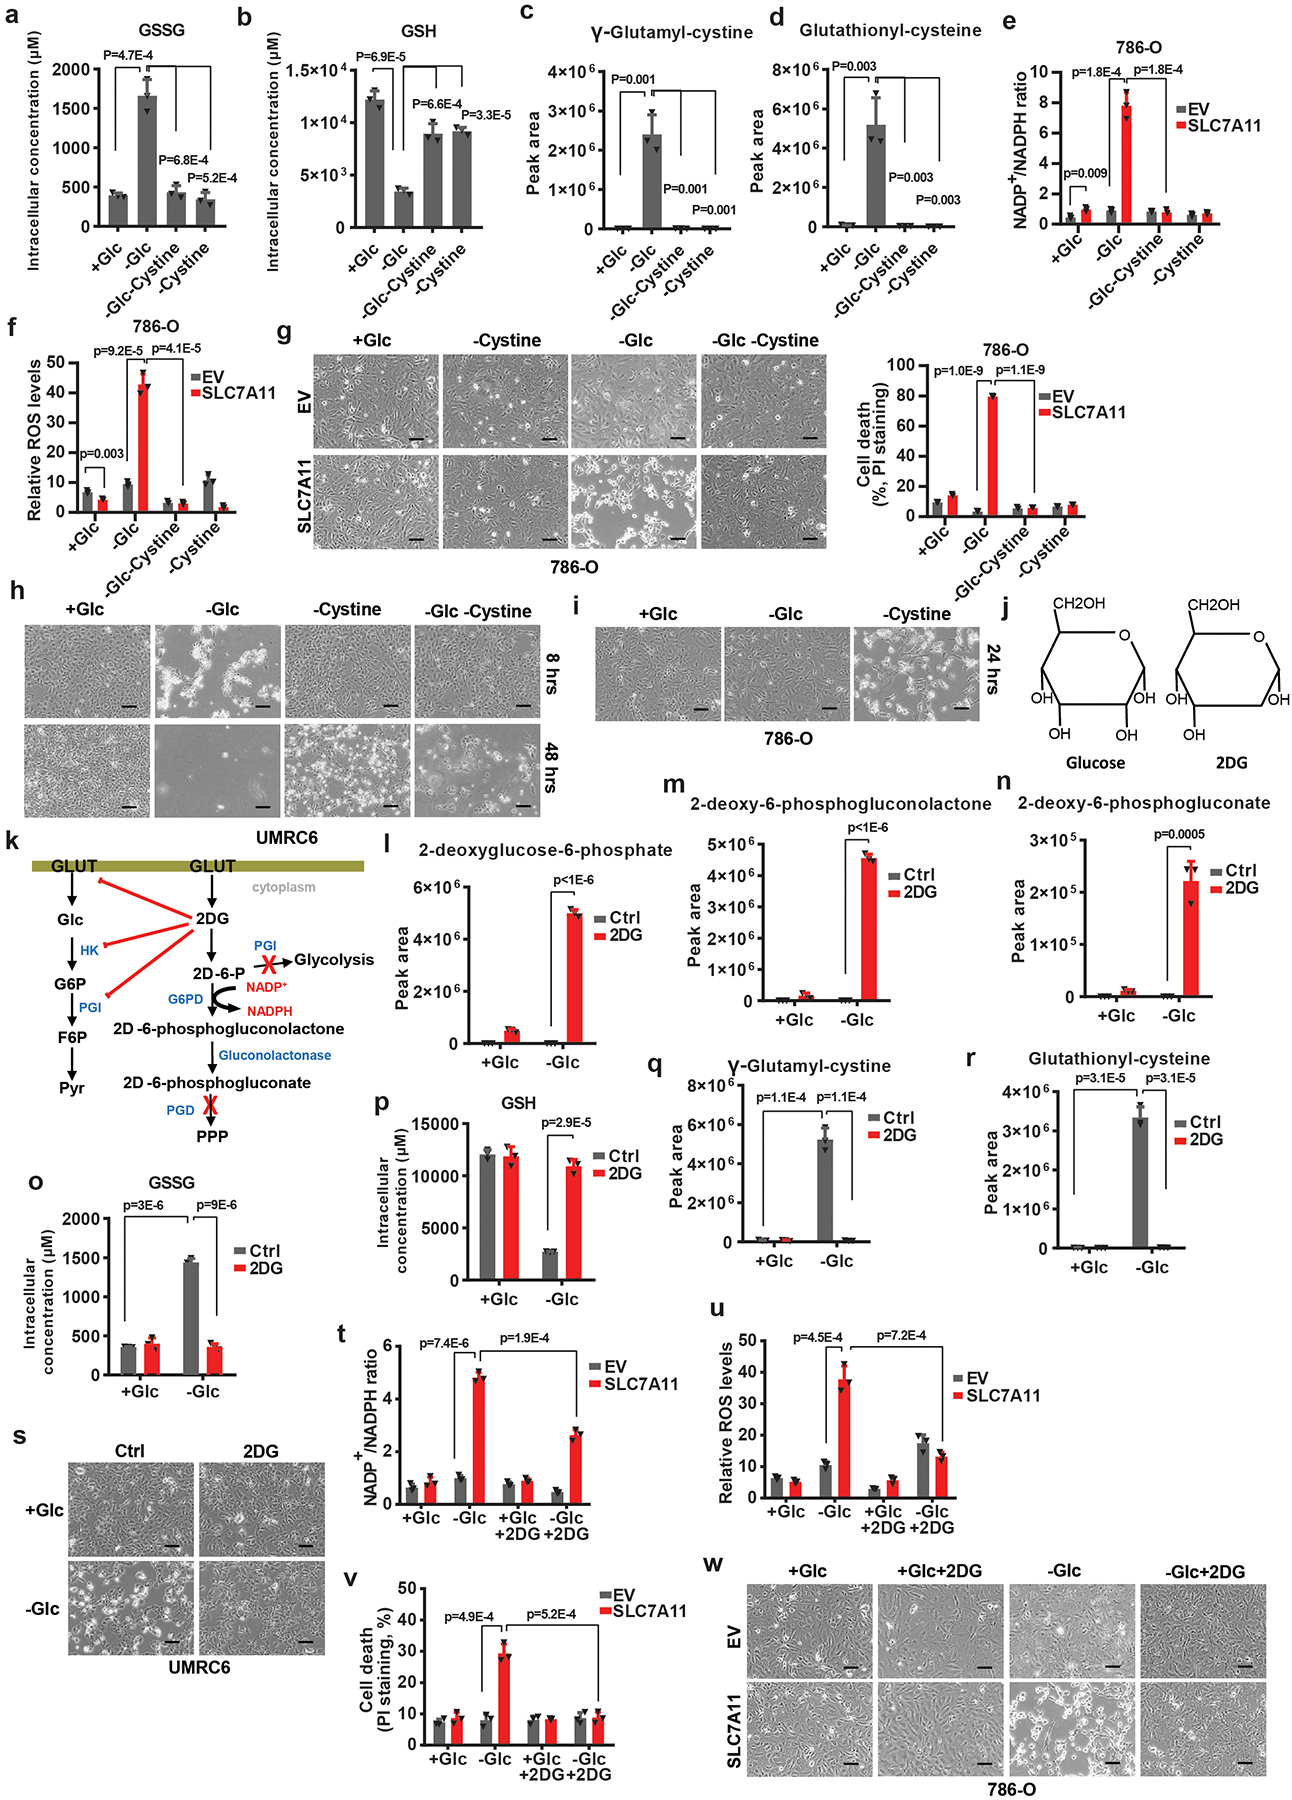
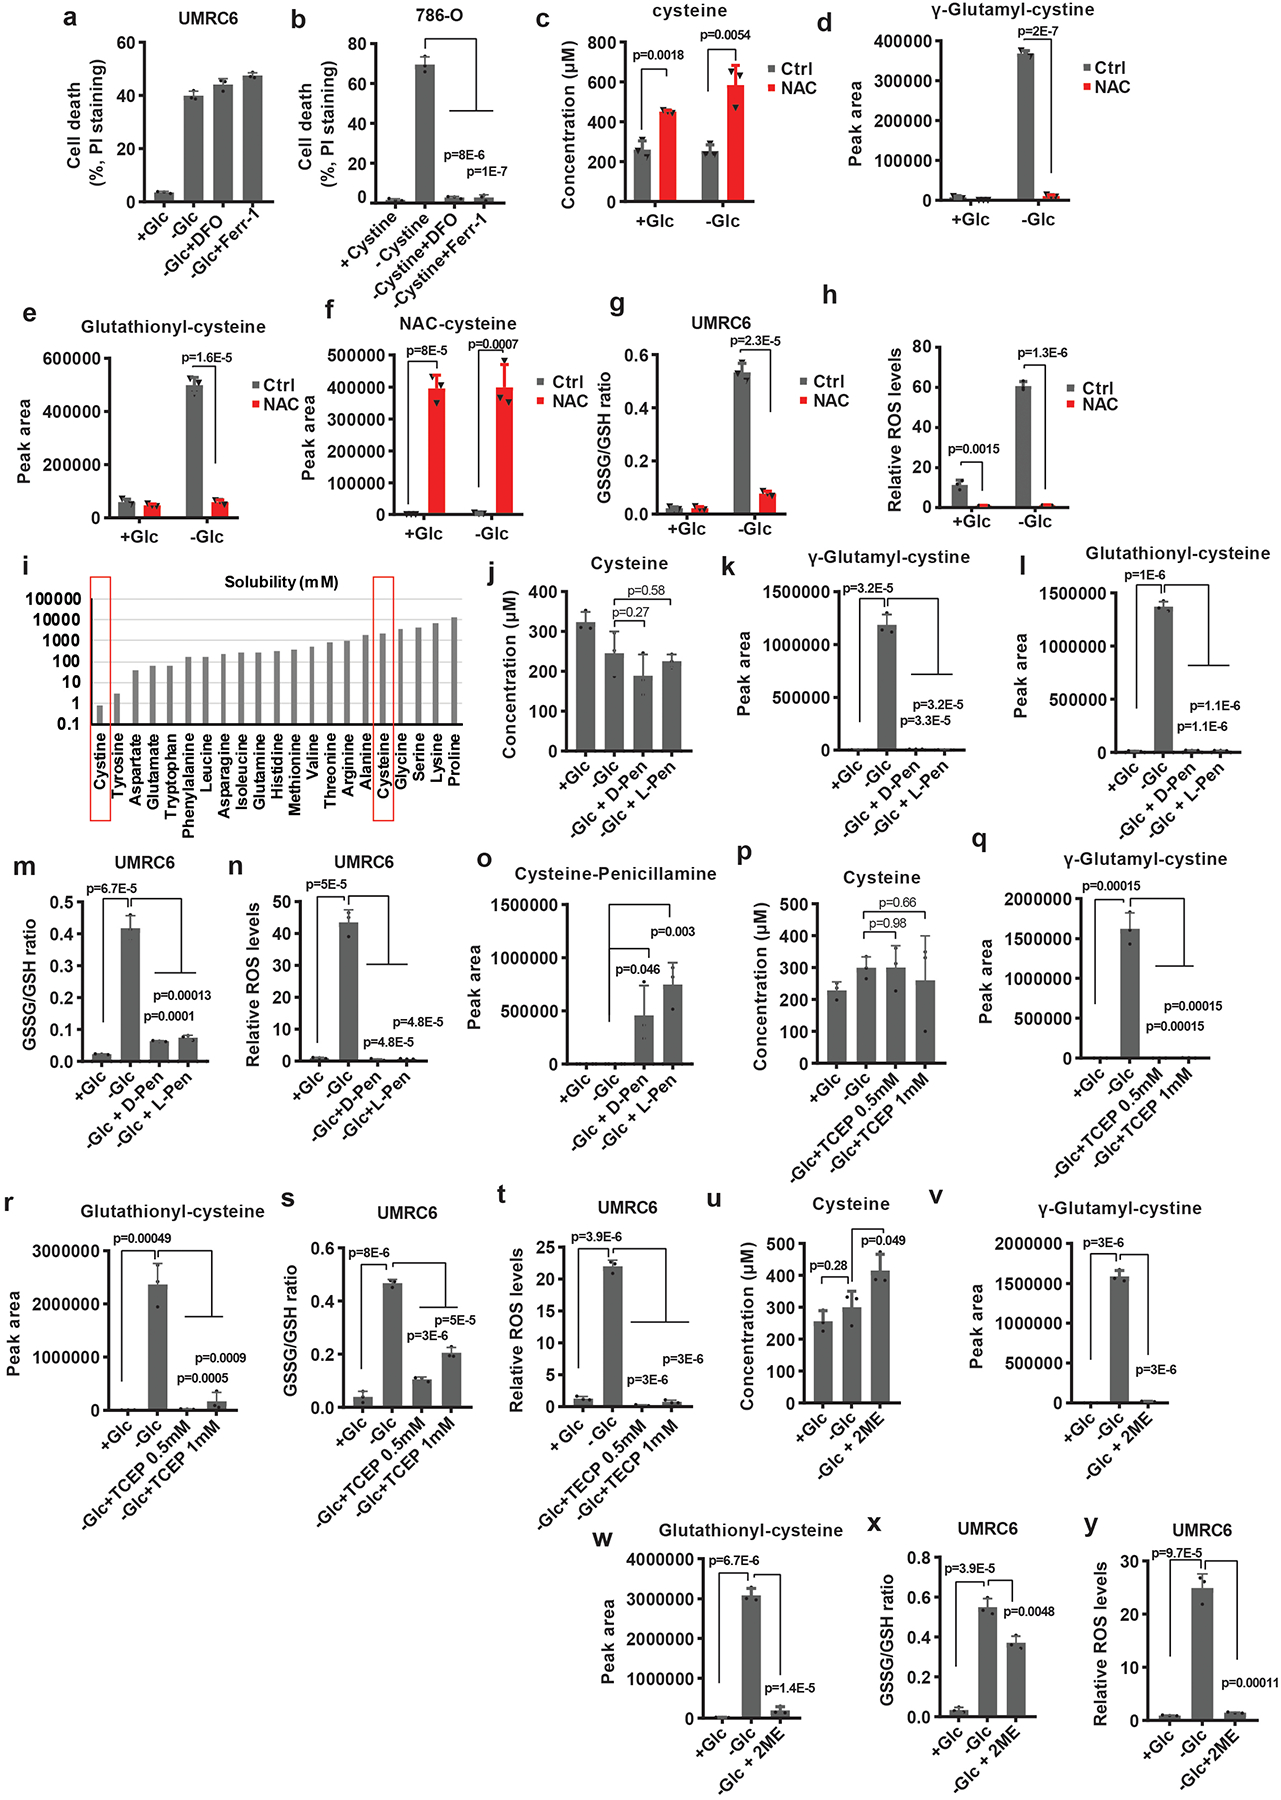
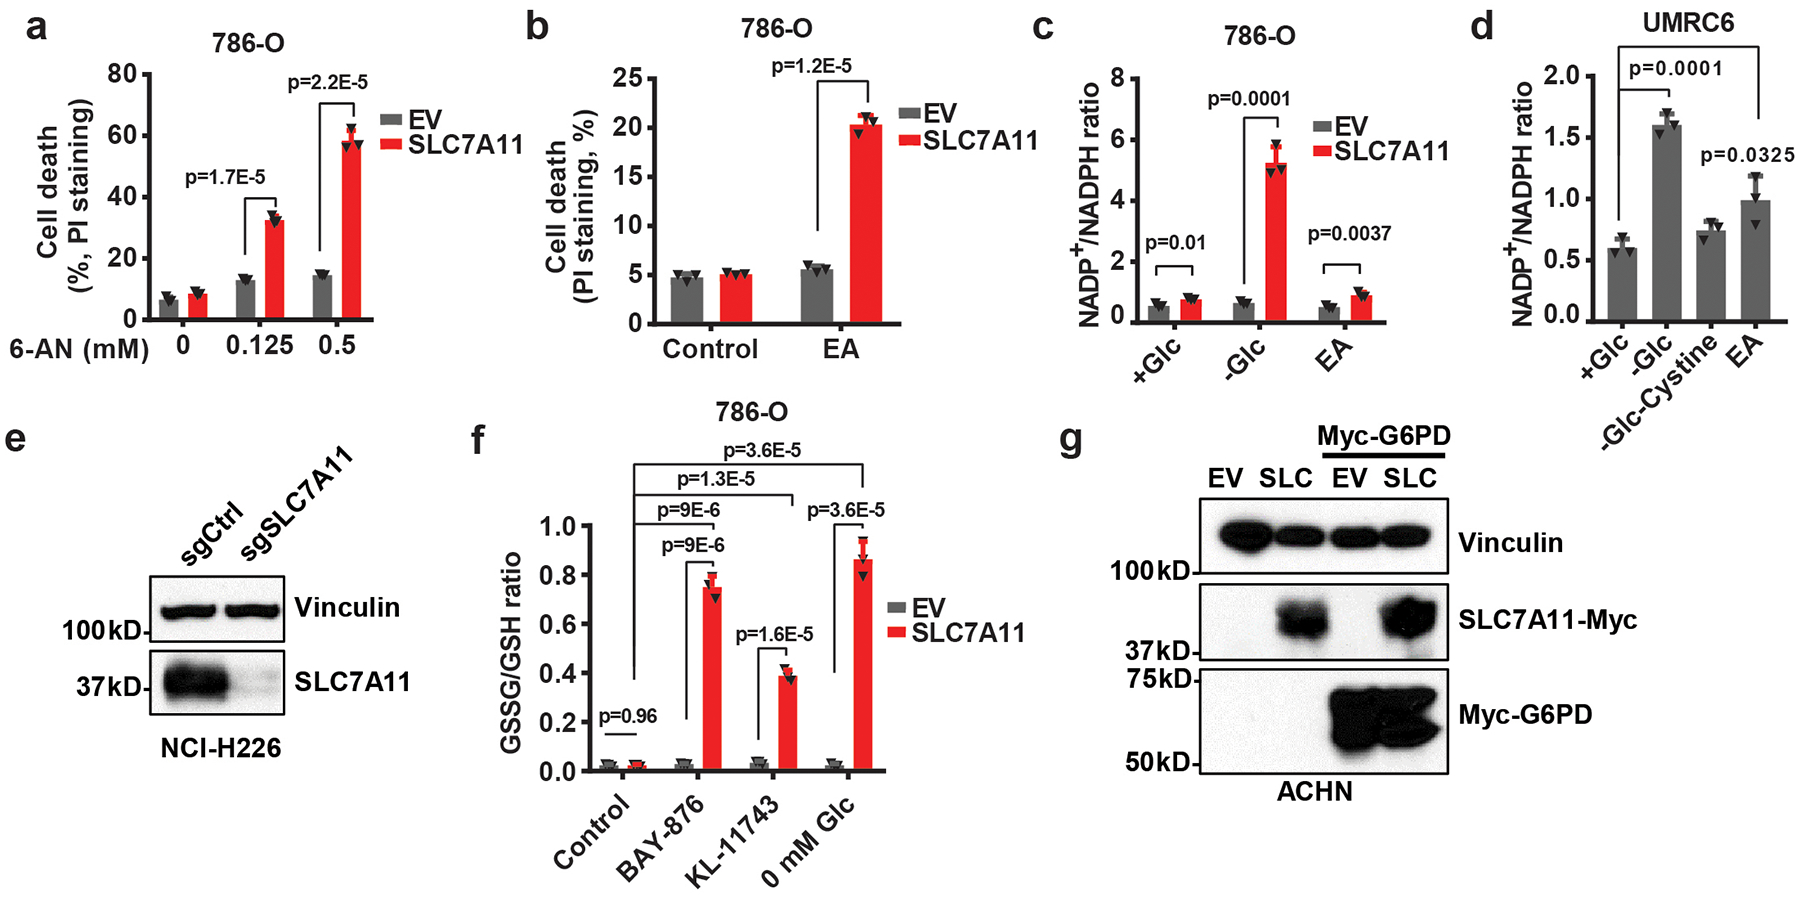
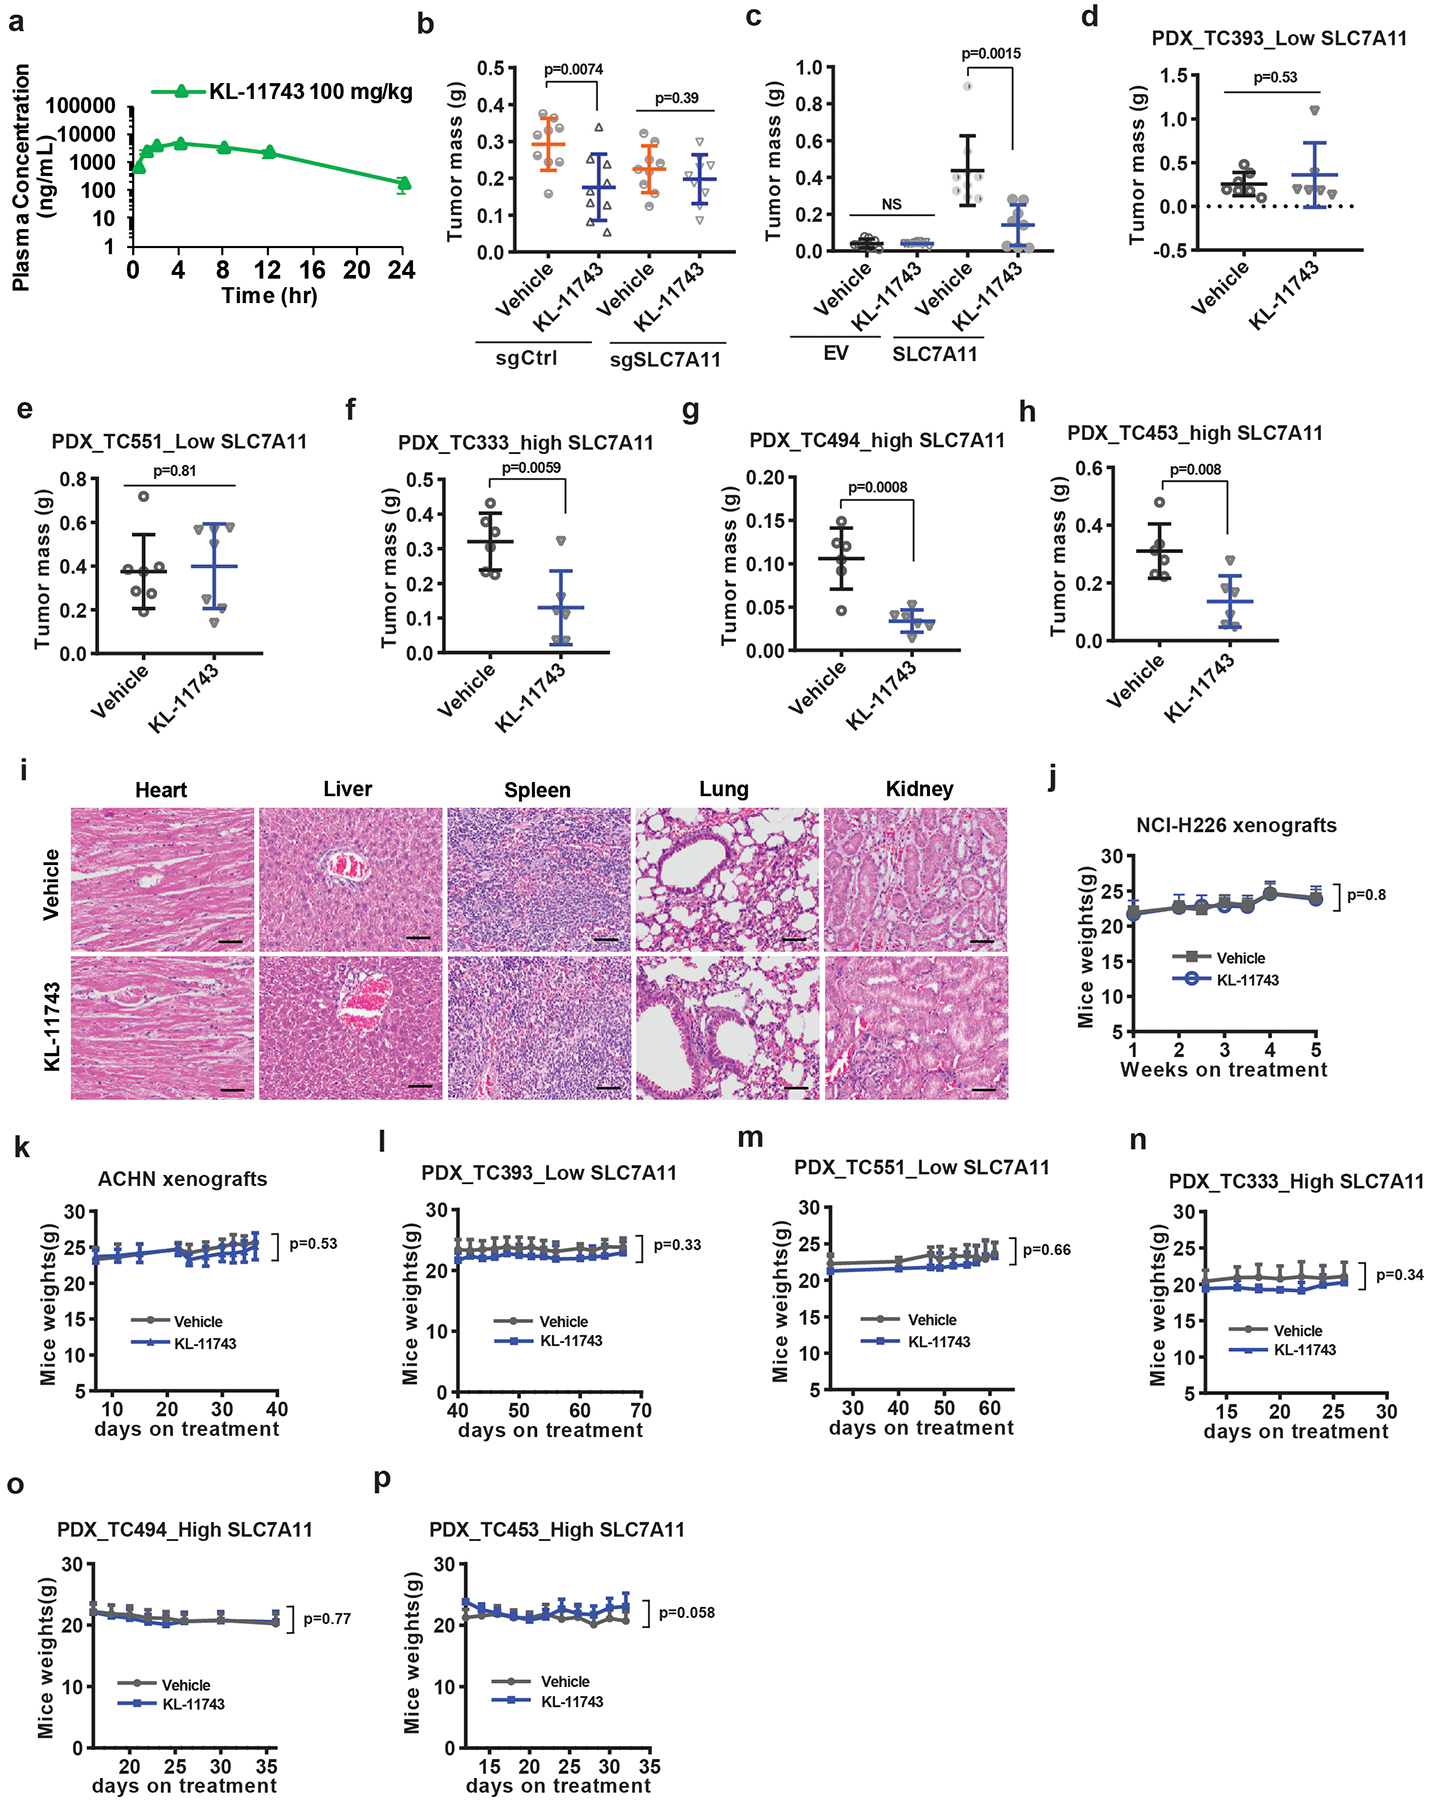
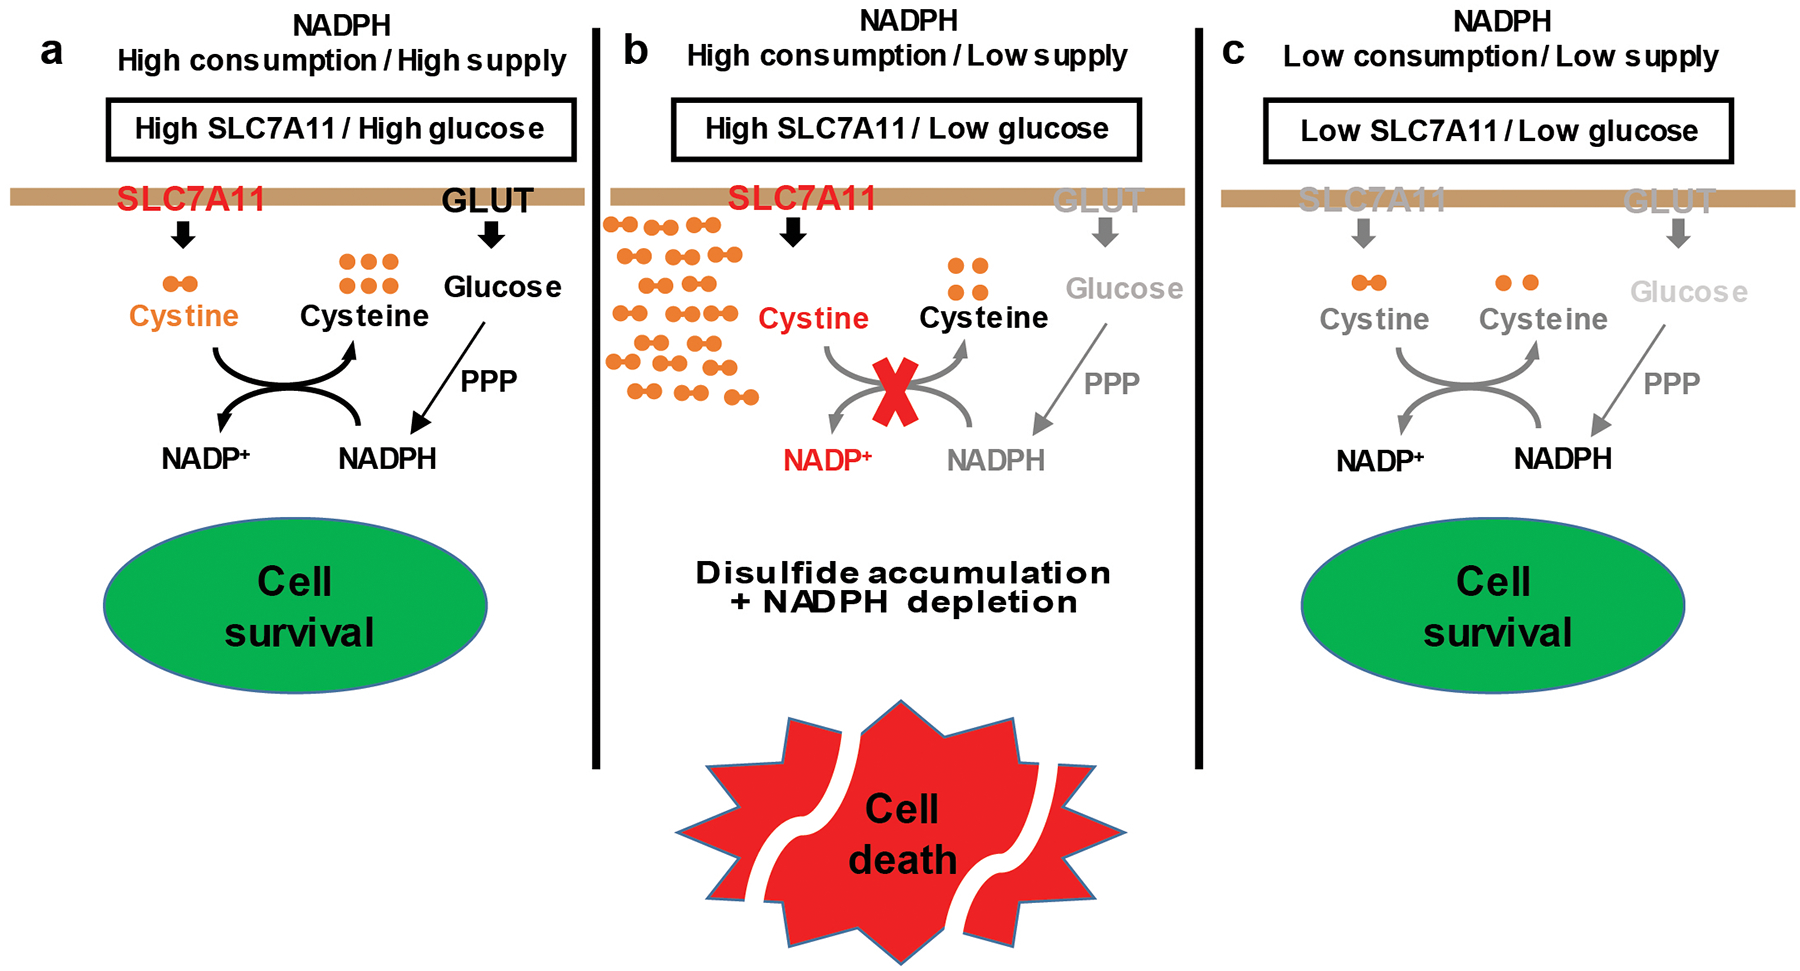
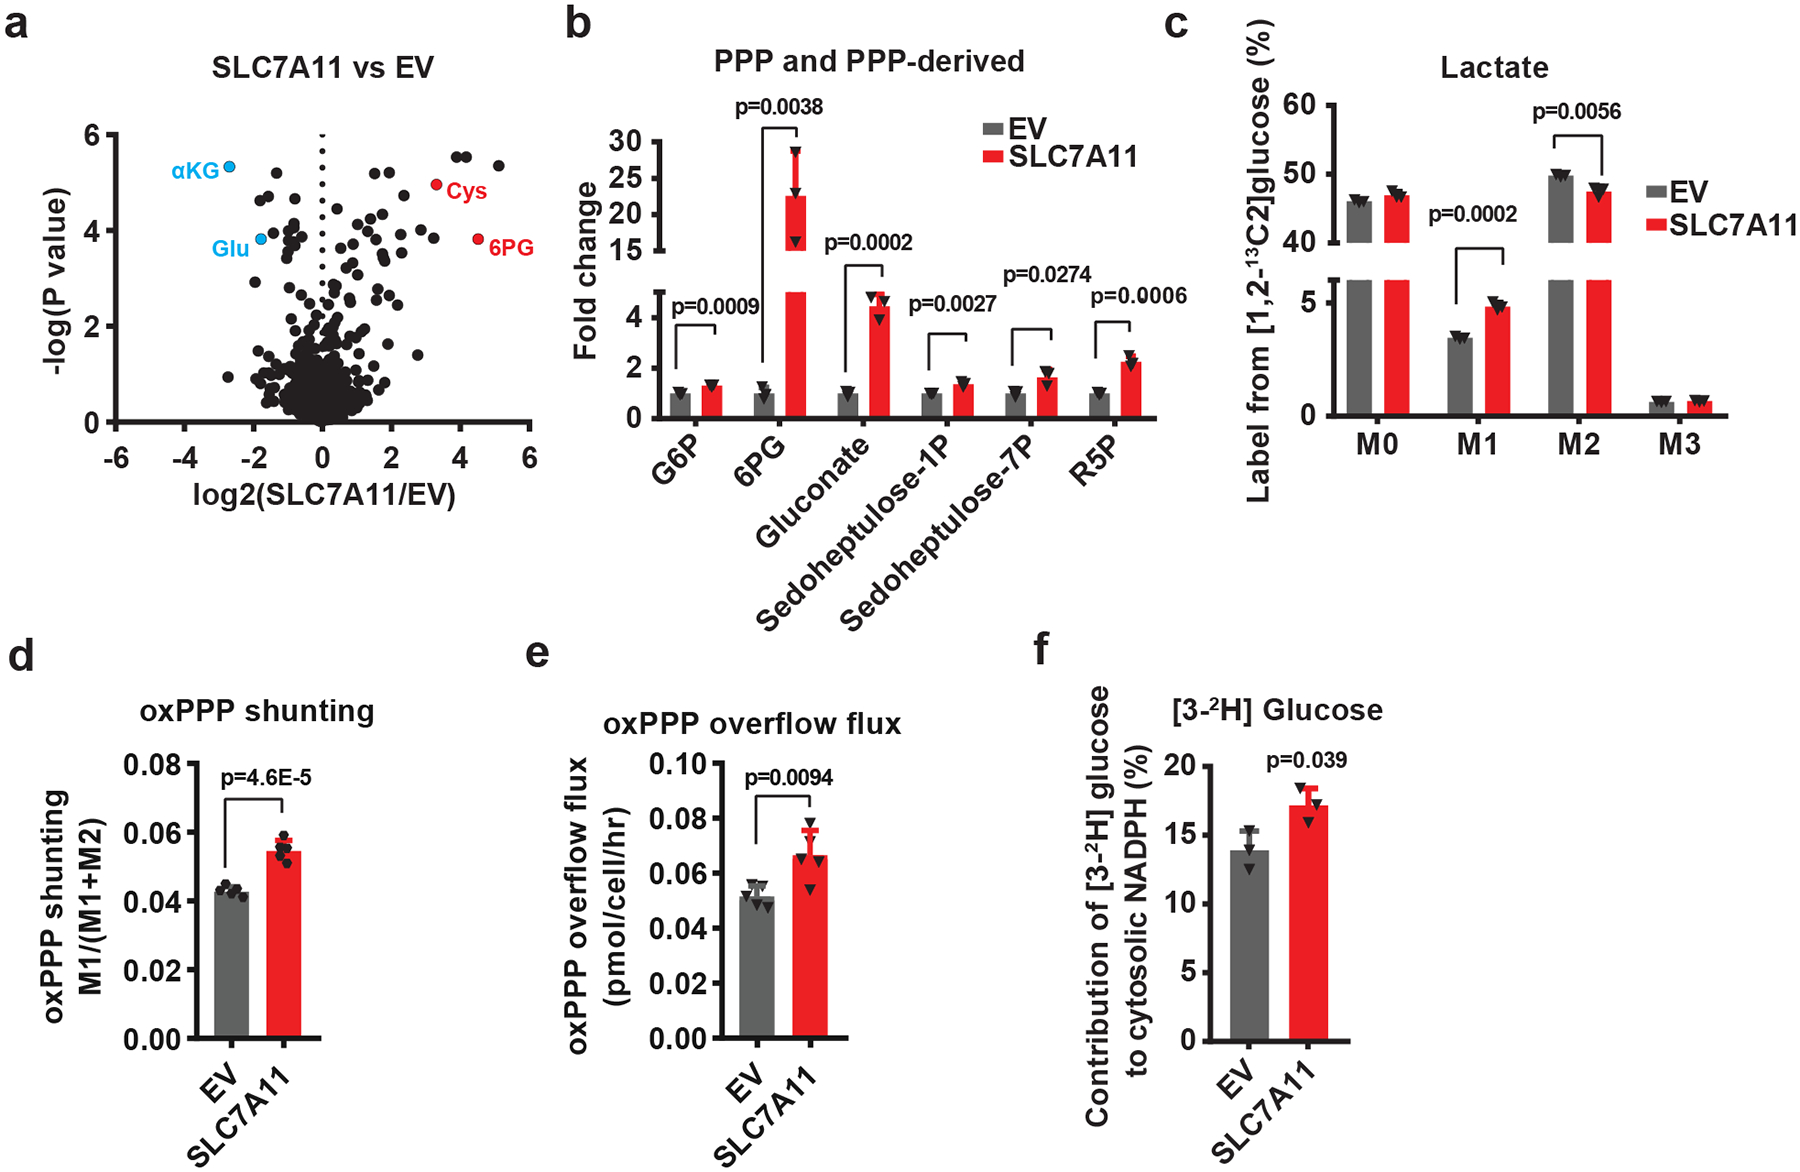
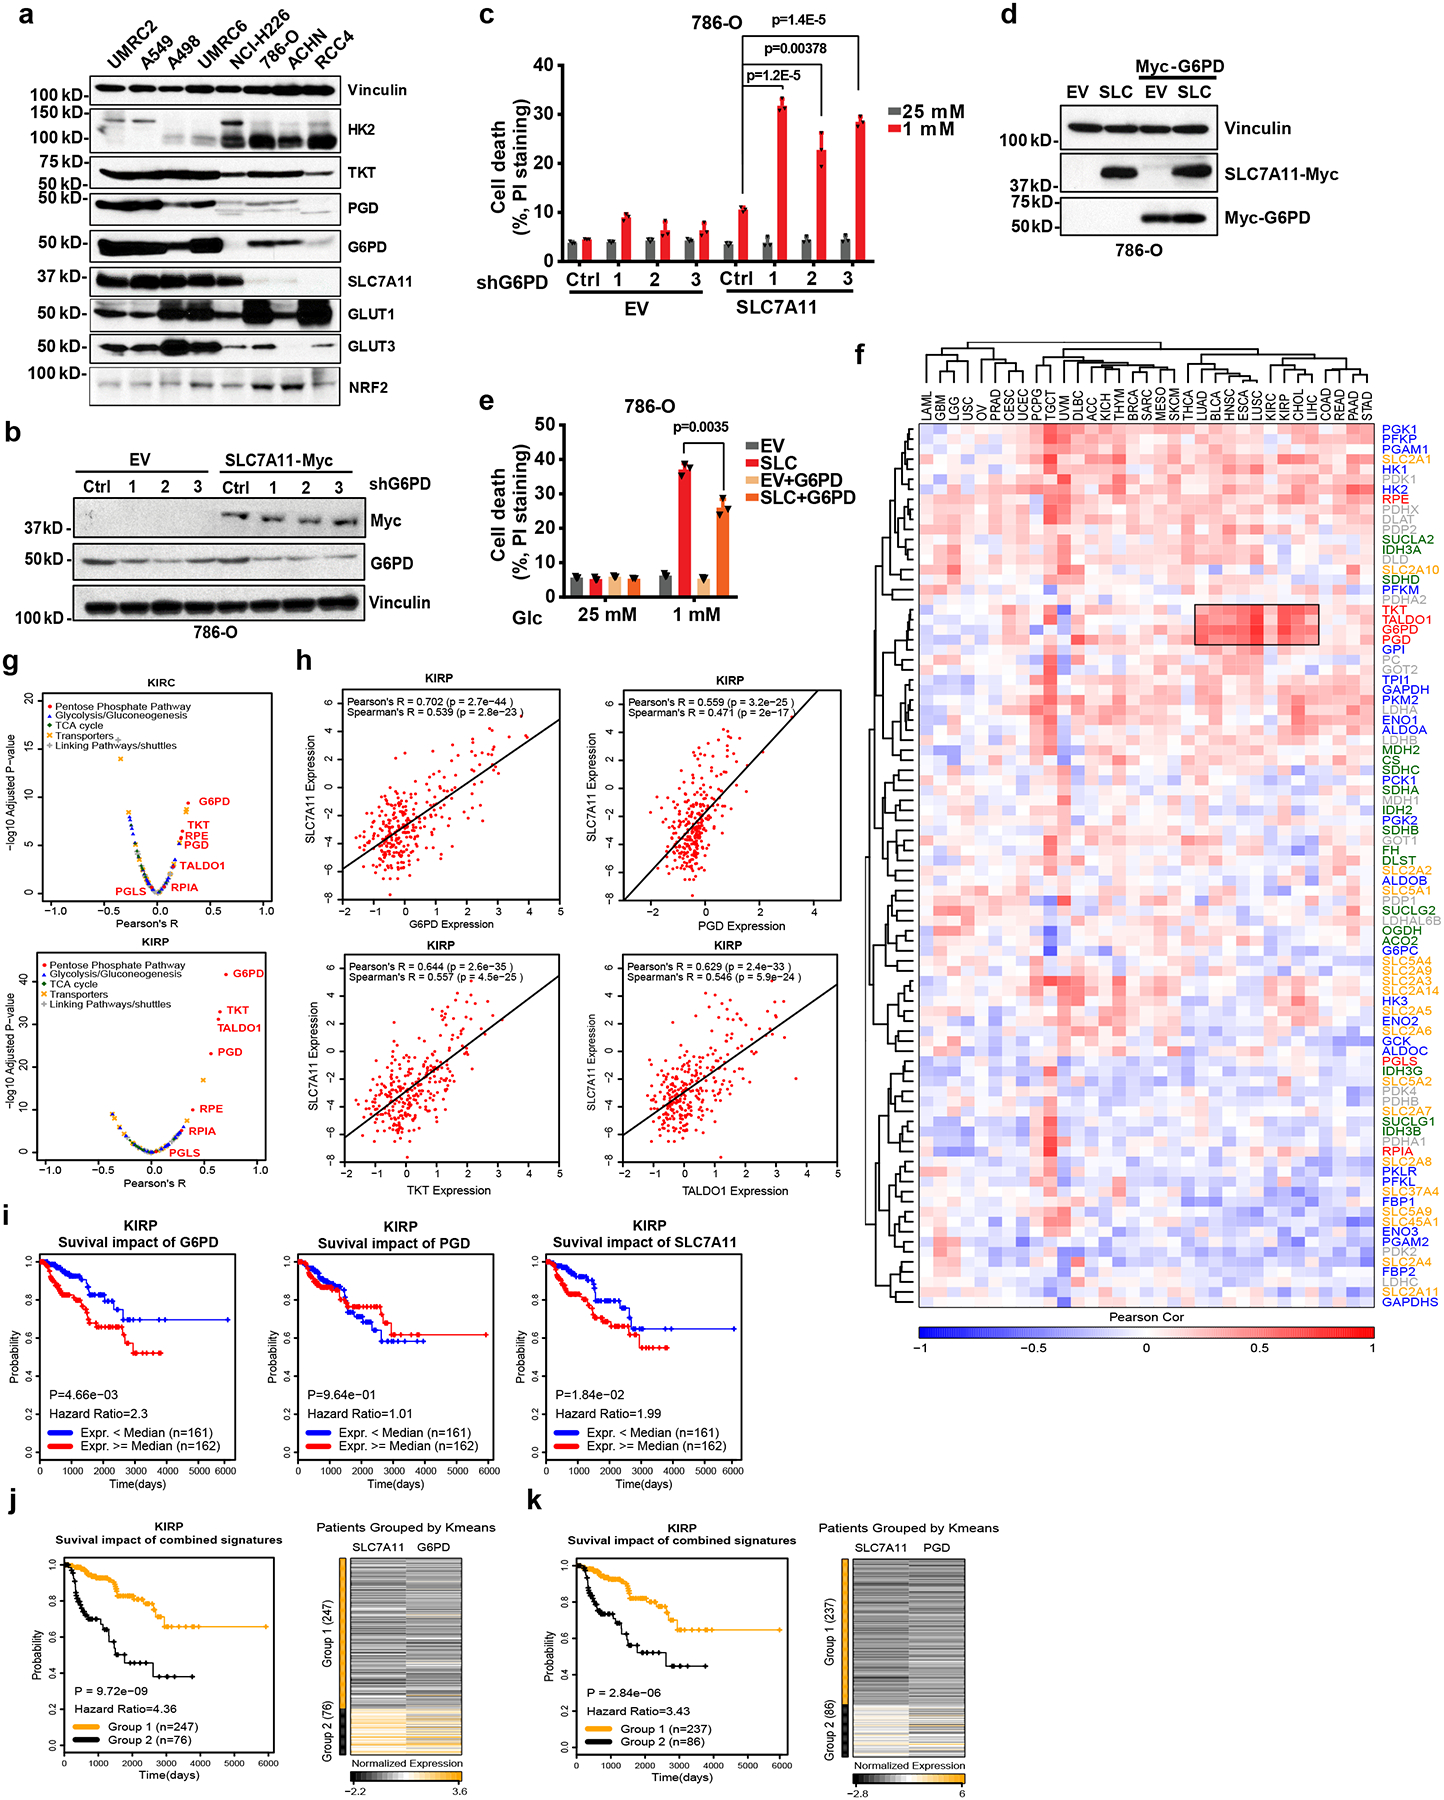
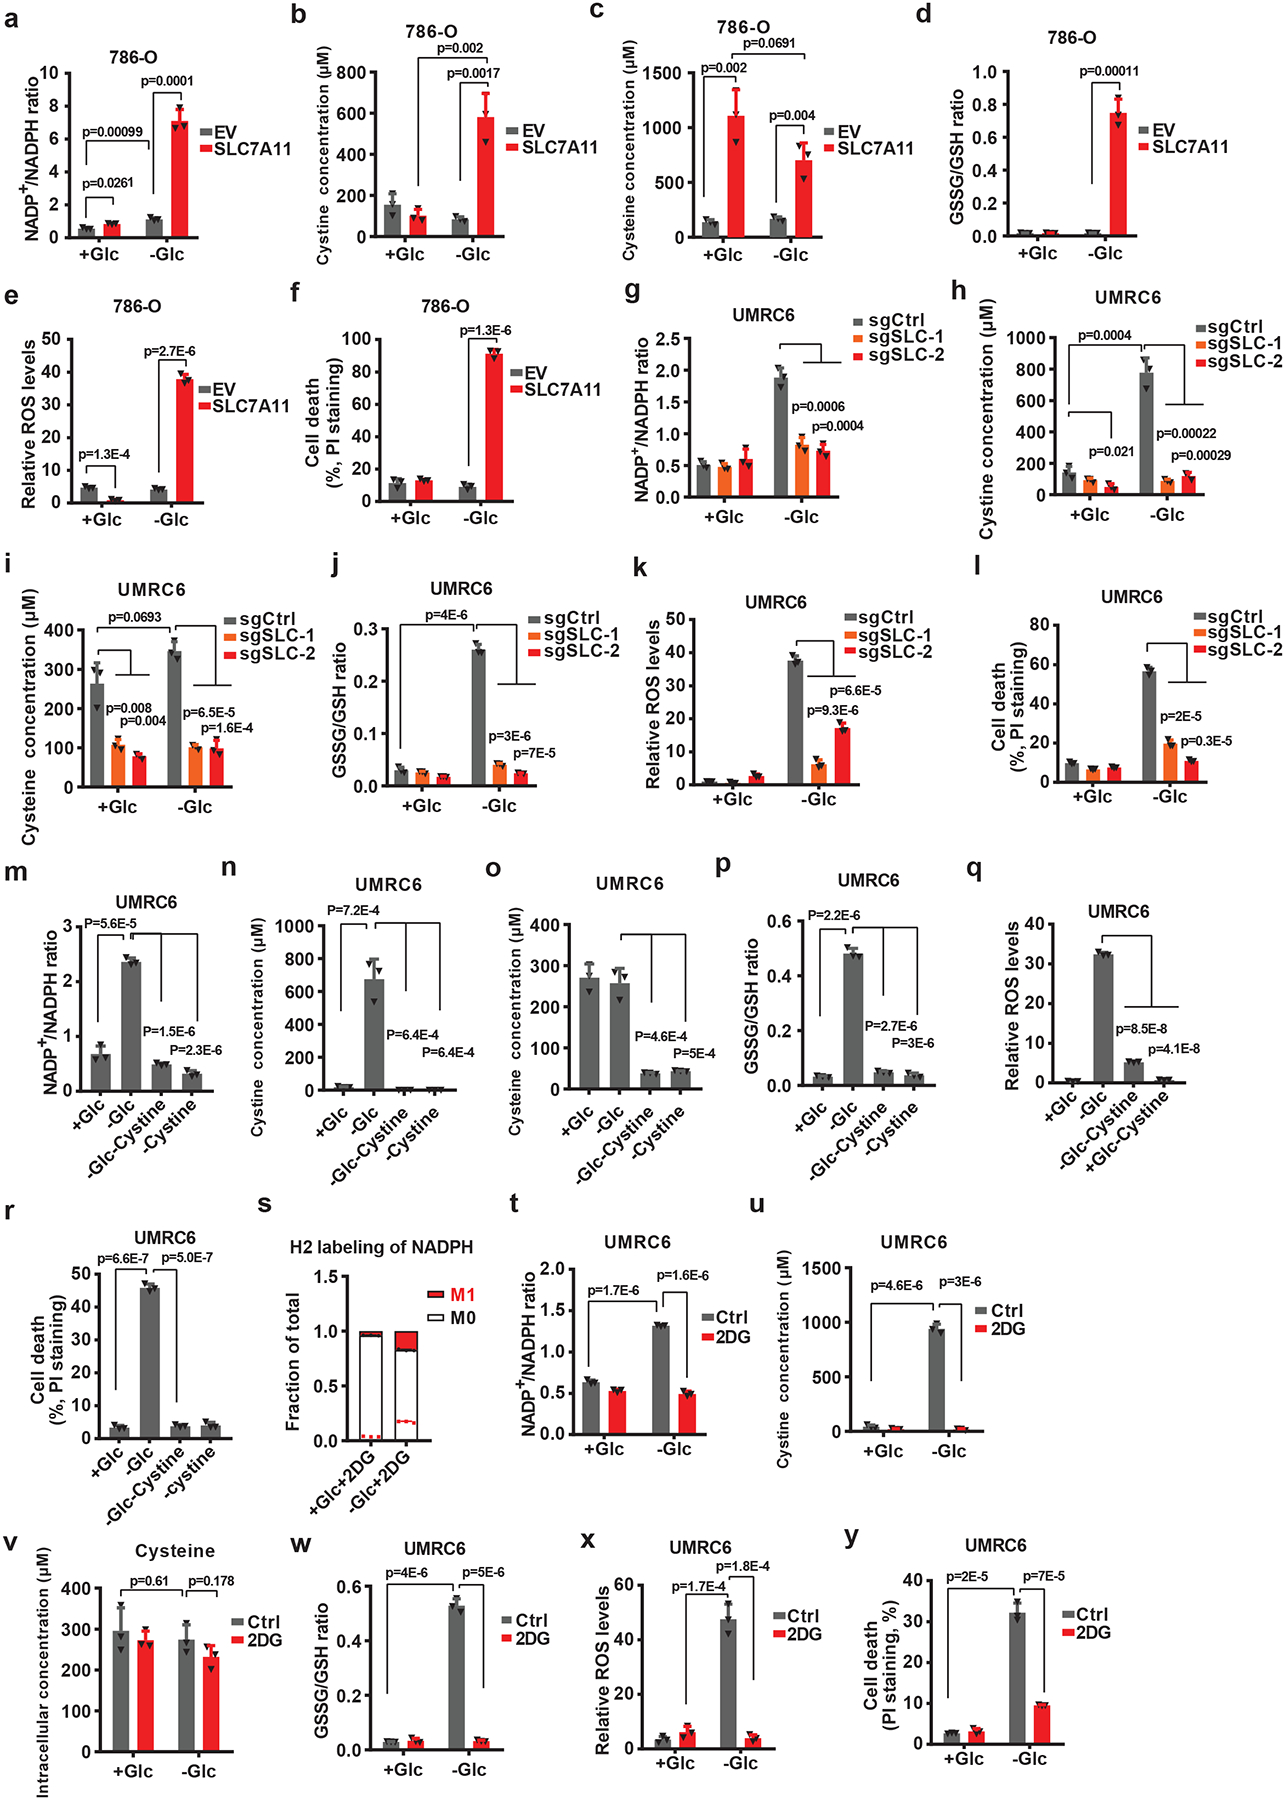
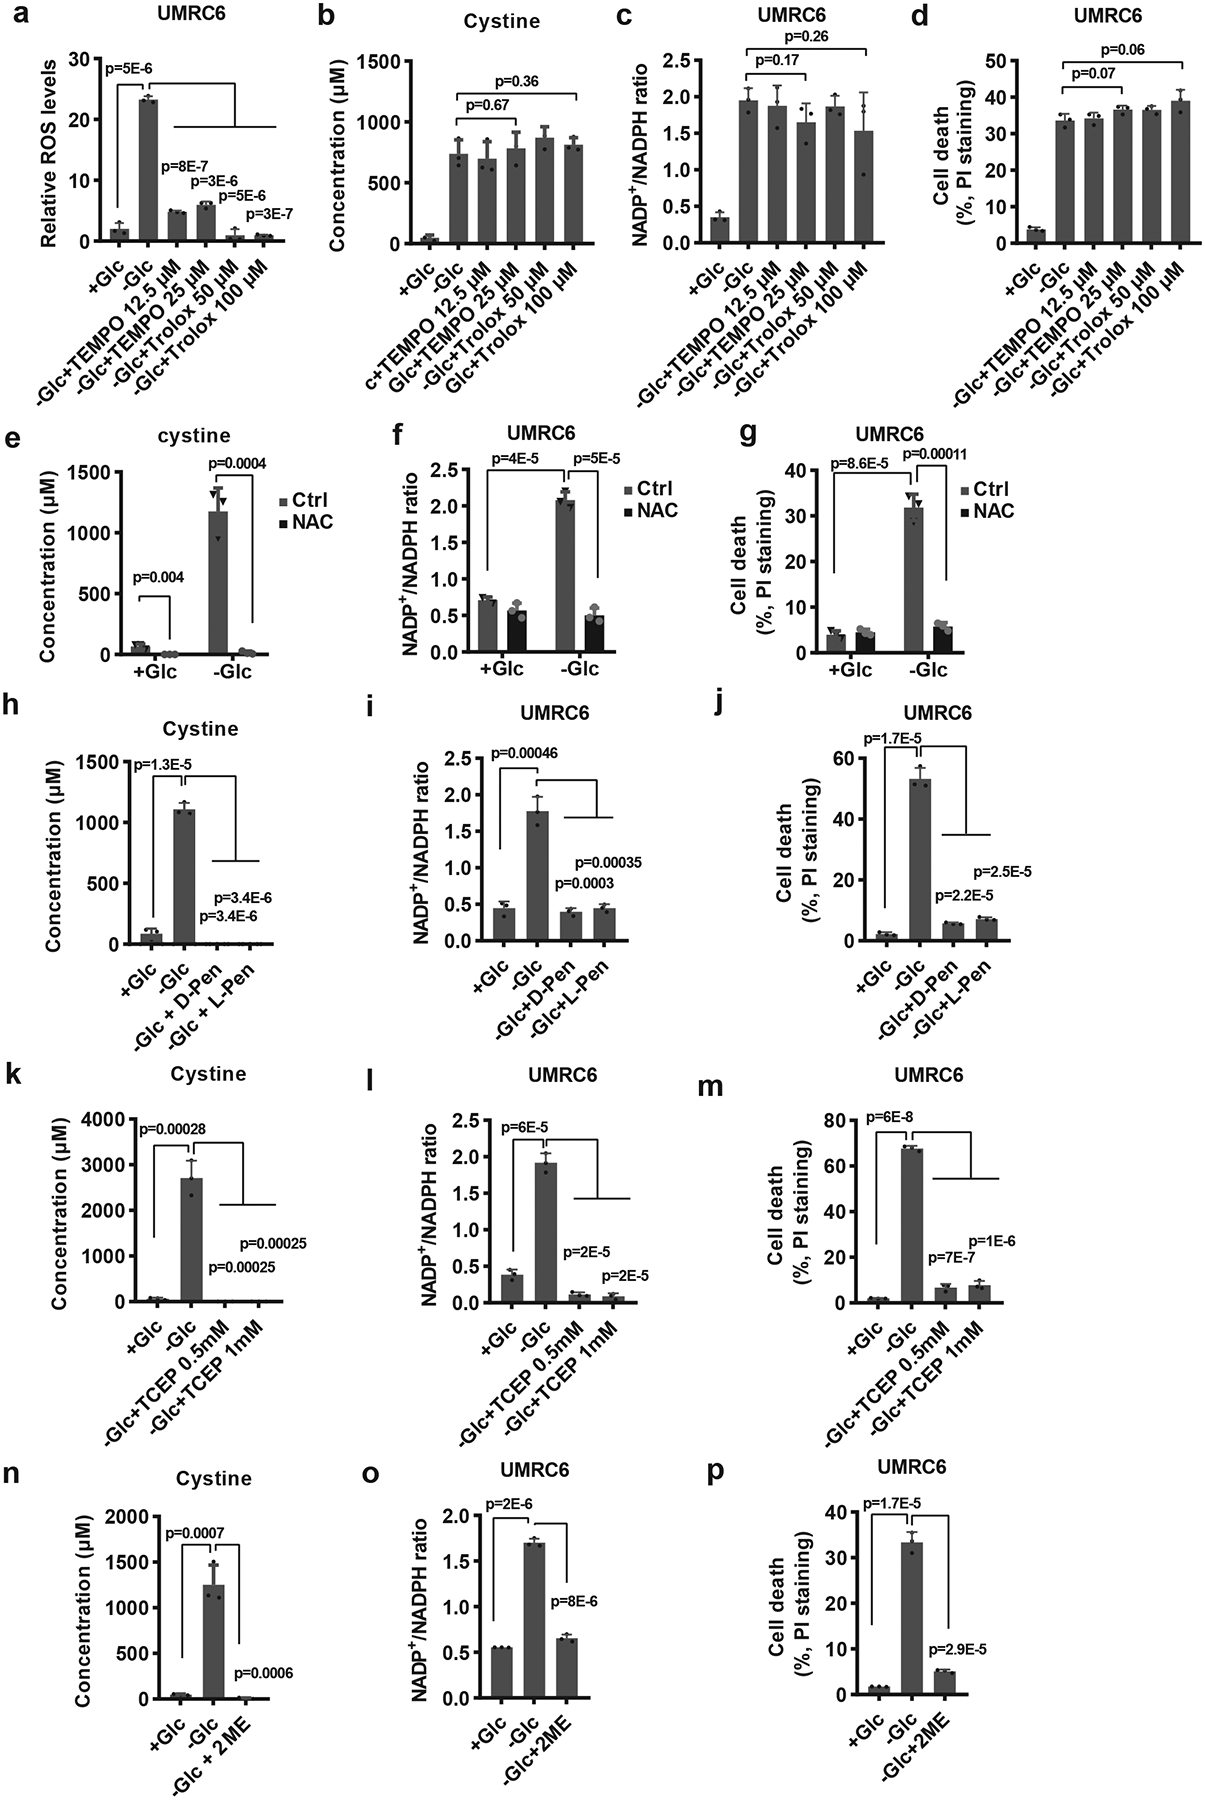
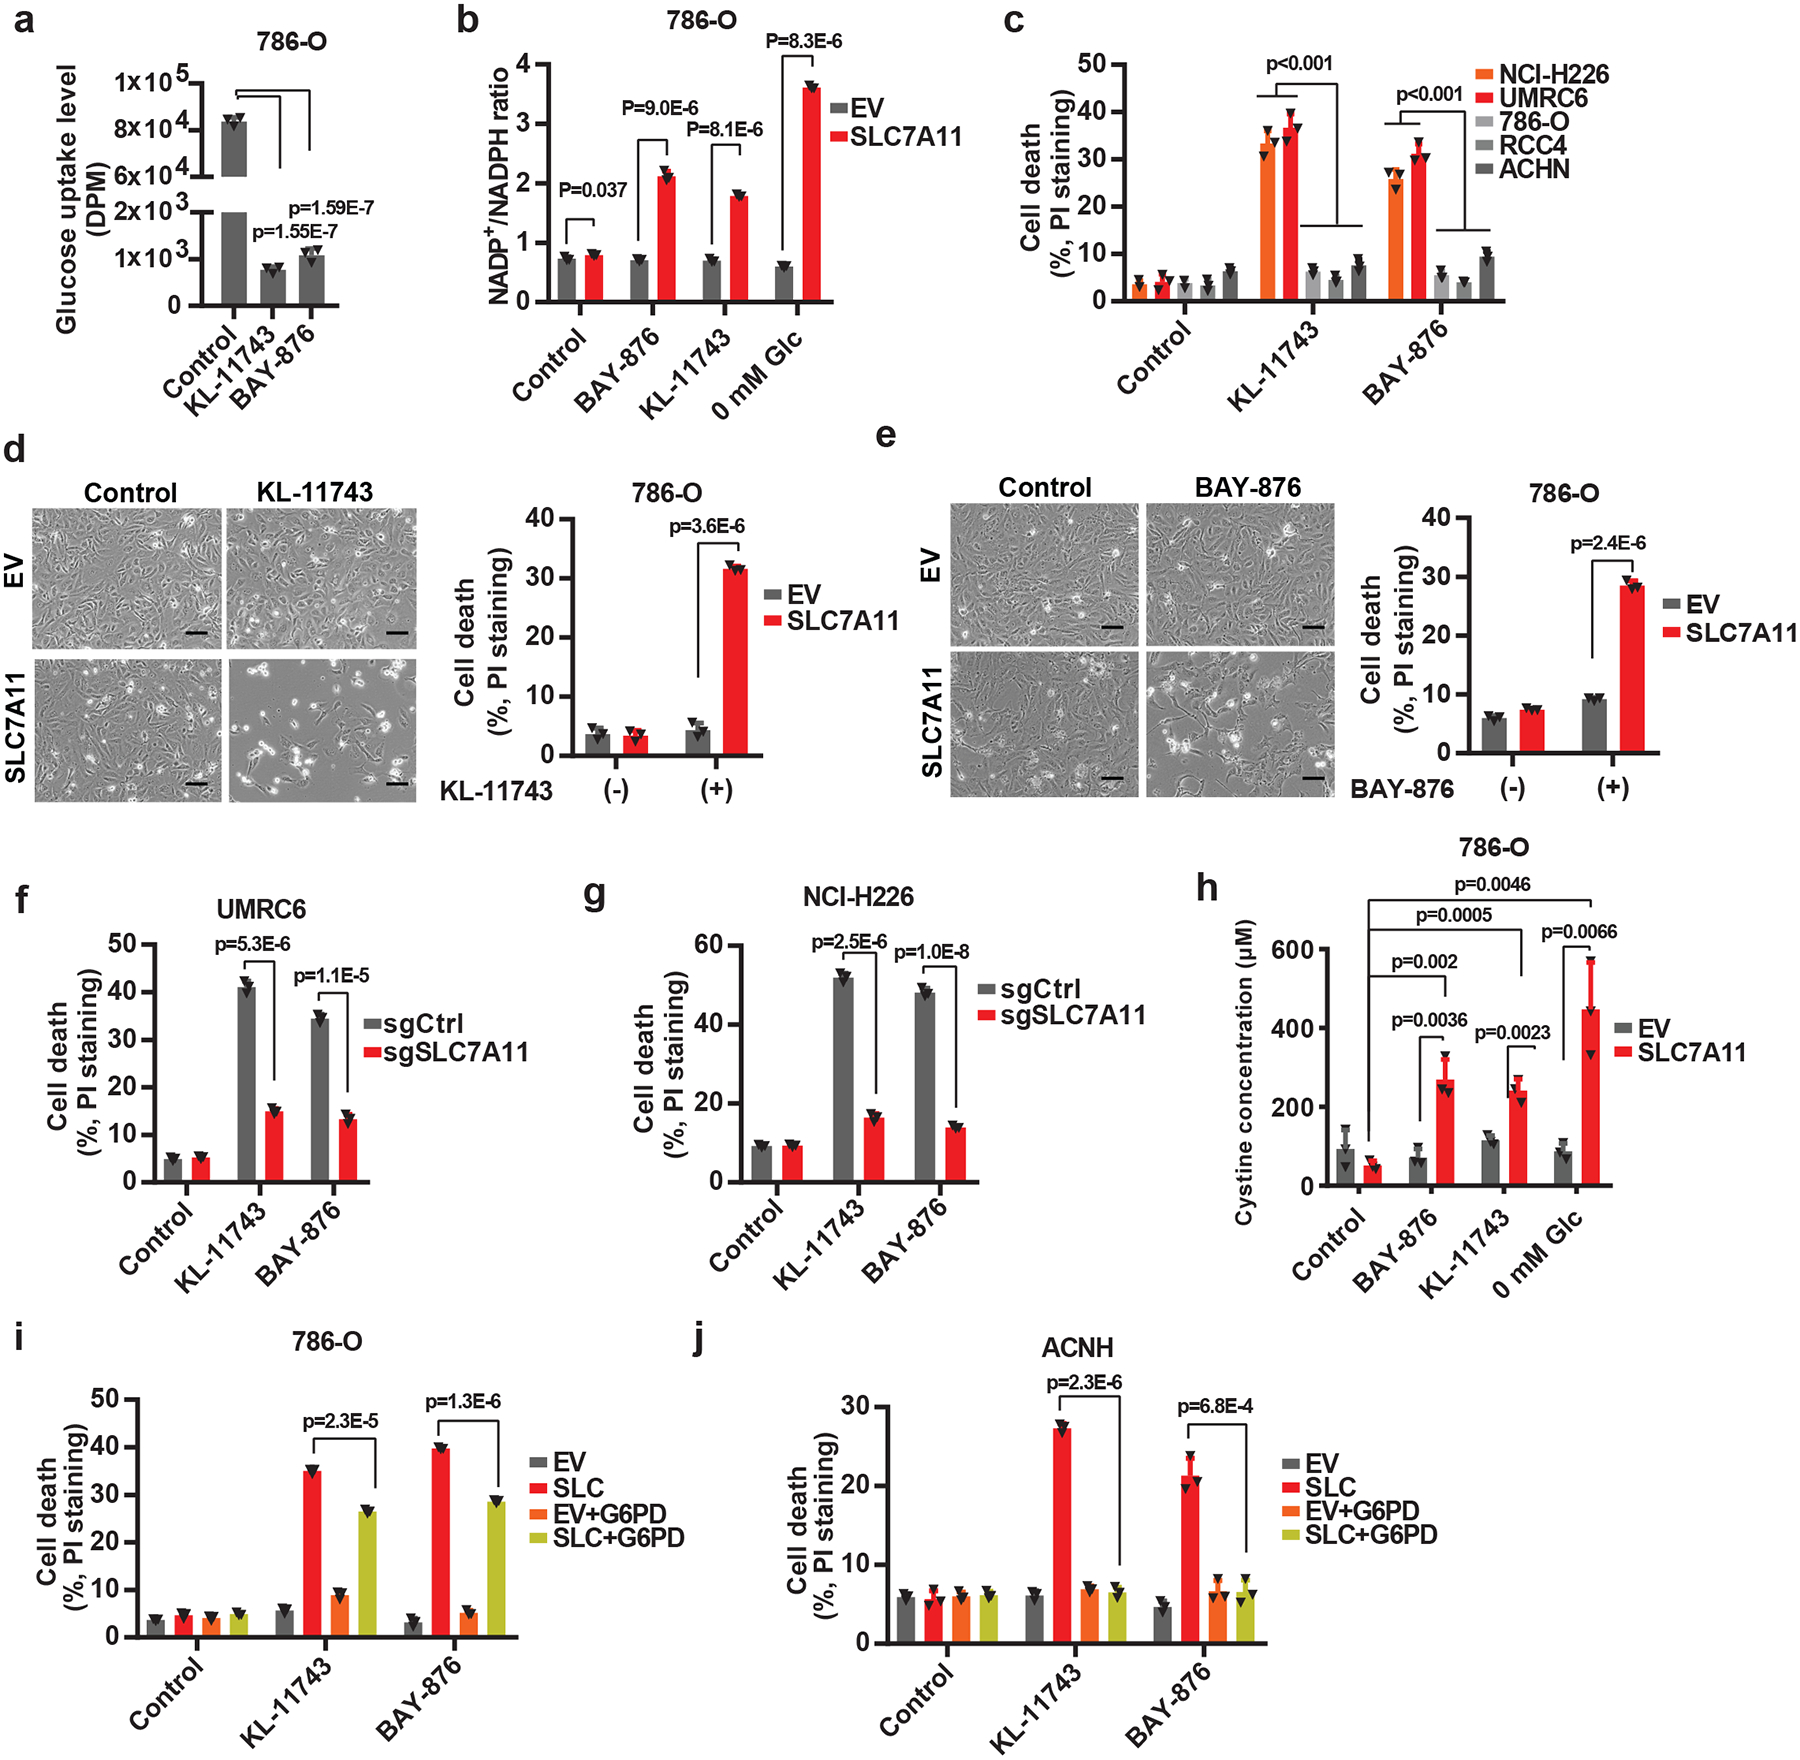
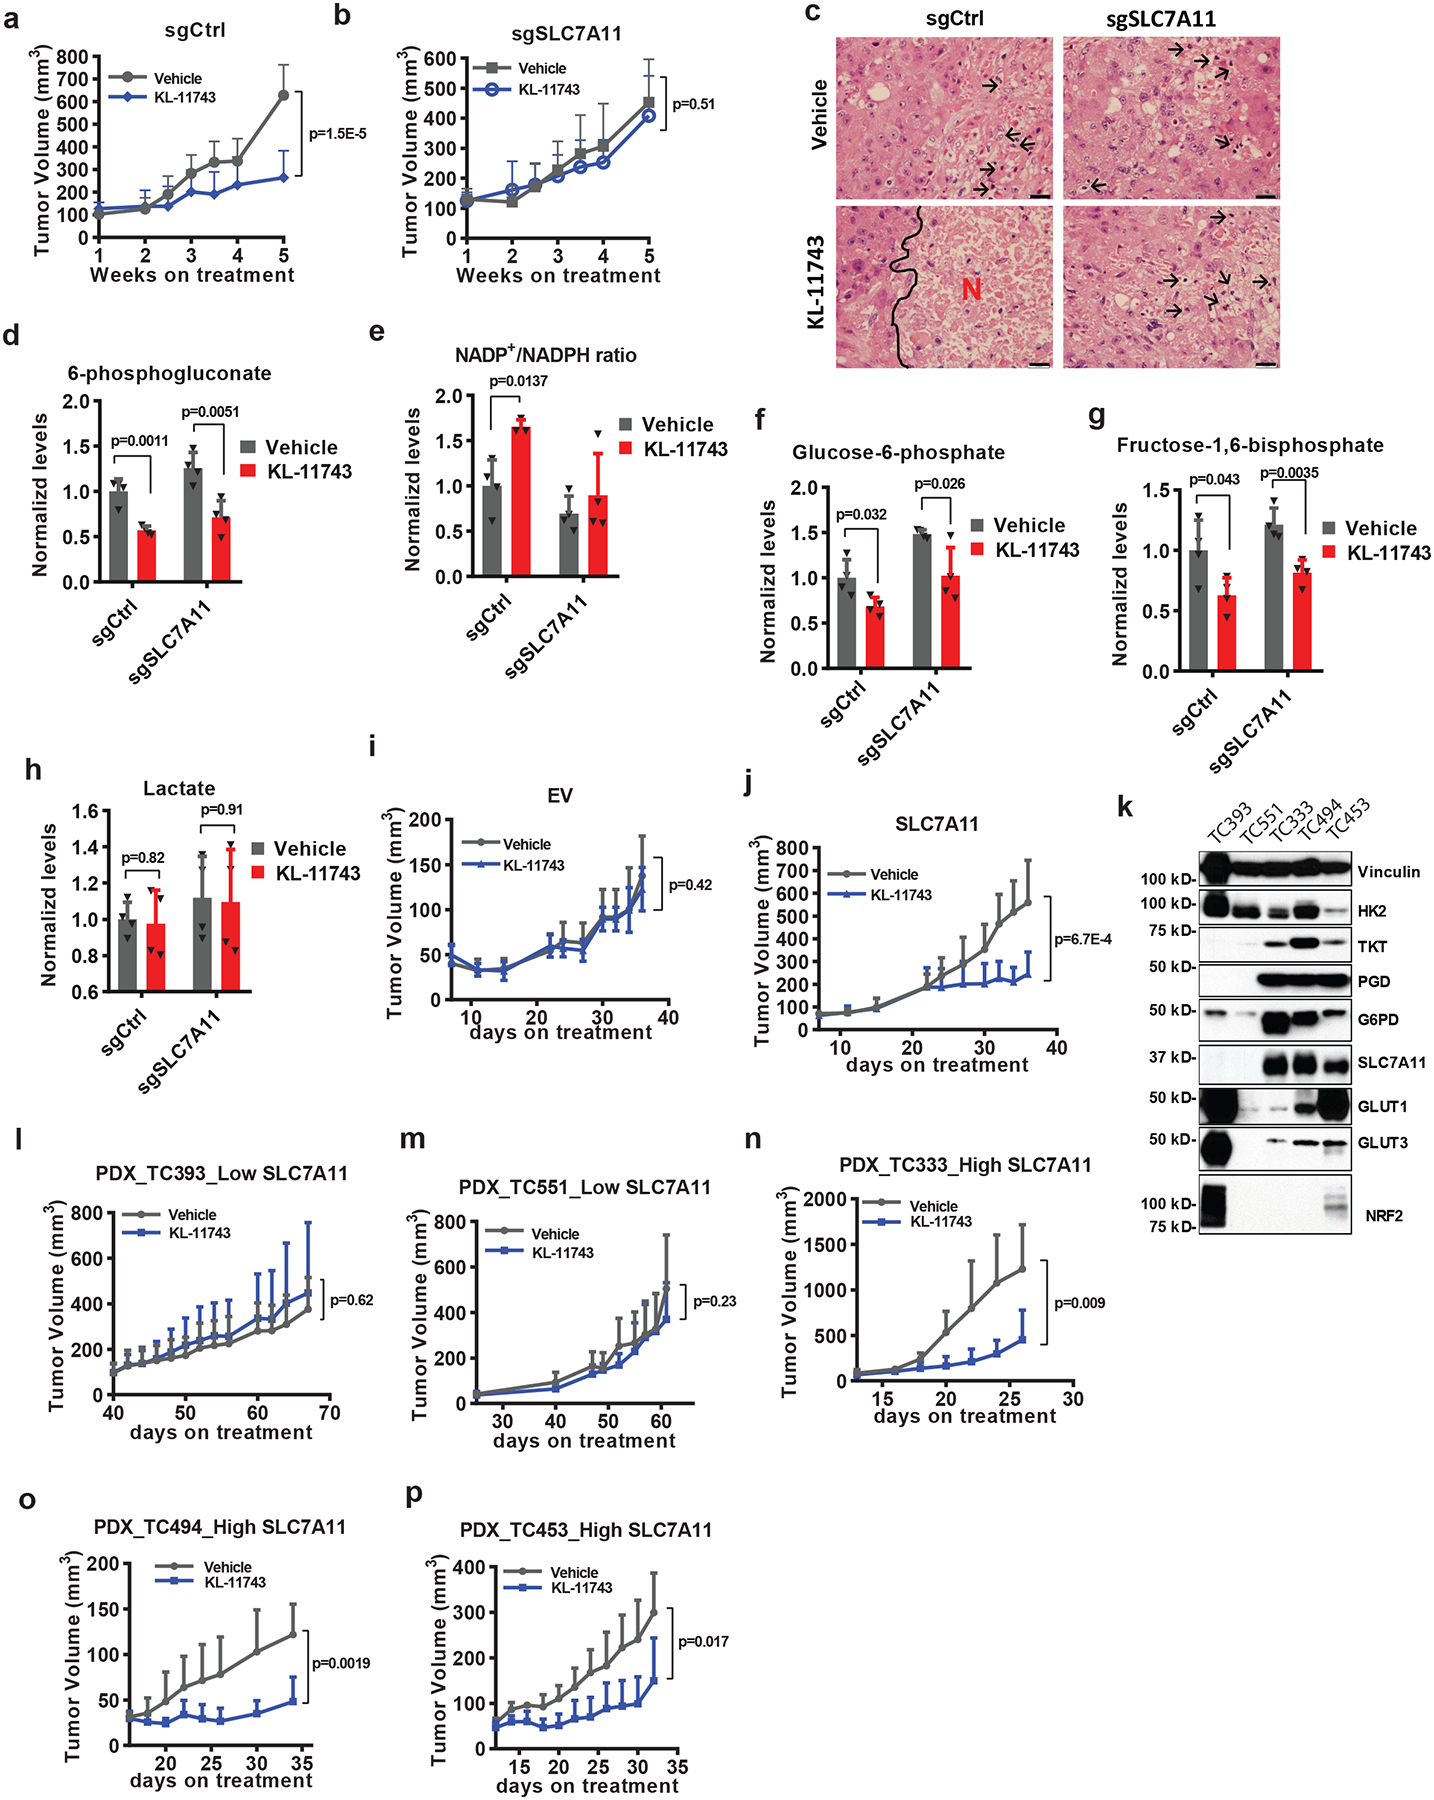
SLC7A11-mediated cystine uptake is critical for maintaining redox balance and cell survival. Here we show that this comes at a significant cost for cancer cells with high levels of SLC7A11. Actively importing cystine is potentially toxic due to its low solubility, forcing cancer cells with high levels of SLC7A11 (SLC7A11high) to constitutively reduce cystine to the more soluble cysteine. This presents a significant drain on the cellular NADPH pool and renders such cells dependent on the pentose phosphate pathway. Limiting glucose supply to SLC7A11high cancer cells results in marked accumulation of intracellular cystine, redox system collapse and rapid cell death, which can be rescued by treatments that prevent disulfide accumulation. We further show that inhibitors of glucose transporters selectively kill SLC7A11high cancer cells and suppress SLC7A11high tumour growth. Our results identify a coupling between SLC7A11-associated cystine metabolism and the pentose phosphate pathway, and uncover an accompanying metabolic vulnerability for therapeutic targeting in SLC7A11high cancers.


Conflict of interest statement

Competing Financial Interests

K.O. and M.V.P. are full-time employees of Kadmon Corporation, LLC. Other authors declare no competing financial interests.

Figures

Extended Data Fig. 1
Extended Data Fig. 1. The effect of SLC7A11 overexpression on glutamate, TCA cycle and glycolysis metabolites, and the expression levels of PPP enzymes
a, Western blotting showing Myc-tagged SLC7A11 expression in 786-O cells. The experiment was repeated five times, independently, with similar results. b, Bar graph showing relative fold changes of glutamate and TCA cycle metabolites in EV and SLC7A11-overexpressing 786-O cells. n=3 independent experiments. c, Western blotting showing indicated protein levels in EV and SLC7A11-overexpressing 786-O cells. The experiment was repeated twice, independently, with similar results. d, Bar graph showing relative fold changes of glycolysis metabolites in EV and SLC7A11-overexpressing 786-O cells. n=3 independent experiments. e,f, Bar graph showing the fold changes of PPP and PPP-derived intermediates induced by SLC7A11 overexpression in RCC4 or ACHN cells. n=3 independent experiments. g, Simplified schematic of glycolysis and the PPP, showing 13C labeling patterns resulting from 1,2-13C2 glucose. Red fills indicate 13C atoms. h, Glucose consumption rates in EV and SLC7A11-overexpressing 786-O cells. n=5 independent experiments. i, Simplified schematic showing the sequential transfer of deuterium labels at position 3 of glucose to NADPH and then newly synthesized palmitic acid. Red circles indicate positional deuterium labels. j, Newly synthesized deuterium labelled palmitate in EV and SLC7A11-overexpressing 786-O cells. n=3 independent experiments. In (j), data are plotted as mean ±95% confidence interval (CI). Other error bars are mean ± s.d.. All p values were calculated using two-tailed unpaired Student’s t-test. Detailed statistical tests are described in the Methods. Scanned images of unprocessed blots are shown in Source Data Extended Data Fig. 1. Numeral data are provided in Statistics Source Data Extended Data Fig. 1.
Extended Data Fig. 2
Extended Data Fig. 2. G6PD knockdown sensitizes cancer cells to glucose limitation and SLC7A11 expression correlates with PPP gene expression in human cancers
a, c, G6PD protein levels in control shRNA (shCtrl) and G6PD knockdown (shG6PD) UMRC6 (a) and A498 cells (c). The experiments were repeated twice, independently, with similar results. Scanned images of unprocessed blots are shown in Source Data Extended Data Fig. 2. b, d, Cell death analyzed by PI staining in indicated cells cultured in 25 or 1 mM glucose for 24 hours. Error bars are mean± s.d., n=3 independent experiments, p values were calculated using two-tailed unpaired Student’s t-test. e, Compared to other glucose metabolism genes, PPP genes show significant positive correlations with SLC7A11 in LUAD(n=514), BLCA(n=407), HNSC(n=520), CHOL(n=36), ESCA(n=184), LUSC(n=502), and LIHC(n=371). f, Scatter plots showing the correlations between SLC7A11 and 4 PPP genes (G6PD, PGD, TALDO1, and TKT) in KIRC(n=533), LUAD(n=514), and LUSC(n=502), respectively. g, Scatter plots showing the correlations between SLC7A11 and SLC2A1 in KIRP(n=290). h, Kaplan–Meier plots of KIRP patients stratified by SLC7A11 and SLC2A1 expression levels, respectively (left 2 panels); Kaplan–Meier plots of KIRP patients stratified by unsupervised clustering on SLC7A11 and SLC2A1 expression (right 2 panels). Group 1 has lower SLC7A11 and SLC2A1 expression, while Group 2 has higher SLC7A11 and SLC2A1 expression. Detailed statistical tests of b, d and f-h are described in the Methods.. Error bars are mean ± s.d, all bar graphs have 3 independent repeats. Numeral data are provided in Statistics Source Data Extended Data Fig. 2.
Extended Data Fig. 3
Extended Data Fig. 3. High expression of SLC7A11 promote disulfide stress, deplete NADPH and causes redox system collapse under glucose deprivation
a, Simplified schematic of how SLC7A11 can be linked to NADPH and the PPP. b, c, Measurement of intracellular GSSG (b) and GSH (c) concentrations in EV and SLC7A11-overexpressing 786-O cells cultured with (+Glc) or without glucose (-Glc). d, Diagrams illustrating the structures of γ-glutamylcysteine, γ-glutamyl-cystine, GSH, and glutathionyl-cysteine. Glu: glutamate; Gly: glycine; Cys: cysteine. e, f, The relative levels of intracellular γ-glutamyl-cystine (e) and glutathionyl-cysteine (f) in EV and SLC7A11-overexpressing 786-O cells cultured with (+Glc) or without glucose (-Glc). g, Representative phase-contrast images of indicated cells cultured with or without glucose. h, Western blotting analysis of SLC7A11 protein levels in the control (sgCtrl) and SLC7A11 knockout (sgSLC-1/2) UMRC6 cells. i-l, Measurement of intracellular GSSG (i) and GSH (j) concentrations and the relative levels of intracellular γ-glutamyl-cystine (k) and glutathionyl-cysteine (l) in control (sgCtrl) and SLC7A11 knockout (sgSLC-1/2) UMRC6 cells cultured with (+Glc) or without glucose (-Glc). m, Representative phase-contrast images of indicated cells cultured with (+Glc) or without glucose (-Glc). n, o, Cystine uptake levels in EV and SLC7A11- overexpressing 786-O cells (n) or UMRC6 cells (o) upon treatment with 1 mM sulfasalazine (SAS). p-u, Cell death with or without representative phase-contrast images (p, s), NADP+/NADPH ratios (q, t), and ROS levels (r, u) of EV and SLC7A11- overexpressing 786-O or UMRC6 cells cultured in glucose-containing or glucose free medium with or without treatment of 1 mM SAS. Error bars are mean ± s.d, all bar graphs have 3 independent repeats. All scale bars=100 μm. The experiment (g, h, m, p) was repeated twice, independently, with similar results. All p values were calculated using two-tailed unpaired Student’s t-test. Scanned images of unprocessed blots are shown in Source Data Extended Data Fig. 3. Numeral data are provided in Statistics Source Data Extended Data Fig. 3.
Extended Data Fig. 4
Extended Data Fig. 4. Cystine deprivation or 2DG reverses redox defects and prevents cell death upon glucose starvation
a-d, Measurement of intracellular GSSG (a) and GSH (b) concentrations, and the relative levels of intracellular γ-glutamyl-cystine (c) and glutathionyl-cysteine (d) in UMRC6 cells cultured with normal (+Glc), glucose free (-Glc), glucose/cystine double free (-Glc-Cystine), or cystine free (-Cystine) medium. e, f, Measurement of NADP+/NADPH ratios (e), and ROS levels (f) in EV and SLC7A11-overexpressing 786-O cells cultured with indicated medium. g-i, Representative phase-contrast images and cell death of indicated cells cultured with indicated medium. j, k, Diagrams illustrating the structure (j) and metabolism (k) of glucose and 2DG. l-n, The relative levels of intracellular 2-deoxyglucose-6-phosphate (l), 2-deoxy-6-phosphogluconolactone (m) and 2-deoxy-6-phosphogluconate (n) in UMRC6 cells cultured in glucose-containing or glucose free medium with or without treatment of 2 mM 2DG. o-r, Measurement of intracellular GSSG (o) and GSH (p) concentrations, and the relative levels of intracellular γ-glutamyl-cystine (q) and glutathionyl-cysteine (r) in UMRC6 cells cultured in glucose-containing or glucose free medium with or without treatment of 2 mM 2DG. s, Representative phase-contrast images of UMRC6 cells cultured in glucose-containing or glucose free medium with or without treatment of 2 mM 2DG. t-w, Measurement of NADP+/NADPH ratios (t), ROS levels (u), cell death (v) and the representative phase-contrast images (w) of EV and SLC7A11-overexpressing 786-O cells cultured in glucose-containing or glucose-free medium with or without treatment of 2 mM 2DG. The experiments (g, h, i, s, w) were repeated twice, independently, with similar results. All error bars are mean± s.d., n=3 independent experiments. All scale bars=100 μm. All p values were calculated using two-tailed unpaired Student’s t-test. Numeral data are provided in Statistics Source Data Extended Data Fig. 4.
Extended Data Fig. 5
Extended Data Fig. 5. Preventing disulfide but not ROS accumulation rescues redox defects and cell death in SLC7A11-overexpressing cells under glucose starvation
a, b, Measurement of cell death of UMRC6 or 786-O cells cultured in glucose-containing, glucose-free medium or cystine-free medium with or without treatment of 100 μM DFO or 10 μM Ferrostatin-1. c-h, Measurement intracellular levels of cysteine (c), the relative levels of intracellular γ-glutamyl-cystine (d), glutathionyl-cysteine (e), NAC-cysteine (f), GSSG/GSH ratio (g) and ROS levels (h) of UMRC6 cells cultured in glucose-containing or glucose-free medium with or without treatment of 2 mM NAC. i, The solubility of different amino acids. j-n, Measurement intracellular levels of cysteine (j), the relative levels of intracellular γ-glutamyl-cystine (k), glutathionyl-cysteine (l), GSSG/GSH ratio (m) and ROS levels (n) of UMRC6 cells cultured in glucose-containing or glucose-free medium with or without treatment of TCEP. o-t, Measurement intracellular levels of cysteine (o), the relative levels of intracellular γ-glutamyl-cystine (p), glutathionyl-cysteine (q), GSSG/GSH ratio (r), ROS levels (s) and Cysteine-penicillamine (t) of UMRC6 cells cultured in glucose-containing or glucose-free medium with or without treatment of 2 mM D-Penicillamine or L-Penicillamine. u-y, Measurement intracellular levels of cysteine (u), the relative levels of intracellular γ-glutamyl-cystine (v), glutathionyl-cysteine (w), GSSG/GSH ratio (x) and ROS levels (y) of UMRC6 cells cultured in glucose-containing or glucose-free medium with or without treatment of 1 mM 2ME. Except i, all other error bars are mean± s.d., n=3 independent experiments. All p values were calculated using two-tailed unpaired Student’s t-test. Detailed statistical tests are described in the Methods. Numeral data are provided in Statistics Source Data Extended Data Fig. 5.
Extended Data Fig. 6
Extended Data Fig. 6. Cancer cells with high SLC7A11 expression are sensitive to GLUT inhibition
a, Cell death of EV and SLC7A11- overexpressing 786-O cells treated with 0.125–0.5 mM 6-AN. b, Cell death of EV and SLC7A11- overexpressing 786-O cells treated with 0.1 mM epiandrosterone (EA). c, Quantification of NADP+/NADPH ratios in EV and SLC7A11- overexpressing 786-O cells treated with normal (+Glc), glucose free (-Glc) medium, or normal medium containing 0.1 mM EA. d, Quantification of NADP+/NADPH ratios in UMRC6 cells treated with normal (+Glc), glucose free (-Glc), glucose/cystine double free medium (-Glc-Cystine), or normal medium containing 0.1 mM EA. e, SLC7A11 protein levels in control (sgCtrl) and SLC7A11 knockout (sgSLC7A11) NCI-H226 cells were measured by western blotting. The experiment was repeated twice, independently, with similar results. f, Measurement of GSSG/GSH ratios in EV and SLC7A11-overexpressing 786-O cells treated with KL-11743, BAY-876 or cultured in glucose free medium. g, Western blotting analysis of indicated proteins in ACHN cells with SLC7A11 and/or G6PD overexpression. The experiment was repeated twice, independently, with similar results. All error bars are mean± s.d., n=3 independent experiments. All p values were calculated using two-tailed unpaired Student’s t-test. Detailed statistical tests are described in the Methods. Scanned images of unprocessed blots are shown in Source Data Extended Data Fig. 6. Numeral data are provided in Statistics Source Data Extended Data Fig. 6.
Extended Data Fig. 7
Extended Data Fig. 7. SLC7A11-high tumors are sensitive to GLUT inhibitor
a, Plasma levels of GLUT inhibitor KL-11743 were measured in mice at different time points after intraperitoneal injection. Error bars are mean ± s.d, n=4 independent repeats. b, End-point weights of NCI-H226 xenograft tumors with indicated genotypes treated with KL-11743 or vehicle. Error bars are mean ± s.d., n=9 independent repeats. c, End-point weights of ACHN xenograft tumors with indicated genotypes treated with BAY-876, KL-11743, or vehicle. Error bars are mean ± s.d., n=8 independent repeats. d-h, End-point weights of PDX xenograft tumors with indicated genotypes treated with KL-11743 or vehicle. Error bars are mean ± s.d., n=6 (d: KL-11743, f-h) or7 (d: vehicle, e) independent repeats. i, Representative hematoxylin and eosin staining of major organs from mice treated with vehicle or GLUT inhibitors. The experiment was repeated twice, independently, with similar results. Scale bars=50 μm. j-p, Mice weights of indicated cell line-xenografts or PDXs at different time points treated with KL-11743 or vehicle. Error bars are mean ± s.d., n=6 (l: KL-11743, n-p), 7 (l: vehicle, m), 8 (k) or 9 (j) independent repeats. All p values were calculated using two-tailed unpaired Student’s t-test. Detailed statistical tests are described in the Methods. Numeral data are provided in Statistics Source Data Extended Data Fig. 7.
Extended Data Fig. 8
Extended Data Fig. 8. The working model depicting how SLC7A11 regulates pentose phosphate pathway dependency and glucose-deprivation-induced cell death
See discussion for detailed description. PPP: pentose phosphate pathway; GLUT: glucose transporter.
Extended Data Fig. 9
Extended Data Fig. 9. An example for the gating strategy of Flow Cytometry
Initial cell population gating (FSC-Area VS FSC-Height) was adopted to make sure only single cells were used for analysis.
Fig. 1.
Fig. 1.. SLC7A11 promotes the PPP flux.
a, Volcano plot showing metabolomic profiling for SLC7A11-overexpressing 786-O cells compared with empty vector (EV) cells. n=3 independent experiments. b, Bar graph showing the fold changes of PPP and PPP-derived intermediates induced by SLC7A11 overexpression in 786-O cells. n=3 independent experiments. c, Mass isotopomer distribution of lactate produced from [1,2-13C2]-glucose in EV and SLC7A11-overexpressing 786-O cells. n=3 independent experiments. d, Relative flux of glucose carbon into the oxidative pentose phosphate pathway (oxPPP) in EV and SLC7A11-overexpressing 786-O cells. n=5 independent experiments. e The overflow flux through oxidative PPP in EV and SLC7A11-overexpressing 786-O cells. n=5 independent experiments. f, Contribution of glucose-derived deuterium labelled NADPH (via oxPPP) to cytosolic NADPH in EV and SLC7A11-overexpressing 786-O cells. n=3 independent experiments. In (f), data are plotted as mean ±95% confidence interval (CI). Other error bars are mean ± s.d.; all p values were calculated using two-tailed unpaired Student’s t-test. Numeral data are provided in Statistics Source Data Fig. 1. Abbreviations: αKG, α-ketoglutarate; Glu, glutamate; Cys, cysteine; 6PG, 6-phospho-gluconate; PPP, pentose phosphate pathway; G6P, glucose-6-phosphate; G6PD, glucose-6-phosphate dehydrogenase; PGD, 6-phosphogluconate dehydrogenase; R5P, ribose-5-phosphate; F6P, fructose-6-phosphate; GA3P, glyceraldehyde-3-phosphate; PYR, pyruvate; Lac, lactate; M0–3, 0–3 13C atoms labeled metabolites.
Fig. 2.
Fig. 2.. The cross-talk between SLC7A11 and the PPP in regulating glucose-limitation-induced cell death and their co-expression in human cancers.
a, The protein levels of SLC7A11 and other indicated genes involved in glucose metabolism in different cancer cell lines were determined by Western blotting. Vinculin is used as a loading control. b, c, Protein levels and cell death in response to glucose limitation in EV and SLC7A11-overexpressing 786-O cells with or without G6PD knockdown were measured by Western blotting (b) and PI staining (c). d, e, protein levels and cell death in response to glucose limitation in EV and SLC7A11-overexpressing 786-O cells with or without G6PD overexpression were measured by Western blotting (d) and PI staining (e). In c and e, error bars are mean ± s.d., n=3 independent experiments, p values were calculated using two-tailed unpaired Student’s t-test. f, The Pearson’s correlation between expression of SLC7A11 and glucose metabolism genes in 33 cancer types from TCGA. The cancer types (columns) and genes (rows) are ordered by hierarchical clustering. PPP genes are highlighted in red at right side. The independent samples’ numbers of cancer types are described in the Methods. g, Compared to other glucose metabolism genes, PPP genes show significant positive correlations with SLC7A11 in KIRP (n=290) and KIRC (n=533). h, Scatter plots showing the correlation between SLC7A11 and 4 PPP genes (G6PD, PGD, TKT, TALDO1) in KIRP (n=290). i, Kaplan–Meier plots of KIRP patients stratified by SLC7A11, G6PD, and PGD expression levels, respectively. j, Kaplan–Meier plots of KIRP patients stratified by unsupervised clustering on SLC7A11 and G6PD expression. Group 1 has lower SLC7A11 and G6PD expression, while Group 2 has higher SLC7A11 and G6PD expression. k, Kaplan–Meier plots of KIRP patients stratified by unsupervised clustering on SLC7A11 and PGD expression. Group 1 has lower SLC7A11 and PGD expression, while Group 2 has higher SLC7A11 and PGD expression. The experiments (a, b, d) were repeated three times, independently, with similar results. Detailed statistical tests of f-k are described in the Methods. Numeral data are provided in Statistics Source Data Fig. 2. Scanned images of unprocessed blots are shown in Source Data Fig.2.
Fig. 3.
Fig. 3.. SLC7A11-mediated cystine uptake and subsequent cystine reduction to cysteine promote disulfide stress, deplete NADPH and cause redox system collapse under glucose deprivation.
a-f, Measurement of NADP+/NADPH ratios (a), intracellular levels and cystine (b) and cysteine (c), GSSG/GSH ratios (d), ROS levels (e), and cell death (f) of EV and SLC7A11-overexpressing 786-O cells cultured with (+Glc) or without glucose (-Glc). g-l, Measurement of NADP+/NADPH ratios (g), intracellular levels of cystine (h) and cysteine (i), GSSG/GSH ratios (j), ROS levels (k), and cell death (l) of control (sgCtrl) and SLC7A11 knockout (sgSLC-1/2) UMRC cells cultured with (+Glc) or without glucose (-Glc). m-r, Measurement of NADP+/NADPH ratios (m), intracellular levels of cystine (n) and cysteine (o), GSSG/GSH ratios (p), ROS levels (q) and cell deaths (r) of UMRC6 cells cultured with normal (+Glc), glucose free (-Glc), glucose/cystine double free (-Glc-Cystine), or cystine free (-Cystine) medium. s, Deuterium labelled NADPH fraction of total NADPH pool in UMRC cells cultured in glucose-containing or glucose free medium with 2 mM deuterium labelled 2DG (2-deoxy-D-[1–2H]glucose). t-y, Measurement of NADP+/NADPH ratios (t), intracellular levels of cystine (u) and cysteine (v), GSSG/GSH ratios (w), ROS levels (x), and cell death (y) of UMRC6 cells cultured in glucose-containing or glucose-free medium with or without treatment of 2 mM 2DG. All p values were calculated using two-tailed unpaired Student’s t-test. Detailed statistical tests are described in the Methods. All error bars are mean± s.d., n=3 independent experiments. Numeral data are provided in Statistics Source Data Fig. 3.
Fig. 4.
Fig. 4.. Preventing disulfide but not ROS accumulation rescues redox defects and cell death in SLC7A11-overexpressing cells under glucose starvation.
a-d, Measurement of ROS levels (a), intracellular levels of cystine (b), NADP+/NADPH ratios (c), and cell death (d) of UMRC6 cells cultured in glucose-containing or glucose-free medium with or without treatment of TEMPO or Trolox. e-g, Measurement intracellular levels of cystine (e), NADP+/NADPH ratios (f), and cell death (g) of UMRC6 cells cultured in glucose-containing or glucose-free medium with or without treatment of 2 mM NAC. h-j, Measurement intracellular levels of cystine (h), NADP+/NADPH ratios (i), and cell death (j) of UMRC6 cells cultured in glucose-containing or glucose-free medium with or without treatment of 1 mM 2ME, 2 mM D-Penicillamine or L-Penicillamine. k-m, Measurement intracellular levels of cystine (k), NADP+/NADPH ratios (l), and cell death (m) of UMRC6 cells cultured in glucose-containing or glucose-free medium with or without treatment of TCEP. n-p, Measurement intracellular levels of cystine (n), NADP+/NADPH ratios (o), and cell death (p) of UMRC6 cells cultured in glucose-containing or glucose-free medium with or without treatment of 1 mM 2ME. All p values were calculated using two-tailed unpaired Student’s t-test. Detailed statistical tests are described in the Methods. All error bars are mean± s.d., n=3 independent experiments. Numeral data are provided in Statistics Source Data Fig. 4.
Fig. 5.
Fig. 5.. Aberrant expression of SLC7A11 sensitizes cancer cells to GLUT inhibition.
a, Glucose uptake levels were measured in 786-O cells treated with 2 μM KL-11743 or BAY-876. b, Measurement of NADP+/NADPH ratios in EV and SLC7A11-overexpressing-786-O cells treated with KL-11743, BAY-876, or cultured in glucose free medium. c, Cell death was measured by PI staining in different cancer cell lines treated with 2 μM KL-11743 or BAY-876. d, e, Representative phase-contrast images and cell death of EV and SLC7A11-overexpressing 786-O cells treated with 2 μM KL-11743 (d) or BAY-876 (e). The experiment was repeated four times, independently, with similar results. f, g, GLUT inhibition-induced cell death in control (sgCtrl) and SLC7A11 knockout (sgSLC7A11) UMRC6 (f) or NCI-H226 (g) cells were measured by PI staining. h, Measurement intracellular levels of cystine in EV and SLC7A11-overexpressing-786-O cells treated with KL-11743, BAY-876, or cultured in glucose free medium. i, j, Cell death was measured by PI staining in 786-O (i) or ACHN (j) cells with SLC7A11 and/or G6PD overexpression treated with 2 μM KL-11743 or BAY-876. All p values were calculated using two-tailed unpaired Student’s t-test. Detailed statistical tests are described in the Methods. All error bars are mean± s.d., n=3 independent experiments. All scale bars=100 μm. Numeral data are provided in Statistics Source Data Fig. 5.
Fig. 6.
Fig. 6.. SLC7A11-high tumors are sensitive to GLUT inhibitor.
a, b, Tumor volumes at different weeks after tumor cell injection of NCI-H226 xenograft tumors with indicated genotypes treated with KL-11743 or vehicle. Error bars are mean ± s.d., n=9 independent repeats. c, Hematoxylin and eosin staining of NCI-H226 tumor xenografts with indicated genotypes treated with KL-11743 or vehicle. Black arrows and letters “N” denote necrotic cells and regions, respectively. The experiment was repeated twice, independently, with similar results. Scale bars=20 μm. d-h, Normalized levels of metabolites or NADP+/NADPH ratios of NCI-H226 xenograft tumors with indicated genotypes treated with KL-11743 or vehicle. Error bars are mean± s.d., n=4 independent repeats. i, j, Tumor volumes at different days after tumor cell injection of ACHN xenograft tumors with indicated genotypes treated with KL-11743 or vehicle. Error bars are mean ± s.d., n=8independent repeats. k, Protein levels of indicated genes from different PDX models. The experiment was repeated twice, independently, with similar results. l-p, Tumor volumes at different days after PDXs implantation treated with KL-11743, or vehicle. Error bars are mean ± s.d., n=6 (l: KL-11743, n-p) or7 (l: vehicle, m) independent repeats. All p values were calculated using two-tailed unpaired Student’s t-test. Detailed statistical tests are described in the Methods. Scanned images of unprocessed blots are shown in Source Data Fig. 6. Numeral data are provided in Statistics Source Data Fig. 6.

References

    1. Pavlova NN & Thompson CB The Emerging Hallmarks of Cancer Metabolism. Cell Metab 23, 27–47 (2016). - PMC - PubMed
    1. Boroughs LK & DeBerardinis RJ Metabolic pathways promoting cancer cell survival and growth. Nat Cell Biol 17, 351–359 (2015). - PMC - PubMed
    1. DeBerardinis RJ & Chandel NS Fundamentals of cancer metabolism. Sci Adv 2, e1600200 (2016). - PMC - PubMed
    1. Wolpaw AJ & Dang CV Exploiting Metabolic Vulnerabilities of Cancer with Precision and Accuracy. Trends in cell biology 28, 201–212 (2018). - PMC - PubMed
    1. Bi J, Wu S, Zhang W & Mischel PS Targeting cancer’s metabolic co-dependencies: A landscape shaped by genotype and tissue context. Biochim Biophys Acta Rev Cancer 1870, 76–87 (2018). - PMC - PubMed

Publication types

MeSH terms