. 2020 Aug;38(8):954-961.
doi: 10.1038/s41587-020-0470-y. Epub 2020 Mar 30.

Combinatorial single-cell CRISPR screens by direct guide RNA capture and targeted sequencing

Affiliations

Combinatorial single-cell CRISPR screens by direct guide RNA capture and targeted sequencing

Joseph M Replogle et al. Nat Biotechnol. 2020 Aug.

Abstract

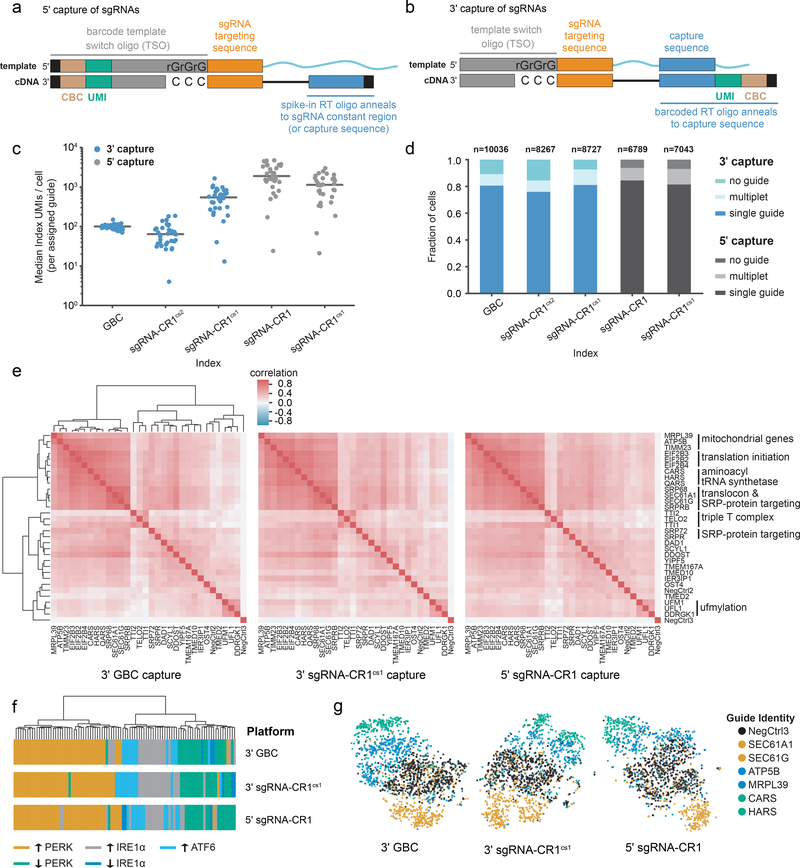
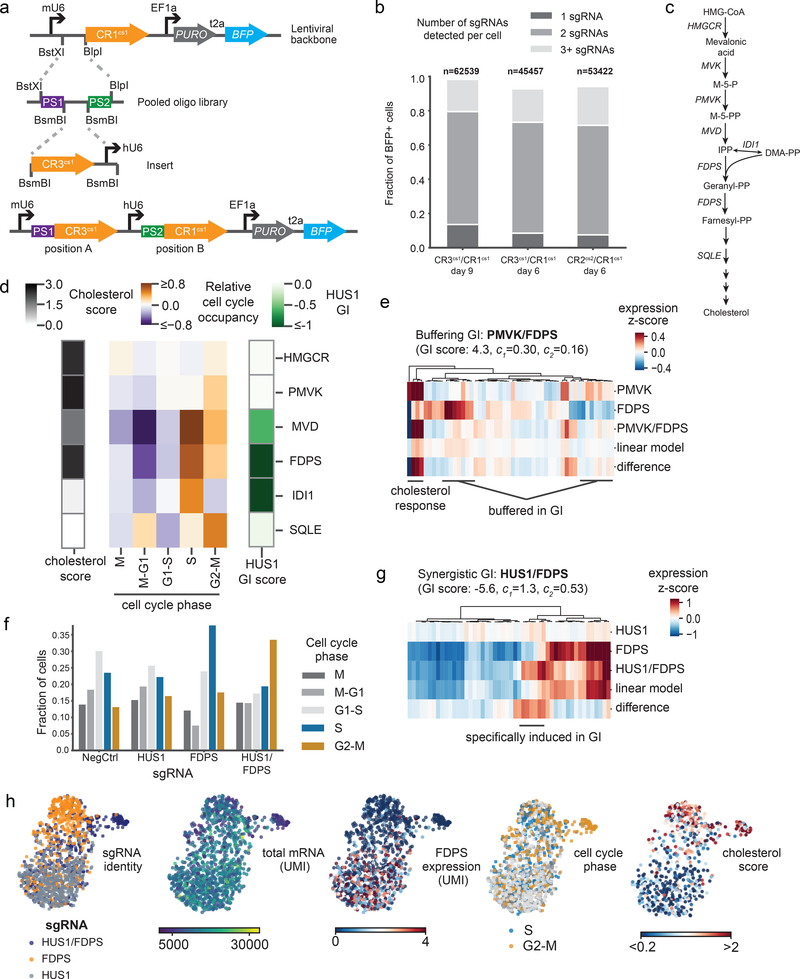
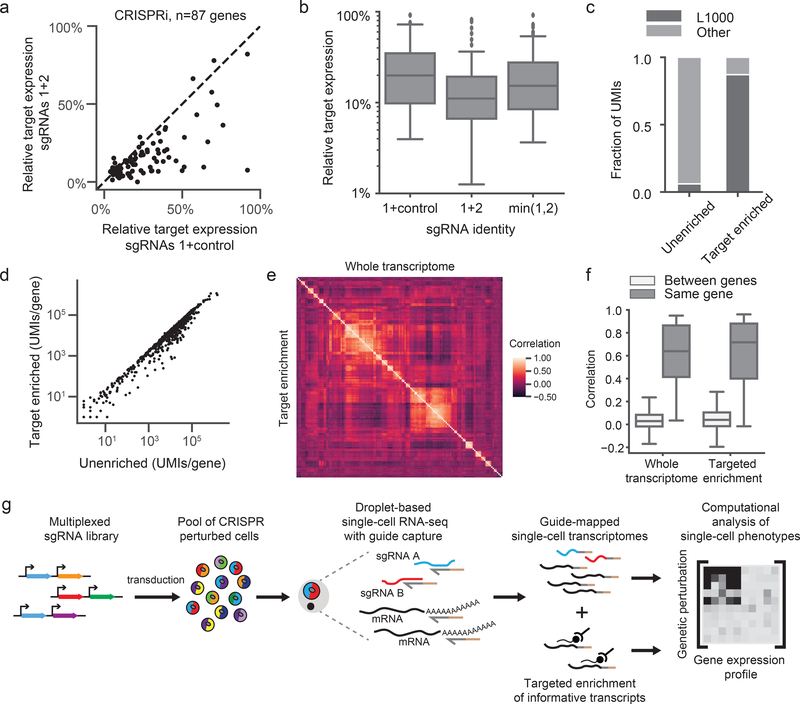
Single-cell CRISPR screens enable the exploration of mammalian gene function and genetic regulatory networks. However, use of this technology has been limited by reliance on indirect indexing of single-guide RNAs (sgRNAs). Here we present direct-capture Perturb-seq, a versatile screening approach in which expressed sgRNAs are sequenced alongside single-cell transcriptomes. Direct-capture Perturb-seq enables detection of multiple distinct sgRNA sequences from individual cells and thus allows pooled single-cell CRISPR screens to be easily paired with combinatorial perturbation libraries that contain dual-guide expression vectors. We demonstrate the utility of this approach for high-throughput investigations of genetic interactions and, leveraging this ability, dissect epistatic interactions between cholesterol biogenesis and DNA repair. Using direct capture Perturb-seq, we also show that targeting individual genes with multiple sgRNAs per cell improves efficacy of CRISPR interference and activation, facilitating the use of compact, highly active CRISPR libraries for single-cell screens. Last, we show that hybridization-based target enrichment permits sensitive, specific sequencing of informative transcripts from single-cell RNA-seq experiments.


Figures

Figure 1:
Figure 1:. Design and validation of direct capture Perturb-seq for 3’ and 5’ single-cell RNA-sequencing.
a) Schematic of sgRNA capture during 5’ scRNA-seq. An sgRNA containing a standard constant region (top) anneals to a guide-specific RT oligo. Indexing of reverse transcribed cDNA (bottom) occurs after template switch. This strategy is compatible with unmodified sgRNAs (shown) or with sgRNAs with an integrated capture sequence. b) Schematic of sgRNA capture via an integrated capture sequence by 3’ scRNA-seq. A capture sequence within the constant region of the sgRNA (top) anneals to a barcoded, target-specific RT primer. Indexed cDNA (bottom) is produced by reverse transcription. c) Index (GBC or guide) capture rates per cell across experiments conducted with GBC Perturb-seq and direct capture Perturb-seq. Data represent median index UMI counts per cell for cells bearing each of n=32 sgRNAs across platforms. Grey lines indicate median values. “sgRNA-CR1” indicates 5’ capture of standard sgRNAs without a capture sequence. d) Index (GBC or guide) assignment rates across experiments conducted with GBC Perturb-seq and direct capture Perturb-seq. The total number of cells per experiment as well as the fractions of cells assigned no guide, a single guide, or more than one guide are indicated. “sgRNA-CR1” indicates 5’ capture of standard sgRNAs without a capture sequence. e) Clustering of perturbations from UPR Perturb-seq experiments conducted with GBC Perturb-seq and direct capture Perturb-seq. Heatmaps represent Spearman’s rank correlations between pseudo-bulk expression profiles for each of n=32 perturbations. For visual comparison, the rows and columns of all three heatmaps are ordered identically based on the hierarchical clustering of GBC Perturb-seq data. Functional annotations are indicated. f) Hierarchical clustering of UPR-regulated genes based on co-expression in each of the indicated Perturb-seq experiments. Colors indicate membership in different UPR-regulated groups as determined by Adamson et al. g) Single-cell projections are based on t-sne visualization of 10 independent components (n=1795 cells for 3’ GBC Perturb-seq, n=1595 cells for 3’ sgRNA-CR1cs1 Perturb-seq, and n=1424 cells for 5’ sgRNA-CR1 Perturb-seq). Colors indicate functional similarities among targeted genes.
Figure 2:
Figure 2:. Direct capture Perturb-seq and pooled dual-guide cloning allows systematic dissection of genetic interactions between cholesterol biosynthesis and DNA repair genes.
a) Schematic of programmed dual-guide library cloning strategy. Paired sgRNA targeting regions are synthesized on a single oligo and cloned into a direct capture Perturb-seq vector by ligation. Then, an sgRNA constant region and hU6 promoter are inserted between the sgRNA targeting regions to generate a dual-guide array in a lentiviral backbone. This example shows a CR3cs1/CR1cs1 library design. b) Guide assignment rates for dual-guide direct capture Perturb-seq experiments. The fraction of cells carrying sgRNAs (marked by BFP) varied due to strong CRISPRi growth defects; the total number of cells were therefore first scaled by BFP positivity. The total number of cells and fraction of cells assigned a single guide, two guides, or more than two guides are indicated. c) Schematic of the cholesterol biosynthesis pathway. d) Heatmap of cell cycle and cholesterol phenotypes for cells with depletion of enzymes in the cholesterol biosynthesis pathway. Cell cycle occupancy for each perturbation depicted indicates the relative enrichment or depletion of cells in each phase relative to unperturbed cells. The cholesterol score is the mean z-scored expression of enzymes in the cholesterol biosynthesis pathway. The “HUS1 GI” is a metric of the growth defect caused by an genetic perturbations paired with HUS1 knockdown relative to the genetic perturbation alone as determined by Horlbeck et al. All genes were significantly depleted by CRISPRi (percent knockdown: HMGCR 94%; PMVK 92%; MVD 83%; FDPS 78%; IDI1 82%; SQLE 84%). Number of cells per perturbation: non-targeting control n=527, HMGCR n=608, PMVK n=389, MVD n=184, FDPS n=439, IDI1 n=131, SQLE n=255. e) Heatmap of gene expression for the 50 most differentially expressed genes between cells carrying each indicated perturbation. Expression values are the z-scored expression relative to unperturbed cells (n=389 PMVK cells, n=1921 FDPS cells, and n=517 PMVK/FDPS cells). Cells were combined to generate the expression signatures. Knockdown was consistent between single-gene and dual-gene targeting (FDPS knockdown 73% alone vs. 82% paired; PMVK knockdown 92% alone vs. 86% paired). The indicated GI score was previously determined by Horlbeck et al., where GI scores >3 are considered strongly buffering interactions. f) Fraction of cells in each cell cycle phase across cells with the indicated perturbations. Number of cells per perturbation: non-targeting control n=780, HUS1 n=905, FDPS n=439, HUS1/FDPS n=831. g) Heatmap of gene expression for the 50 most differentially expressed genes between cells carrying each indicated perturbation. Expression values are the z-scored expression relative to unperturbed cells (n=905 HUS1 cells, n=439 FDPS cells, and n=831 HUS1/FDPS cells). Cells were combined to generate the expression signatures. Knockdown was consistent between single-gene and dual-gene targeting (FDPS knockdown 78% alone vs. 72% paired; HUS1 knockdown 95% alone vs. 85% paired) The indicated GI score was previously determined by Horlbeck et al., where GI scores <−3 are considered strongly synergistic interactions. h) Single-cell UMAP projections with informative cell features highlighted (n=2175 cells).
Figure 3:
Figure 3:. Multiplexed CRISPRi/CRISPRa and hybridization-based target enrichment enable scalable and versatile single-cell CRISPR screens.
a) Scatterplot of the relative target expression per gene comparing CRISPRi knockdown with a single sgRNA (expressed from a dual-guide vector paired with a non-targeting control) versus multiplexed sgRNAs. Multiplexed sgRNAs significantly improve knockdown (sgRNAs 1+control median relative target expression=0.20; sgRNAs 1+2 median relative target expression=0.11; Wilcoxon signed-rank two-sided test n=87 genes, W=378, p=8e-11). sgRNA 1, best predicted sgRNA for each gene. sgRNA 2, second best predicted sgRNA for each gene. b) Box plots of the relative target expression per gene in the multiplexed CRISPRi experiment denoting quartile ranges (box), median (center mark), and 1.5 × interquartile range (whiskers). “min(1,2)” indicates the minimum remaining target expression between sgRNA 1 (paired with negative control) and sgRNA 2 (paired with negative control), ie. the predicted multiplexed sgRNA knockdown based on a dominant model of knockdown. The multiplexed sgRNAs performed better than the dominant model (Wilcoxon signed-rank two-sided test n=87 genes, W=698, p=3e-7). c) The fraction of total UMIs for L1000 genes (n=978) versus other genes, before and after target enrichment. d) Scatterplot of the total number of UMIs for each gene, before and after target enrichment (n=978 genes). The Pearson correlation of log10 normalized UMIs is r=0.98. e) Heatmap depicts clustering of guides in our multiplexed CRISPRi experiment. Heatmap represents Spearman’s rank correlations between pseudo-bulk expression profiles of well-expressed genes (>1 UMI/cell). Data from all perturbations with >10 differentially expressed genes compared to controls are included (n=145 genes). The upper triangle (correlation matrix) was calculated on the whole transcriptome while the lower triangle (correlation matrix) was calculated on the target-enriched transcriptome. Both triangles were identically ordered based on hierarchical clustering of the whole transcriptome correlation matrix. f) Pearson correlations of pseudo-bulk differential expression profiles of well-expressed genes (>1 UMI/cell) caused by sgRNAs targeting the same gene (for n=39 genes whose knockdown led to differential gene expression) versus sgRNAs targeting different genes (n=111592 pairs). sgRNAs targeting the same gene had significantly more similar profiles than sgRNAs targeting different genes, both before and after target enrichment (unenriched median r=0.64, Mann-Whitney U two-sided test U=117224, p=1.4e-24; enriched median r=0.72, Mann-Whitney U two-sided test U=259898, p=1.7e-21). Box plots denote quartile ranges (box), median (center mark), and 1.5 × interquartile range (whiskers). g) Schematic overview of direct capture Perturb-seq workflow.

References

    1. Packer J & Trapnell C Single-Cell Multi-omics: An Engine for New Quantitative Models of Gene Regulation. Trends Genet 34, 653–665 (2018). - PMC - PubMed
    1. Feldman D et al. Optical Pooled Screens in Human Cells. Cell 179, 787–799.e17 (2019). - PMC - PubMed
    1. Rubin AJ et al. Coupled Single-Cell CRISPR Screening and Epigenomic Profiling Reveals Causal Gene Regulatory Networks. Cell 176, 361–376.e17 (2018). - PMC - PubMed
    1. Adamson B et al. A Multiplexed Single-Cell CRISPR Screening Platform Enables Systematic Dissection of the Unfolded Protein Response. Cell 167, 1867–1882.e21 (2016). - PMC - PubMed
    1. Dixit A et al. Perturb-Seq: Dissecting Molecular Circuits with Scalable Single-Cell RNA Profiling of Pooled Genetic Screens. Cell 167, 1853–1866.e17 (2016). - PMC - PubMed

Publication types

Substances