. 2020 Mar 31;15(3):e0230405.
doi: 10.1371/journal.pone.0230405. eCollection 2020.

Data-based analysis, modelling and forecasting of the COVID-19 outbreak

Affiliations

Data-based analysis, modelling and forecasting of the COVID-19 outbreak

Cleo Anastassopoulou et al. PLoS One. .

Abstract

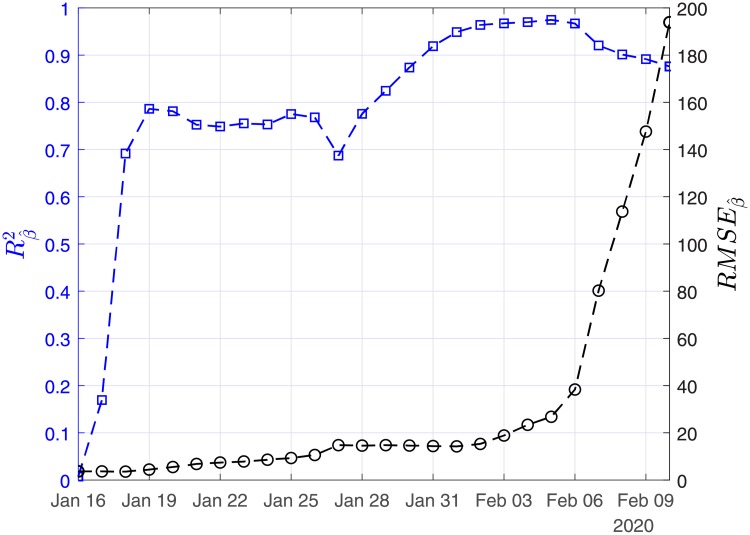
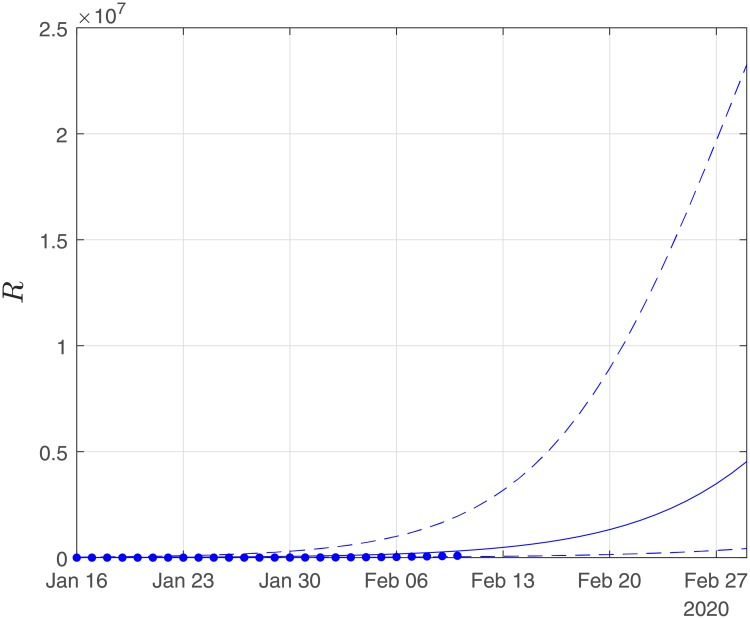
Since the first suspected case of coronavirus disease-2019 (COVID-19) on December 1st, 2019, in Wuhan, Hubei Province, China, a total of 40,235 confirmed cases and 909 deaths have been reported in China up to February 10, 2020, evoking fear locally and internationally. Here, based on the publicly available epidemiological data for Hubei, China from January 11 to February 10, 2020, we provide estimates of the main epidemiological parameters. In particular, we provide an estimation of the case fatality and case recovery ratios, along with their 90% confidence intervals as the outbreak evolves. On the basis of a Susceptible-Infectious-Recovered-Dead (SIDR) model, we provide estimations of the basic reproduction number (R0), and the per day infection mortality and recovery rates. By calibrating the parameters of the SIRD model to the reported data, we also attempt to forecast the evolution of the outbreak at the epicenter three weeks ahead, i.e. until February 29. As the number of infected individuals, especially of those with asymptomatic or mild courses, is suspected to be much higher than the official numbers, which can be considered only as a subset of the actual numbers of infected and recovered cases in the total population, we have repeated the calculations under a second scenario that considers twenty times the number of confirmed infected cases and forty times the number of recovered, leaving the number of deaths unchanged. Based on the reported data, the expected value of R0 as computed considering the period from the 11th of January until the 18th of January, using the official counts of confirmed cases was found to be ∼4.6, while the one computed under the second scenario was found to be ∼3.2. Thus, based on the SIRD simulations, the estimated average value of R0 was found to be ∼2.6 based on confirmed cases and ∼2 based on the second scenario. Our forecasting flashes a note of caution for the presently unfolding outbreak in China. Based on the official counts for confirmed cases, the simulations suggest that the cumulative number of infected could reach 180,000 (with a lower bound of 45,000) by February 29. Regarding the number of deaths, simulations forecast that on the basis of the up to the 10th of February reported data, the death toll might exceed 2,700 (as a lower bound) by February 29. Our analysis further reveals a significant decline of the case fatality ratio from January 26 to which various factors may have contributed, such as the severe control measures taken in Hubei, China (e.g. quarantine and hospitalization of infected individuals), but mainly because of the fact that the actual cumulative numbers of infected and recovered cases in the population most likely are much higher than the reported ones. Thus, in a scenario where we have taken twenty times the confirmed number of infected and forty times the confirmed number of recovered cases, the case fatality ratio is around ∼0.15% in the total population. Importantly, based on this scenario, simulations suggest a slow down of the outbreak in Hubei at the end of February.


Conflict of interest statement

The authors have declared that no competing interests exist.

Figures

Fig 1
Fig 1. Scenario I. Estimated values of the basic reproduction number (R0) as computed by least squares using a rolling window with initial date the 11th of January.
The solid line corresponds to the mean value and dashed lines to lower and upper 90% confidence intervals.
Fig 2
Fig 2. Scenario I. Estimated values of the case fatality (γ^) and case recovery ratios (β^) as computed by least squares using a rolling window.
Solid lines correspond to the mean values and dashed lines to lower and upper 90% confidence intervals.
Fig 3
Fig 3. Scenario I. Coefficient of determination (R2) and root mean square error (RMSE) resulting from the solution of the linear regression problem with least-squares for the basic reproduction number (R0).
Fig 4
Fig 4. Scenario I. Coefficient of determination (R2) and root mean square error (RMSE) resulting from the solution of the linear regression problem with least-squares for the case recovery ratio (β^).
Fig 5
Fig 5. Scenario I. Coefficient of determination (R2) and root mean square error (RMSE) resulting from the solution of the linear regression problem with least-squares for the case fatality ratio (γ^).
Fig 6
Fig 6. Scenario I. Simulations until the 29th of February of the cumulative number of infected as obtained using the SIRD model.
Dots correspond to the number of confirmed cases from the 16th of January to the 10th of February. The initial date of the simulations was the 16th of November with one infected, zero recovered and zero deaths. Solid lines correspond to the dynamics obtained using the estimated expected values of the epidemiological parameters α = 0.191, β = 0.064d−1, γ = 0.01; dashed lines correspond to the lower and upper bounds derived by performing simulations on the limits of the confidence intervals of the parameters.
Fig 7
Fig 7. Scenario I. Simulations until the 29th of February of the cumulative number of recovered as obtained using the SIRD model.
Dots correspond to the number of confirmed cases from the 16th of January to the 10th of February. The initial date of the simulations was the 16th of November with one infected, zero recovered and zero deaths. Solid lines correspond to the dynamics obtained using the estimated expected values of the epidemiological parameters α = 0.191, β = 0.064d−1, γ = 0.01; dashed lines correspond to the lower and upper bounds derived by performing simulations on the limits of the confidence intervals of the parameters.
Fig 8
Fig 8. Scenario I. Simulations until the 29th of February of the cumulative number of deaths as obtained using the SIRD model.
Dots correspond to the number of confirmed cases from 16th of January to the 10th of February. The initial date of the simulations was the 16th of November with one infected, zero recovered and zero deaths. Solid lines correspond to the dynamics obtained using the estimated expected values of the epidemiological parameters α = 0.191, β = 0.064d−1, γ = 0.01; dashed lines correspond to the lower and upper bounds derived by performing simulations on the limits of the confidence intervals of the parameters.
Fig 9
Fig 9. Scenario II. Estimated values of the basic reproduction number (R0) as computed by least squares using a rolling window with initial date the 11th of January.
The solid line corresponds to the mean value and dashed lines to lower and upper 90% confidence intervals.
Fig 10
Fig 10. Scenario II. Estimated values of case fatality (γ^) and case recovery (β^) ratios, as computed by least squares using a rolling window (see in Methodology).
Solid lines correspond to the mean values and dashed lines to lower and upper 90% confidence intervals.
Fig 11
Fig 11. Scenario II. Coefficient of determination (R2) and root mean square error (RMSE) resulting from the solution of the linear regression problem with least-squares for the basic reproduction number (R0).
Fig 12
Fig 12. Scenario II. Coefficient of determination (R2) and root mean square error (RMSE) resulting from the solution of the linear regression problem with least-squares for the recovery rate (β^).
Fig 13
Fig 13. Scenario II. Coefficient of determination (R2) and root mean square error (RMSE) resulting from the solution of the linear regression problem with least-squares for the mortality rate (γ^).
Fig 14
Fig 14. Scenario II. Simulations until the 29th of February of the cumulative number of infected as obtained using the SIRD model.
Dots correspond to the number of confirmed cases from 16th of Jan to the 10th of February. The initial date of the simulations was the 16th of November with one infected, zero recovered and zero deaths. Solid lines correspond to the dynamics obtained using the estimated expected values of the epidemiological parameters α = 0.319, β = 0.16d−1, γ = 0.0005; dashed lines correspond to the lower and upper bounds derived by performing simulations on the limits of the confidence intervals of the parameters.
Fig 15
Fig 15. Scenario II. Simulations until the 29th of February of the cumulative number of recovered as obtained using the SIRD model.
Dots correspond to the number of confirmed cases from 16th of January to the 10th of February. The initial date of the simulations was the 16th of November, with one infected, zero recovered and zero deaths. Solid lines correspond to the dynamics obtained using the estimated expected values of the epidemiological parameters α = 0.319, β = 0.16d−1, γ = 0.0005; dashed lines correspond to the lower and upper bounds derived by performing simulations on the limits of the confidence intervals of the parameters.
Fig 16
Fig 16. Scenario II. Simulations until the 29th of February of the cumulative number of deaths as obtained using the SIRD model.
Dots correspond to the number of confirmed cases from the 16th of November to the 10th of February. The initial date of the simulations was the 16th of November with zero infected, zero recovered and zero deaths. Solid lines correspond to the dynamics obtained using the estimated expected values of the epidemiological parameters α = 0.319, β = 0.16d−1, γ = 0.0005; dashed lines correspond to the lower and upper bounds derived by performing simulations on the limits of the confidence intervals of the parameters.

References

    1. Li Q, Guan X, Wu P, et al. Early Transmission Dynamics in Wuhan, China, of Novel Coronavirus-Infected Pneumonia; 2020. Available from: https://doi.org/10.1088%2F0951-7715%2F16%2F2%2F308. - PMC - PubMed
    1. Organization WH. WHO Statement Regarding Cluster of Pneumonia Cases in Wuhan, China; 2020. Available from: https://www.who.int/china/news/detail/09-01-2020-who-statement-regarding....
    1. Organization WH. Novel coronavirus(2019-nCoV). Situation report 21. Geneva, Switzerland: World Health Organization; 2020; 2020. Available from: https://www.who.int/docs/default-source/coronaviruse/situation-reports/2....
    1. Lu R, Zhao X, Li J, Niu P, Yang B, Wu H, et al. Genomic characterisation and epidemiology of 2019 novel coronavirus: implications for virus origins and receptor binding. The Lancet. 2020. 10.1016/S0140-6736(20)30251-8 - DOI - PMC - PubMed
    1. Zhou P, Yang XL, Wang XG, Hu B, Zhang L, Zhang W, et al. A pneumonia outbreak associated with a new coronavirus of probable bat origin. Nature. 2020. 10.1038/s41586-020-2012-7 - DOI - PMC - PubMed