. 2020 Mar 13:11:182.
doi: 10.3389/fphys.2020.00182. eCollection 2020.

The Degree of t-System Remodeling Predicts Negative Force-Frequency Relationship and Prolonged Relaxation Time in Failing Human Myocardium

Affiliations

The Degree of t-System Remodeling Predicts Negative Force-Frequency Relationship and Prolonged Relaxation Time in Failing Human Myocardium

Maha Abu-Khousa et al. Front Physiol. .

Abstract

The normally positive cardiac force-frequency relationship (FFR) becomes flat or negative in chronic heart failure (HF). Here we explored if remodeling of the cardiomyocyte transverse tubular system (t-system) is associated with alterations in FFR and contractile kinetics in failing human myocardium. Left-ventricular myocardial slices from 13 failing human hearts were mounted into a biomimetic culture setup. Maximum twitch force (F), 90% contraction duration (CD90), time to peak force (TTP) and time to relaxation (TTR) were determined at 37°C and 0.2-2 Hz pacing frequency. F1 Hz/F0.5 Hz and F2 Hz/F0.5 Hz served as measures of FFR, intracellular cardiomyocyte t-tubule distance (ΔTT) as measure of t-system remodeling. Protein levels of SERCA2, NCX1, and PLB were quantified by immunoblotting. F1 Hz/F0.5 Hz (R 2 = 0.82) and F2 Hz/F0.5 Hz (R 2 = 0.5) correlated negatively with ΔTT, i.e., samples with severe t-system loss exhibited a negative FFR and reduced myocardial wall tension at high pacing rates. PLB levels also predicted F1 Hz/F0.5 Hz, but to a lesser degree (R 2 = 0.49), whereas NCX1 was not correlated (R 2 = 0.02). CD90 correlated positively with ΔTT (R 2 = 0.39) and negatively with SERCA2/PLB (R 2 = 0.42), indicating that both the t-system and SERCA activity are important for contraction kinetics. Surprisingly, ΔTT was not associated with TTP (R 2 = 0) but rather with TTR (R 2 = 0.5). This became even more pronounced when interaction with NCX1 expression was added to the model (R 2 = 0.79), suggesting that t-system loss impairs myocardial relaxation especially when NCX1 expression is low. The degree of t-system remodeling predicts FFR inversion and contraction slowing in failing human myocardium. Moreover, together with NCX, the t-system may be important for myocardial relaxation.

Keywords: cardiac excitation-contraction coupling; cardiac remodeling; force frequency relationship; heart failure; human heart; transverse tubular system.


Figures

FIGURE 1
FIGURE 1
Examples of tissue slices from myocardial specimens with high and low degree of t-system remodeling and corresponding force-frequency relationship. Three-dimensional confocal images in xy and xz views of left-ventricular myocardial tissue slices stained with wheat germ agglutinin from (A,B) specimen with dense t-system, and (C,D) specimen with sparse t-system. B and D show the respective magnifications of the boxed regions in A and C, and the corresponding 3D distance maps (color-coded distance to closest t-tubule, ΔTT). Dotted lines in A and C indicate the optical sections of the xy and xz views. (E,F) Twitch forces of myocardial slices from the specimens shown in A and C, respectively, stimulated with increasing pacing frequency. The highlighted intervals (a, b) are magnified. (G) Exemplary trace of one twitch, normalized to its maximum force (Fmax) with schematic of assessed contraction parameters: time to peak (TTP), time to relaxation (TTR) and 90% contraction duration (CD90). (H) Normalized Fmax, TTP, TTR and CD90 at the assessed frequencies in the two examples shown in A (example with low ΔTT, i.e., dense t-system) and in C (example with high ΔTT, i.e., sparse t-system). Scale bar in A also applies to C, scale bar in B also applies to D.
FIGURE 2
FIGURE 2
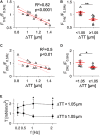
Association of the force-frequency relationship and wall tension with cardiomyocyte t-tubule distance in tissue slices from human failing hearts (n = 13). (A) Linear model showing the correlation of force at 1 Hz relative to force at 0.5 Hz pacing rate (F1Hz/F0.5Hz) with t-tubule distance (ΔTT). R2 is the coefficient of determination, p indicates the probability of type I error of linear regression. Dotted lines indicate 95% confidence intervals. (B) F1Hz/F0.5Hz in specimens with low (<1.05 μm, n = 7) and high ΔTT (≥ 1.05 μm, n = 7). Note that low ΔTT indicates high t-tubule density. (C) Correlation of force at 2 Hz relative to force at 0.5 Hz pacing rate (F2Hz/F0.5Hz) with ΔTT. (D) F2Hz/F0.5Hz in specimens with low and high ΔTT. (E) Mean wall tension (T) developed actively during contraction in specimens with low (squares) and high ΔTT (circles) at 0.2–2 Hz pacing frequency (f). *p < 0.05, **p < 0.01 (unpaired, two-tailed t-test, multiple comparison adjustment in E), error bars indicate SEM.
FIGURE 3
FIGURE 3
Association of the force-frequency relationship with expression levels of proteins involved in cardiomyocyte Ca2+ cycling. (A) Example images of Western blots of cardiac sodium-calcium exchanger (NCX1), cardiac sarco/endoplasmic reticulum Ca2+-ATPase (SERCA2), total phospholamban (PLB), phospho-S16 (pS16) PLB, phospho-T17 (pT17) PLB, and glyceraldehyde 3-phosphate dehydrogenase (GAPDH). (B) Linear model showing the correlation of force at 1 Hz relative to force at 0.5 Hz pacing rate (F1Hz/F0.5Hz) with NCX1 protein expression (normalized to a reference sample). R2 is the coefficient of determination, p indicates the probability of type I error of linear regression. Dotted lines indicate 95% confidence intervals. (C) Correlation of F1Hz/F0.5Hz with SERCA2 protein expression. (D) Correlation of F1Hz/F0.5Hz with total PLB protein expression. (E) Correlation of F1Hz/F0.5Hz with the ratio of SERCA2 to total PLB.
FIGURE 4
FIGURE 4
Association of contraction parameters at 1 Hz pacing rate with SERCA2/PLB ratio, t-tubule distance and NCX1 expression. Linear models showing the correlation of (A) time to peak (TTP), (B) time to relaxation (TTR), and (C) 90% contraction duration (CD90) with SERCA2/PLB, and of (D) TTP, (E) TTR and (F) CD90 with t-tubule distance (ΔTT). R2 is the coefficient of determination, p indicates the probability of type I error of linear regression. Dotted lines indicate 95% confidence intervals. (G) Correlation of TTR with NCX1. (H) Multivariate regression model combining ΔTT and the interaction of ΔTT with NCX (ΔTT + ΔTT:NCX) as predictors of TTR. The fitted model, TTR = 0.36⋅(ΔTT – 0.069⋅ < cps:it > NCX1 < /cps:it > ⋅ΔTT), explains the variance in TTR significantly better than simple linear models with only NCX1 (p < 0.001) or ΔTT (p = 0.01, likelihood ratio test).

References

    1. Brette F., Salle L., Orchard C. H. (2006). Quantification of calcium entry at the T-tubules and surface membrane in rat ventricular myocytes. Biophys. J. 90 381–389. 10.1529/biophysj.105.069013 - DOI - PMC - PubMed
    1. Brixius K., Wollmer A., Bolck B., Mehlhorn U., Schwinger R. H. (2003). Ser16-, but not Thr17-phosphorylation of phospholamban influences frequency-dependent force generation in human myocardium. Pflugers Arch. 447 150–157. 10.1007/s00424-003-1163-3 - DOI - PubMed
    1. Crossman D. J., Young A. A., Ruygrok P. N., Nason G. P., Baddelely D., Soeller C., et al. (2015). T-tubule disease: relationship between t-tubule organization and regional contractile performance in human dilated cardiomyopathy. J. Mol. Cell Cardiol. 84 170–178. 10.1016/j.yjmcc.2015.04.022 - DOI - PMC - PubMed
    1. Despa S., Brette F., Orchard C. H., Bers D. M. (2003). Na/Ca exchange and Na/K-ATPase function are equally concentrated in transverse tubules of rat ventricular myocytes. Biophys. J. 85 3388–3396. 10.1016/S0006-3495(03)74758-74754 - DOI - PMC - PubMed
    1. Endoh M. (2004). Force-frequency relationship in intact mammalian ventricular myocardium: physiological and pathophysiological relevance. Eur. J. Harmacol. 500 73–86. 10.1016/j.ejphar.2004.07.013 - DOI - PubMed