. 2020 Mar 13:11:262.
doi: 10.3389/fimmu.2020.00262. eCollection 2020.

Natural-Killer-Derived Extracellular Vesicles: Immune Sensors and Interactors

Affiliations

Natural-Killer-Derived Extracellular Vesicles: Immune Sensors and Interactors

Cristina Federici et al. Front Immunol. .

Abstract

Natural killer (NK) cells contribute to immunosurveillance and first-line defense in the control of tumor growth and metastasis diffusion. NK-cell-derived extracellular vesicles (NKEVs) are constitutively secreted and biologically active. They reflect the protein and genetic repertoire of originating cells, and exert antitumor activity in vitro and in vivo. Cancer can compromise NK cell functions, a status potentially reflected by their extracellular vesicles. Hence, NKEVs could, on the one hand, contribute to improve cancer therapy by interacting with tumor and/or immune cells and on the other hand, sense the actual NK cell status in cancer patients. Here, we investigated the composition of healthy donors' NKEVs, including NK microvesicles and exosomes, and their interaction with uncompromised cells of the immune system. To sense the systemic NK cell status in cancer patients, we developed an immune enzymatic test (NKExoELISA) that measures plasma NK-cell-derived exosomes, captured as tsg101+CD56+ nanovesicles. NKEV mass spectrometry and cytokine analysis showed the expression of NK cell markers, i.e., NKG2D and CD94, perforin, granzymes, CD40L, and other molecules involved in cytotoxicity, homing, cell adhesion, and immune activation, together with EV markers tsg101, CD81, CD63, and CD9 in both NK-derived exosomes and microvesicles. Data are available via Proteome Xchange with identifier PXD014894. Immunomodulation studies revealed that NKEVs displayed main stimulatory functions in peripheral blood mononuclear cells (PBMCs), inducing the expression of human leukocyte antigen DR isotype (HLA-DR) and costimulatory molecules on monocytes and CD25 expression on T cells, which was maintained in the presence of lipopolysaccharide (LPS) and interleukin (IL)-10/transforming growth factor beta (TGFβ), respectively. Furthermore, NKEVs increased the CD56+ NK cell fraction, suggesting that effects mediated by NKEVs might be potentially exploited in support of cancer therapy. The measurement of circulating NK exosomes in the plasma of melanoma patients and healthy donors evidenced lower levels of tsg101+CD56+ exosomes in patients with respect to donors. Likewise, we detected lower frequencies of NK cells in PBMCs of these patients. These data highlight the potential of NKExoELISA to sense alterations of the NK cell immune status.

Keywords: exosomes; extracellular vesicles; healthy donors; immunosurveillance; melanoma patients; microvesicles; natural killer cells.


Figures

Figure 1
Figure 1
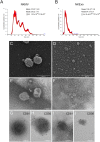
Morphological characterization of natural killer cell-derived extracellular vesicles (NKEVs). (A,B) Nanoparticle tracking analysis (NTA) analysis of NK-cell-derived microvesicle (NKMV) and NKExo. Representative spectra are shown, and mean, mode, and particles number/ml ([]/ml) are reported. (C,D) Scanning electron microscopy analysis of NKMV (C) and NKExo (D). Bars, 500 nm. (E,F) Transmission electron microscopy analysis of NKMV (E) and NKExo (F). Bars, 200 nm. (G–J) Immunoelectron microscopy combined with positive/negative contrast method of NKMV (G,H) and NKExo (I,J) revealed the presence of CD81 (G,I) and CD56 (H,J). Bars, 100 nm.
Figure 2
Figure 2
Proteomic analysis of proteins identified in natural killer (NK) cell total extract, NK-cell-derived microvesicle (NKMV) and NKExo. (A) Venn diagram of all identified proteins in NK cell total extract (TotExtr), NKMV, and NKExo. (B) Proteins identified in NKExo and NKMV samples compared with those present in Vesiclepedia database. (C,D) Proteins identified in NKExo (Exo) and NKMV (MV) samples compared with those present in the top 100 Exocarta (C) and in the whole Exocarta database (D). (E) Principal component analysis (PCA) of NKExo, NKMV, and TotExtr normalized protein abundances. (F) Hierarchical cluster analysis of the grouped abundances of NKExo, NKMV, and TotExtr scaled before clustering and using the euclidean function for the distance.
Figure 3
Figure 3
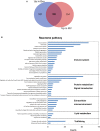
Analysis of proteins overexpressed in NKExo and/or NK-cell-derived microvesicle (NKMV). (A) Venn diagram displaying unique and shared overexpressed proteins in NKExo (Up in Exo) and NKMV (Up in MV). (B) Reactome pathway annotation of proteins overexpressed in NKExo and/or NKMV obtained by Search Tool for the Retrieval of Interacting Genes/Proteins (STRING). The number of proteins (counts) involved in each Gene Ontology (GO) term is displayed.
Figure 4
Figure 4
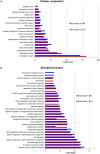
Analysis of proteins enriched in NKExo and/or NK-cell-derived microvesicles (NKMV). Gene Ontology (GO) annotation of proteins overexpressed in NKExo and identified in NKExo or NKExo plus NKMV (enriched in Exo) and proteins overexpressed in NKMV and identified in NKMV or in NKMV plus NKExo (enriched in MV). The significance [–log10(P-value)] for each GO term relative to cellular component (A) and biological process (B) is reported.
Figure 5
Figure 5
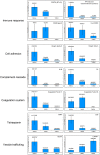
Protein abundances of specific proteins quantified by liquid chromatography–MS/MS (LC-MS/MS). Representative proteins grouped in the indicated categories are shown. Each panel shows the protein median abundance of the three replicates of NKExo, NK-cell-derived microvesicle (NKMV), NK total cell extract (TotExtr). The bars indicate the standard error for each sample group.
Figure 6
Figure 6
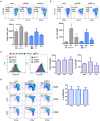
Cyto- and chemokine profiling natural killer cell-derived extracellular vesicles (NKEVs). (A) Cytokine bead array for the indicated soluble factors in NK-cell-derived microvesicle (NKMV) (M) and NKExo (E). (B) Granzyme B expression by cytometric bead array (CBA) assay in NKMV (MV) and NKExo (Exo). Results are shown for NKEVs produced by different healthy donors (n = 3). Statistical significance was achieved by paired t-test. Means ± SD are plotted, *p < 0.05; **p < 0.01; ***p < 0.001.
Figure 7
Figure 7
Effects of natural killer cell-derived extracellular vesicles (NKEVs) on T cells. (A) Flow cytometry analysis of CD25 expression by CD3+ gated T cells in peripheral blood mononuclear cells (PBMCs) evaluated after 72 h of culture with NK-cell-derived microvesicle (NKMV) and NKExo. Left panels: representative dot plots of a healthy donor. Right panel: the graph shows the results obtained with PBMCs of different healthy donors (n = 3), in the presence or absence of transforming growth factor beta (TGFβ)/interleukin (IL)-10 (10 ng/ml each). (B) Cytometric bead array (CBA)-measured cytokine production of 72 h PBMCs cultured as described in (A). (C) Geo mean fluorescence intensity (gMFI) of CD25 expression of CD3+ gated T cells in CD3/CD28 activated PBMCs in the presence or absence of NKMV and NKExo and/or TGFβ/IL-10 (10 ng/ml each). (D) PD-1 gMFI on gated CD3+ T cells as in (C). (E) Pearson correlation analysis of PD-1 gMFI and GRZB production. Results are shown for different healthy donors (n = 3). Statistical significance was achieved by paired t-test. Means ± SD are plotted, *p < 0.05; **p < 0.01.
Figure 8
Figure 8
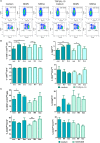
Effects of natural killer cell-derived extracellular vesicles (NKEVs) on monocytes. (A) Flow cytometry analysis of CD80–CD86 geo mean fluorescence intensity (gMFI) of gated CD14+ cells in peripheral blood mononuclear cells (PBMCs) cultured in the presence or absence of NK-cell-derived microvesicles (NKMV), NKExo, and/or lipopolysacharride (LPS) for 24 h. Upper panels: representative dot plots showing CD80–CD86 expression in the presence of NKMV and NKExo, lower panel: graphical summary of different healthy donors. (B) Flow cytometry of human leukocyte antigen DR isotype (HLA-DR) gMFI of CD14+ gated monocytes as in (A). Results for different donors (n = 3) are shown. (C) Effects of NKEVs on isolated monocytes, measured by flow cytometry after 24 h culture of CD14+ cells with NKMV or NKExo. Left panels: gMFI of CD80-86 and HLA-DR expression by monocytes of one healthy donor. Right panel: results from different healthy donors (n = 3). (D) Stimulatory potential of monocytes preconditioned with NKMV and NKExo. Left panels: flow cytometry analysis of 72 h proliferation and CD25 expression by CD3, CD4, and CD8 T cells cultured in the presence of monocytes (medium), monocytes preconditioned with NKMV or NKExo. Right panels: graphical summary showing results from different healthy donors (n = 3). Percentage of proliferation is indicated. Statistical significance was achieved by paired t test. Means ± SD are plotted, *p < 0.05.
Figure 9
Figure 9
Effects of natural killer cell-derived extracellular vesicles (NKEVs) on NK cells. (A) Upper panels: representative dot plots showing CD56+ total NK cells in the CD3negative lymphocyte gate after culturing PBMCs for 72 h in the presence or absence of NK-cell-derived microvesicle (NKMV) and NKExo and/or transforming growth factor beta (TGFβ)/interleukin (IL)-10 (10 ng/ml each). Lower panels: representative dot plots showing the percentage of NK cell subpopulations in the CD56+ gate for each culture condition as in upper panels: CD56bright, CD56dimCD16+, and CD56dimCD16neg NK cells. (B) Graphs show the results obtained for total NK cells and each subpopulation shown in (A) for different healthy donors (n = 3). (C) Graphs show total NK cells and NK subpopulations after 72 h culture of the CD14negative fraction in the presence or absence of NKMV or NKExo and/or CD3/CD28 stimulation. Results were obtained with cells from different donors (n = 3). Statistical significance was achieved by paired t test. Means ± SD are plotted, *p < 0.05; **p < 0.01.
Figure 10
Figure 10
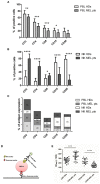
Characterization of circulating peripheral blood lymphocyte (PBL) and natural killer (NK) cells and quantification of plasma NKExo. (A) Immune phenotype analysis of freshly circulating PBL from healthy donor (HDs) and melanoma patients (MEL pts). (B) Immune phenotype analysis of 15 days-expanded NK cells from HDs and melanoma patients PBL. (C) Percent of indicated CD antigen expression in freshly PBL and 15 days expanded NK cells of HDs and melanoma patients. (D) Graphic scheme of “homemade” ELISA to detect and quantify NKExo in human plasma. ((E) Quantification of all circulating exosomes, by tsg-101 capture and CD9 detection and also of NKExo by tsg-101 capture and CD56 detection in plasma of HDs and melanoma patients, using the NKExoELISA test. Statistical significance was achieved by unpaired t test. Means ± SD are plotted, *p < 0.05; **p < 0.01; ***p < 0.001; ****p < 0.0001.

References

    1. Crinier A, Milpied P, Escalière B, Piperoglou C, Galluso J, Balsamo A, et al. . High-dimensional single-cell analysis identifies organ-specific signatures and conserved NK cell subsets in humans and mice. Immunity. (2018) 49:971–86.e5. 10.1016/j.immuni.2018.09.009 - DOI - PMC - PubMed
    1. Barrow AD, Martin CJ, Colonna M. The natural cytotoxicity receptors in health and disease. Front Immunol. (2019) 10:909. 10.3389/fimmu.2019.00909 - DOI - PMC - PubMed
    1. Caligiuri MA. Human natural killer cells. Blood. (2008) 112:461–9. 10.1182/blood-2007-09-077438 - DOI - PMC - PubMed
    1. Hodgins JJ, Khan ST, Park MM, Auer RC, Ardolino M. Killers 2.0: NK cell therapies at the forefront of cancer control. J Clin Invest. (2019) 129:3499–510. 10.1172/JCI129338 - DOI - PMC - PubMed
    1. Imai K, Matsuyama S, Miyake S, Suga K, Nakachi K. Natural cytotoxic activity of peripheral-blood lymphocytes and cancer incidence: an 11-year follow-up study of a general population. Lancet. (2000) 356:1795–9. 10.1016/S0140-6736(00)03231-1 - DOI - PubMed

Publication types

MeSH terms

Substances