. 2020 Mar 24:8:e8744.
doi: 10.7717/peerj.8744. eCollection 2020.

Dental characters used in phylogenetic analyses of mammals show higher rates of evolution, but not reduced independence

Affiliations

Dental characters used in phylogenetic analyses of mammals show higher rates of evolution, but not reduced independence

Neil Brocklehurst et al. PeerJ. .

Abstract

Accurate reconstructions of phylogeny are essential for studying the evolution of a clade, and morphological characters are necessarily used for the reconstruction of the relationships of fossil organisms. However, variation in their evolutionary modes (for example rate variation and character non-independence) not accounted for in analyses may be leading to unreliable phylogenies. A recent study suggested that phylogenetic analyses of mammals may be suffering from a dominance of dental characters, which were shown to have lower phylogenetic signal than osteological characters and produced phylogenies less congruent with molecularly-derived benchmarks. Here we build on this previous work by testing five additional morphological partitions for phylogenetic signal and examining what aspects of dental and other character evolution may be affecting this, by fitting models of discrete character evolution to phylogenies inferred and time calibrated using molecular data. Results indicate that the phylogenetic signal of discrete characters correlate most strongly with rates of evolution, with increased rates driving increased homoplasy. In a dataset covering all Mammalia, dental characters have higher rates of evolution than other partitions. They do not, however, fit a model of independent character evolution any worse than other regions. Primates and marsupials show different patterns to other mammal clades, with dental characters evolving at slower rates and being more heavily integrated (less independent). While the dominance of dental characters in analyses of mammals could be leading to inaccurate phylogenies, the issue is not unique to dental characters and the results are not consistent across datasets. Molecular benchmarks (being entirely independent of the character data) provide a framework for examining each dataset individually to assess the evolution of the characters used.

Keywords: Evolutionary Rates; Homoplasy; Independence; Mammals; Phylogeny.


Conflict of interest statement

The authors declare there are no competing interests.

Figures
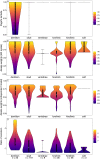
Figure 1
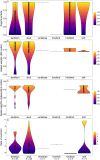
Figure 1. Violin plots illustrating results from the Bi et al. (2014) character matrix (total Mammalia).
(A) Pagel’s lambda values (phylogenetic signal) of each character. A value of 0 indicates no phylogenetic signal, while a value of 1 indicates high phylogenetic signal. (B) Akaike weights support for the ER model of evolution of each character. Characters with an Akaike weights score of 1 have equal rates of within-character evolution between each state, while characters with a score of 0 display unequal rates of within-character state evolution. (C) Akaike weights support for the independent model of evolution of all pairwise comparisons of characters in each partition. Pairwise comparisons that have an Akaike weights score of 1 evolve independently of one another, while pairwise comparisons with a score of 0 display character non-independence. (D) Rates of character evolution of each character (log10 transformed). The number of characters in each partition can be found at the base of the figure (n = X). For each partition, the horizontal spread of the violin plot represents the density of data at each point on the y-axis. Box plots with a white point representing the median are plotted within each violin plot. The heatmap is a visual representation of the y-axis.
Figure 2
Figure 2. Violin plots illustrating results from the Spaulding, O’Leary & Gatesy (2009) matrix (Artiodactyla).
(A) Pagel’s lambda values (phylogenetic signal) of each character. (B) Akaike weights support for the ER model of evolution of each character. (C) Akaike weights support for the independent model of evolution of all pairwise comparisons of characters in each partition. (D) Rates of character evolution of each character (log10 transformed). The number of characters in each partition can be found at the base of the figure (n = X).
Figure 3
Figure 3. Results from the Tomiya (2010) matrix (Carnivora).
(A) Pagel’s lambda values (phylogenetic signal) of each character. (B) Akaike weights support for the ER model of evolution of each character. (C) Akaike weights support for the independent model of evolution of all pairwise comparisons of characters in each partition. (D) Rates of character evolution of each character (log10 transformed). The number of characters in each partition can be found at the base of the figure (n = X).
Figure 4
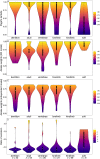
Figure 4. Violin plots illustrating results from the Ni et al. (2013) matrix (Primates).
(A) Pagel’s lambda values (phylogenetic signal) of each character. (B) Akaike weights support for the ER model of evolution of each character. (C) Akaike weights support for the independent model of evolution of all pairwisee comparisons of characters in each partition. (D) Rates of character evolution of each character (log10 transformed). The number of characters in each partition can be found at the base of the figure (n = X).
Figure 5
Figure 5. Violin plots illustrating results from the Beck (2017) matrix (Marsupialia).
(A) Pagel’s lambda values (phylogenetic signal) of each character. (B) Akaike weights support for the ER model of evolution of each character. (C) Akaike weights support for the independent model of evolution of all pairwise comparisons of characters in each partition. (D) Rates of character evolution of each character (log10 transformed). The number of characters in each partition can be found at the base of the figure (n = X).

References

    1. Beck RM. The skull of Eepidolops ameghinoi from the early Eocene Itaboraí fauna, southeastern Brazil, and the affinities of the extinct marsupialiform order Polydolopimorphia. Journal of Mammalian Evolution. 2017;24:373–414. doi: 10.1007/s10914-016-9357-6. - DOI - PMC - PubMed
    1. Bi S, Wang Y, Guan J, Meng J. Three new Jurassic euharamiyidan species reinforce early divergence of mammals. Nature. 2014;514:579–584. doi: 10.1038/nature13718. - DOI - PubMed
    1. Billet G, Bardin J. Serial homology and correlated characters in morphological phylogenetics: modelling the evolution of dental crests in placentals. Systematic Biology. 2018 (In Press) - PubMed
    1. Dávalos LM, Velazco PM, Warsi OM, Smits PD, Simmons NB. Integrating incomplete fossils by isolating conflicting signal in saturated and non-independent morphological characters. Systematic Biology. 2014;63:582–600. doi: 10.1093/sysbio/syu022. - DOI - PubMed
    1. DeGusta D. A method for estimating the relative importance of characters in cladistic analyses. Systematic Biology. 2004;53:529–532. doi: 10.1080/10635150490470320. - DOI - PubMed

LinkOut - more resources