. 2020 Mar 13:10:326.
doi: 10.3389/fonc.2020.00326. eCollection 2020.

Gastric Cancer Cell-Derived Exosomal microRNA-23a Promotes Angiogenesis by Targeting PTEN

Affiliations

Gastric Cancer Cell-Derived Exosomal microRNA-23a Promotes Angiogenesis by Targeting PTEN

Jiang Du et al. Front Oncol. .

Erratum in

Abstract

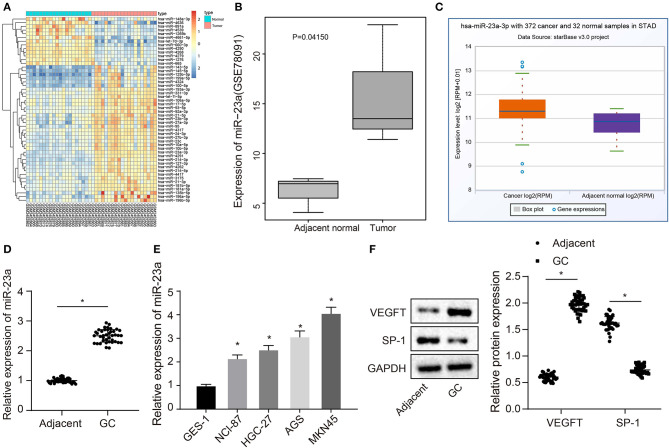
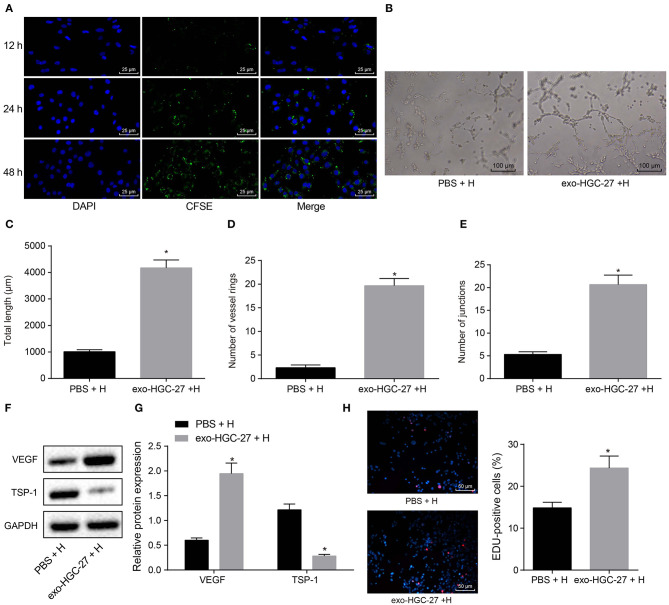
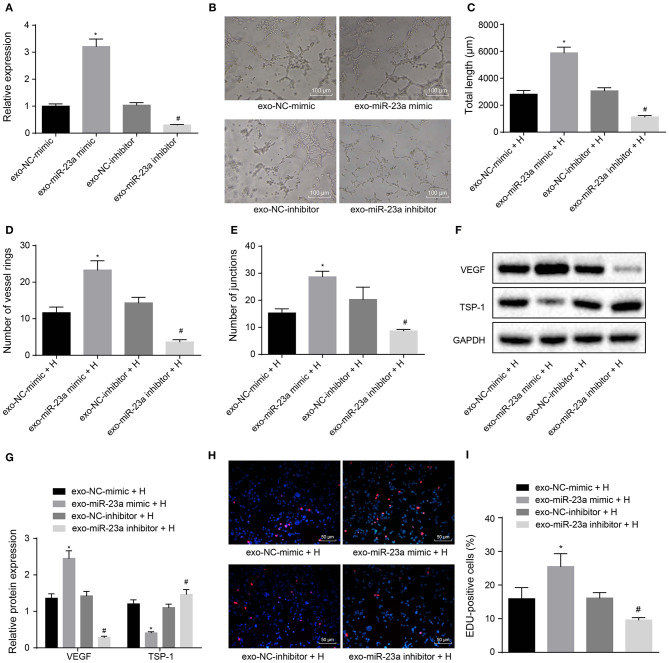
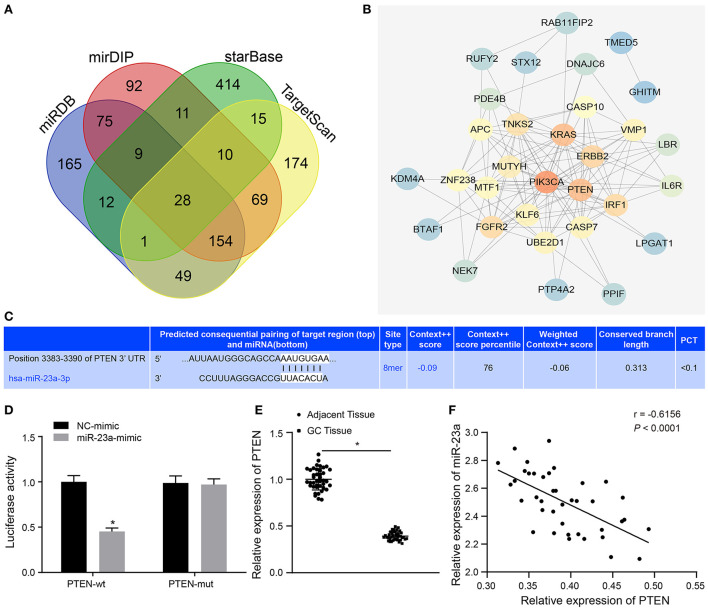
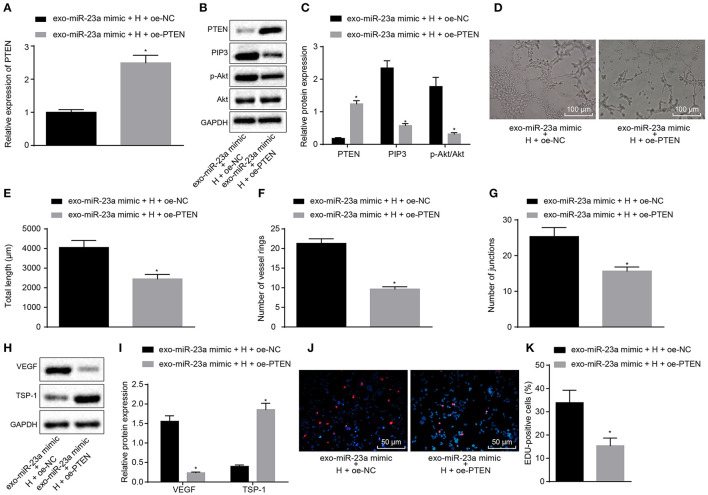
Hypoxia-exposed lung cancer-released exosomal microRNA-23a (miR-23a) has been shown to enhance angiogenesis as well as vascular permeability, contributing to the close correlation between exosomal miR-23a and tumorigenesis. The current study aimed to investigate whether gastric cancer (GC) cell-derived exosomal miR-23a could induce angiogenesis and to elucidate the potential mechanisms associated with the process. Differentially expressed miRNAs in GC were initially screened from the Gene Expression Omnibus database. Target genes were selected following miRNA-mRNA prediction and subsequently verified by dual luciferase reporter assay. RT-qPCR was conducted to detect miR-23a and PTEN expression in GC tissues, cells and exosomes. Human umbilical venous endothelial cells (HUVECs) were co-cultured with GC cell-derived exosomes to assess the angiogenesis mediated by exosomes in vitro. Additionally, PTEN was overexpressed in HUVECs to analyze the mechanism by which miR-23a regulates angiogenesis. miR-23a was highly expressed in GC tissues and cells and GC cell-derived exosomes. Angiogenesis was promoted by the co-culture of HUVECs and GC cells-derived exosomes, as evidenced by the increased expression of VEGF but decreased expression of TSP-1. PTEN was targeted by miR-23a and was lowly expressed in GC tissues. In a co-culture system, miR-23a carried by GC cells-derived exosomes promoted angiogenesis via the repression of PTEN. Collectively, GC cell-derived exosomal miR-23a could promote angiogenesis and provide blood supply for growth of GC cells. This study contributes to advancement of miRNA-targeted therapeutics.

Keywords: AKT pathway; PTEN; angiogenesis; exosome; gastric cancer; microRNA-23a.


Figures

Figure 1
Figure 1
miR-23a is expressed highly in GC tissues and cells. (A) Differentially expressed miRNAs in the dataset GSE93415, the abscissa represents the sample number, the ordinate represents the names of miRNA, and the left dendrogram indicates the miRNA expression cluster. Each rectangle represents the expression of a miRNA in a sample. (B) Expression of miR-23a in the dataset GSE78091, the abscissa refers to the sample type, the ordinate refers to the expression of miRNA, the left box plot refers to the normal sample, and the right box plot refers to the tumor sample. (C) The expression of miR-23a in the tumor sample (left box) and normal sample (right box) in the TCGA database. (D) Determination of miR-23a expression in GC tissues and adjacent normal tissues by RT-qPCR. (E) Determination of miR-23a expression in human gastric normal mucosal epithelial cell line and GC cell lines by RT-qPCR. (F) Western blot analysis of VEGF and TSP-1 proteins in GC tissues and adjacent normal tissues. Measurement data were expressed as mean ± standard deviation. Data between two groups were compared using paired t-test (n = 40). Comparisons among multiple groups were conducted by one-way ANOVA with Tukey's post hoc test. The experiment was repeated three times independently. *p < 0.05, there was statistical difference.
Figure 2
Figure 2
miR-23a exists in the exosomes derived from GC cells. (A) Observation of exosome morphology by transmission electron microscope (scale bar = 100 nm), red arrows refer to exosome. (B) Nanoparticle size analysis of exosomes. (C) Western blot analysis of TSG101, CD63 and Alix proteins in isolated exosomes. (D) Determination of miR-23a expression in exosomes isolated from normal gastric cell lines and GC cell lines by RT-qPCR. *p < 0.05 vs. GSE-1 cell line. Measurement data were expressed as mean ± standard deviation. Comparisons among multiple groups were conducted by one-way ANOVA with Tukey's post hoc test. The experiment was repeated three times independently.
Figure 3
Figure 3
Exosomes derived from GC cells enhances angiogenesis of HUVECs in a co-culture system. (A) Internalization of exosomes by HUVECs observed under laser confocal microscope (×400). (B–E) Tube formation (×100), tube length, loop number and tube nodes in HUVECs after co-culture with exosomes or PBS. (F,G) Western blot analysis of VEGF and TSP-1 proteins. (H) The proliferation of HUVECs assessed by EdU labeling (×200). *p < 0.05 vs. HUVECs co-cultured with PBS. The data in the figure were measurement data, which were expressed as mean ± standard deviation. If the data were in compliance with normal distribution and homogeneity, comparisons between two groups were conducted using unpaired t-test. The experiment was repeated three times independently.
Figure 4
Figure 4
GC cells-derived exosomal miR-23a promotes in vitro angiogenesis. HGC-27 cells were transfected with miR-23a mimic or inhibitor and their derived exosomes were co-cultured with HUVECs. (A) RT-qPCR determination of miR-23a expression. (B) Representative images of the tube formation in HUVECs (×100). (C–E) The tube length, number of loops and nodes of HUVECs. (F,G) Western blot analysis of VEGF and TSP-1 proteins. (H,I) Representative images of EdU-positive cells and proliferation rate of HUVECs (×200). *p < 0.05 vs. HUVECs co-cultured with exosomes derived from NC-mimic-transfected HGC-27 cells. #p < 0.05 vs. HUVECs co-cultured with exosomes derived from NC inhibitor-transfected HGC-27 cells. Measurement data were expressed as mean ± standard deviation. If the data were in compliance with normal distribution and homogeneity, comparisons between two groups were conducted using unpaired t-test. The experiment was repeated three times independently.
Figure 5
Figure 5
miR-23a targets PTEN and negatively regulated its expression. (A) Intersection of predicted target genes of miR-23a based on the results of four databases, where the middle part represents the intersection. (B) Correlation analysis of the known genes related to GC with target genes of miR-23a. Each small circle in the figure represents a gene, and the line between the circles indicates the interaction between two genes. (C) The predicted binding sites of miR-23a on the PTEN by TargetScan website. (D) The binding relationship between miR-23a and PTEN confirmed by dual-luciferase reporter gene assay. (E) PTEN expression in GC tissues and adjacent normal tissues detected by RT-qPCR. (F) Correlation between miR-23a and PTEN expression analyzed by Pearson. *p < 0.05 vs. cells transfected with NC-mimic. Measurement data were expressed as mean ± standard deviation. If the data were in compliance with normal distribution and homogeneity, comparisons between two groups were conducted using unpaired t-test. The experiment was repeated three times independently.
Figure 6
Figure 6
GC cell-derived exosomal miR-23a accelerates angiogenesis through inhibition of PTEN expression. (A) Determination of PTEN mRNA expression by RT-qPCR. (B,C) Western blot analysis of PTEN, PIP3, phosphorylated Akt and Akt proteins. (D) Representative images of the tube formation in HUVECs (×100). (E–G) The tube length, number of loops and nodes in HUVECs. (H,I) Western blot analysis of VEGF and TSP-1 proteins in HUVECs. (J,K) The proliferation of HUVECs assessed by EdU assay (×200). *p < 0.05 vs. HUVECs co-cultured with exosomes derived from miR-23a-mimic and oe-NC-transfected HGC-27 cells. Measurement data were expressed as mean ± standard deviation. If the data were in compliance with normal distribution and homogeneity, comparisons between two groups were conducted using unpaired t-test. The experiment was repeated three times independently.

Similar articles

Cited by

References

    1. Chia NY, Tan P. Molecular classification of gastric cancer. Ann Oncol. (2016) 27:763–9. 10.1093/annonc/mdw040 - DOI - PubMed
    1. Bray F, Ferlay J, Soerjomataram I, Siegel RL, Torre LA, Jemal A. Global cancer statistics 2018: GLOBOCAN estimates of incidence and mortality worldwide for 36 cancers in 185 countries. CA Cancer J Clin. (2018) 68:394–424. 10.3322/caac.21492 - DOI - PubMed
    1. Van Cutsem E, Sagaert X, Topal B, Haustermans K, Prenen H. Gastric cancer. Lancet. (2016) 388:2654–64. 10.1016/S0140-6736(16)30354-3 - DOI - PubMed
    1. Betzer O, Perets N, Angel A, Motiei M, Sadan T, Yadid G, et al. . In vivo neuroimaging of exosomes using gold nanoparticles. ACS Nano. (2017) 11:10883–93. 10.1021/acsnano.7b04495 - DOI - PubMed
    1. Mrowczynski OD, Zacharia BE, Connor JR. Exosomes and their implications in central nervous system tumor biology. Prog Neurobiol. (2019) 172:71–83. 10.1016/j.pneurobio.2018.06.006 - DOI - PubMed