

RNA-Seq Revealed a Circular RNA-microRNA-mRNA Regulatory Network in Hantaan Virus Infection
- PMID: 32232013
- PMCID: PMC7083127
- DOI: 10.3389/fcimb.2020.00097
RNA-Seq Revealed a Circular RNA-microRNA-mRNA Regulatory Network in Hantaan Virus Infection
Abstract
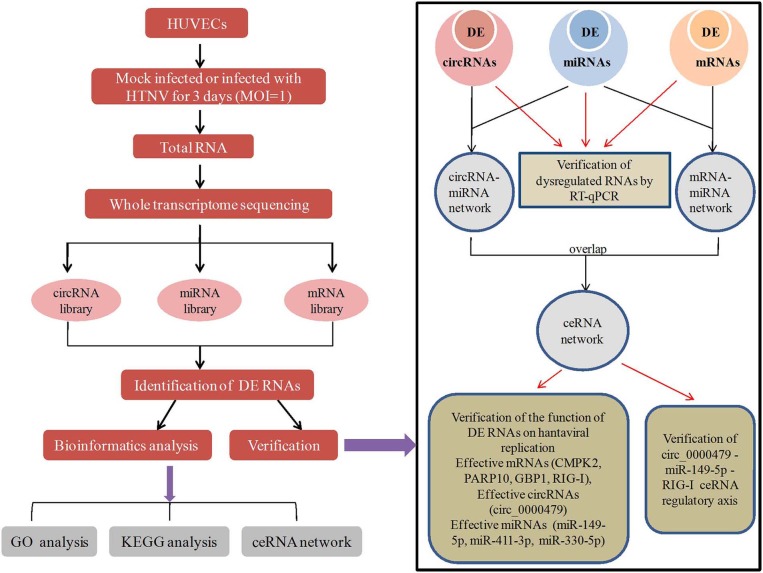
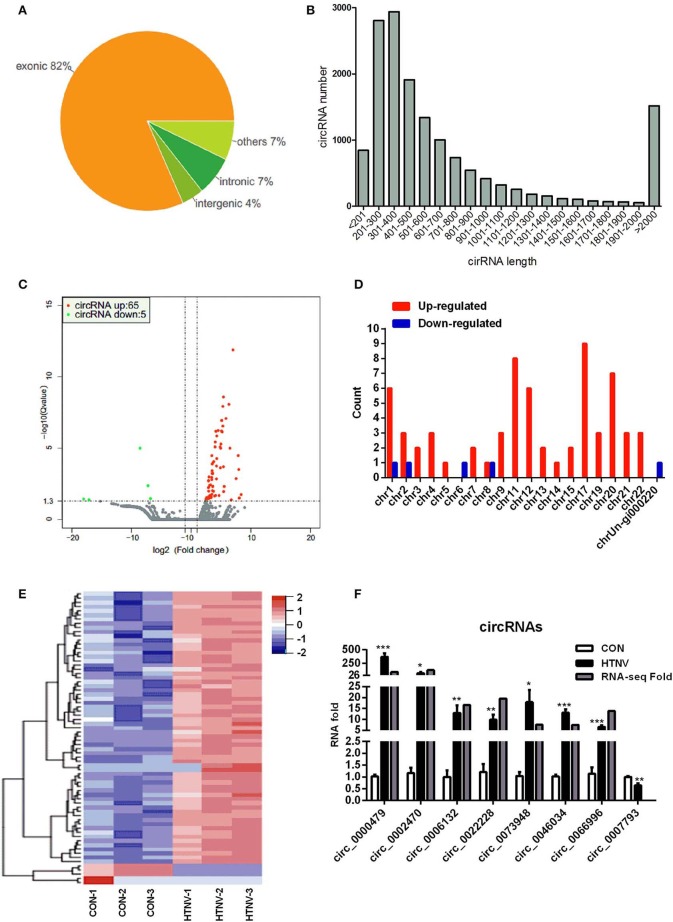
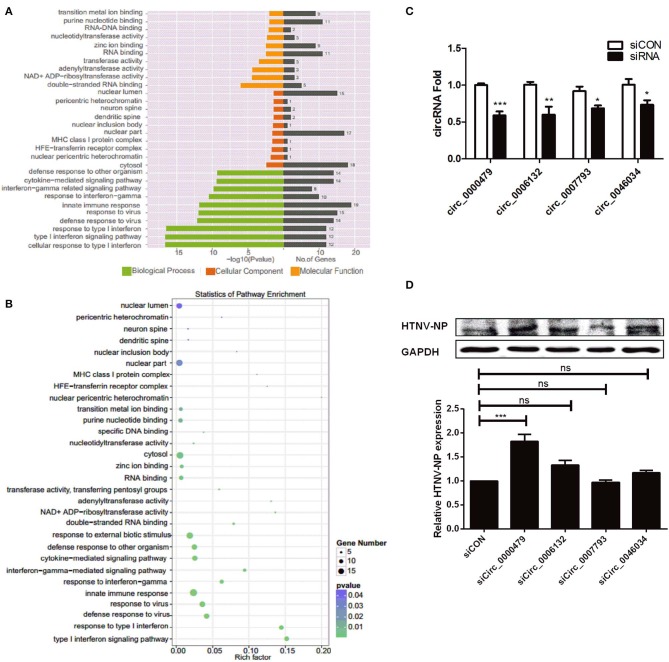
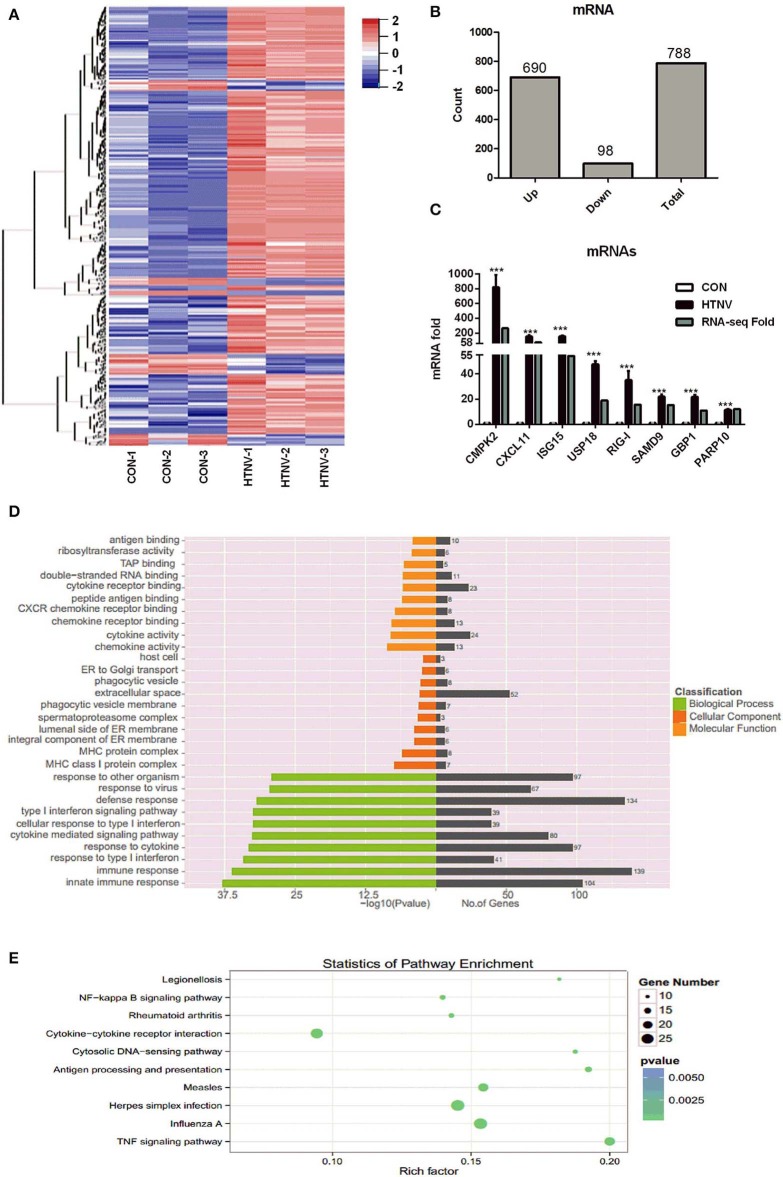
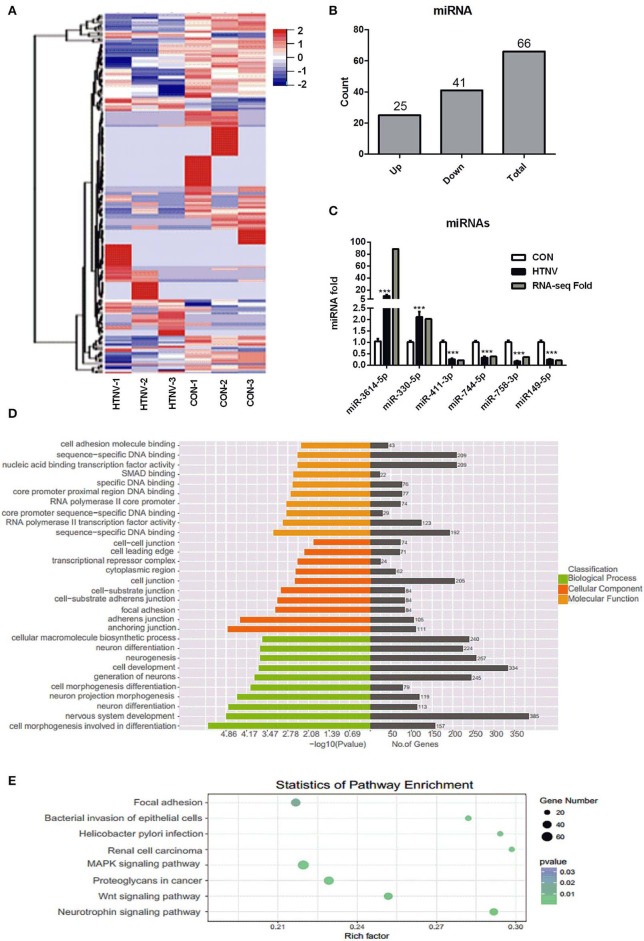
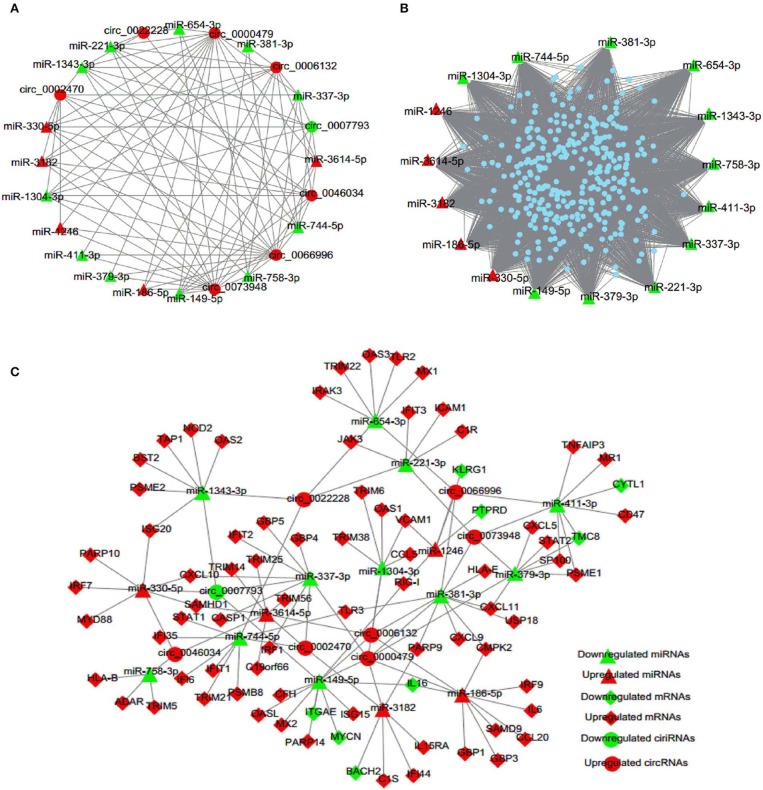
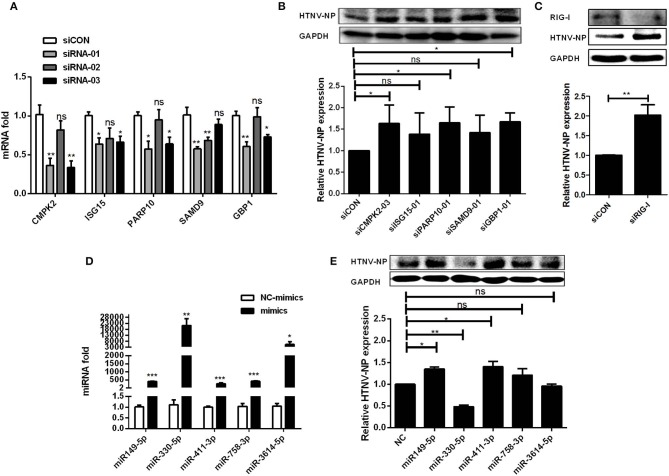
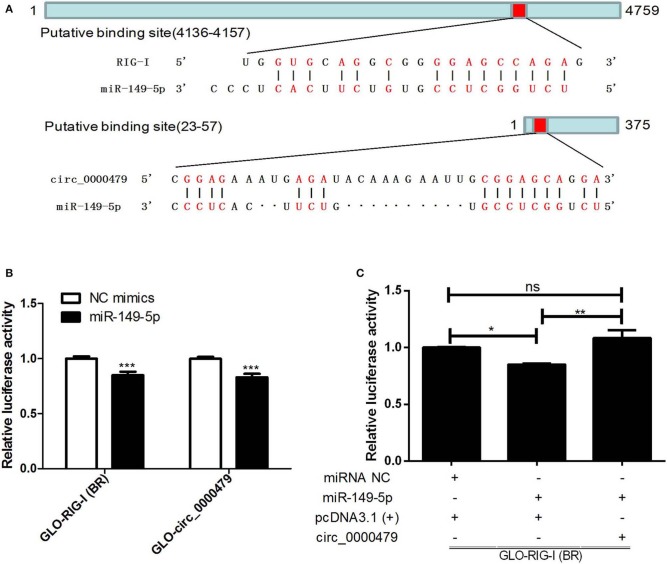
Hantaan virus (HTNV), a Hantavirus serotype that is prevalent in Asia, causes hemorrhagic fever with renal syndrome (HFRS) with high mortality in human race. However, the pathogenesis of HTNV infection remains elusive. Circular RNAs (circRNAs), a new type of non-coding RNAs, play a crucial role in various pathogenic processes. Nevertheless, circRNA expression profiles and their effects on pathogenesis of HTNV infection are still completely unknown. In the present study, RNA sequencing was performed to analyze the circRNA, microRNA (miRNA), and mRNA expression profiles in HTNV-infected and mock-infected human umbilical vein endothelial cells (HUVECs). A total of 70 circRNAs, 66 miRNAs, and 788 mRNAs were differently expressed. Several differentially expressed RNAs were validated by RT-qPCR. Moreover, we verified that some differentially expressed RNAs, such as circ_0000479, miR-149-5p, miR-330-5p, miR-411-3p, RIG-I, CMPK2, PARP10, and GBP1, promoted or inhibited HTNV replication. Gene Ontology (GO) and Kyoto Encyclopedia of Genes and Genomes (KEGG) enrichment analysis demonstrated that the host genes of differentially expressed circRNAs were principally involved in the innate immune response, the type I interferon (IFN) signaling pathway, and the cytokine-mediated signaling pathway. Additionally, the circRNA-miRNA-mRNA regulatory network was integrally analyzed. The data showed that there were many circRNA-miRNA-mRNA interactions in HTNV infection. By dual-luciferase reporter assay, we confirmed that circ_0000479 indirectly regulated RIG-I expression by sponging miR-149-5p, hampering viral replication. This study for the first time presents a comprehensive overview of circRNAs induced by HTNV and reveals that a network of enriched circRNAs and circRNA-associated competitive endogenous RNAs (ceRNAs) is involved in the regulation of HTNV infection, thus offering new insight into the mechanisms underlying HTNV-host interaction.
Keywords: HTNV; cellular response changes; circular RNA; competing endogenous RNA network; microRNA; viral replication.
Copyright © 2020 Lu, Zhu, Guo, Wang, Li, Yan, Jiang, Han, Xiang, Wu, Liu, Xiong, Chen, Gong, Luo and Hou.
Figures
Similar articles
-
Comprehensive circRNA-microRNA-mRNA network analysis revealed the novel regulatory mechanism of Trichosporon asahii infection.Mil Med Res. 2021 Mar 9;8(1):19. doi: 10.1186/s40779-021-00311-w. Mil Med Res. 2021. PMID: 33750466 Free PMC article.
-
Identification of the circRNA-miRNA-mRNA Regulatory Network in Pterygium-Associated Conjunctival Epithelium.Biomed Res Int. 2022 Nov 8;2022:2673890. doi: 10.1155/2022/2673890. eCollection 2022. Biomed Res Int. 2022. PMID: 36398070 Free PMC article.
-
Comprehensive analysis of the circRNA expression profile and circRNA-miRNA-mRNA network in the pathogenesis of EV-A71 infection.Virus Res. 2021 Oct 2;303:198502. doi: 10.1016/j.virusres.2021.198502. Epub 2021 Jul 9. Virus Res. 2021. PMID: 34252490
-
Interactions between circRNAs and miR-141 in Cancer: From Pathogenesis to Diagnosis and Therapy.Int J Mol Sci. 2023 Jul 24;24(14):11861. doi: 10.3390/ijms241411861. Int J Mol Sci. 2023. PMID: 37511619 Free PMC article. Review.
-
circRNA-miRNA-mRNA in breast cancer.Clin Chim Acta. 2021 Dec;523:120-130. doi: 10.1016/j.cca.2021.09.013. Epub 2021 Sep 16. Clin Chim Acta. 2021. PMID: 34537217 Review.
Cited by
-
Comprehensive identification of RNA transcripts and construction of RNA network in chronic obstructive pulmonary disease.Respir Res. 2022 Jun 11;23(1):154. doi: 10.1186/s12931-022-02069-8. Respir Res. 2022. PMID: 35690768 Free PMC article.
-
Influenza A Virus-Induced circRNA circMerTK Negatively Regulates Innate Antiviral Responses.Microbiol Spectr. 2023 Feb 27;11(2):e0363722. doi: 10.1128/spectrum.03637-22. Online ahead of print. Microbiol Spectr. 2023. PMID: 36847523 Free PMC article.
-
Cytostatic Activity of Sanguinarine and a Cyanide Derivative in Human Erythroleukemia Cells Is Mediated by Suppression of c-MET/MAPK Signaling.Int J Mol Sci. 2023 Apr 30;24(9):8113. doi: 10.3390/ijms24098113. Int J Mol Sci. 2023. PMID: 37175820 Free PMC article.
-
Mapping CircRNA-miRNA-mRNA regulatory axis identifies hsa_circ_0080942 and hsa_circ_0080135 as a potential theranostic agents for SARS-CoV-2 infection.PLoS One. 2023 Apr 13;18(4):e0283589. doi: 10.1371/journal.pone.0283589. eCollection 2023. PLoS One. 2023. PMID: 37053191 Free PMC article.
-
MiR-130c-5p targets the SHVV n gene and upregulates immune cytokines (IL-6, IL-22, IL-1β) to inhibit viral replication.Front Immunol. 2024 Nov 1;15:1486816. doi: 10.3389/fimmu.2024.1486816. eCollection 2024. Front Immunol. 2024. PMID: 39555085 Free PMC article.
References
-
- Balan V., Nelson D. R., Sulkowski M. S., Everson G. T., Lambiase L. R., Wiesner R. H., et al. . (2006). Modulation of interferon-specific gene expression by albumin-interferon-alpha in interferon-alpha-experienced patients with chronic hepatitis C. Antivir. Ther. 11, 901–908. - PubMed
Publication types
MeSH terms
Substances
LinkOut - more resources
Full Text Sources
Medical
Molecular Biology Databases