. 2020 Mar 13:8:153.
doi: 10.3389/fcell.2020.00153. eCollection 2020.

Upregulation of RND3 Affects Trophoblast Proliferation, Apoptosis, and Migration at the Maternal-Fetal Interface

Affiliations

Upregulation of RND3 Affects Trophoblast Proliferation, Apoptosis, and Migration at the Maternal-Fetal Interface

Xiao-Ling Ma et al. Front Cell Dev Biol. .

Abstract

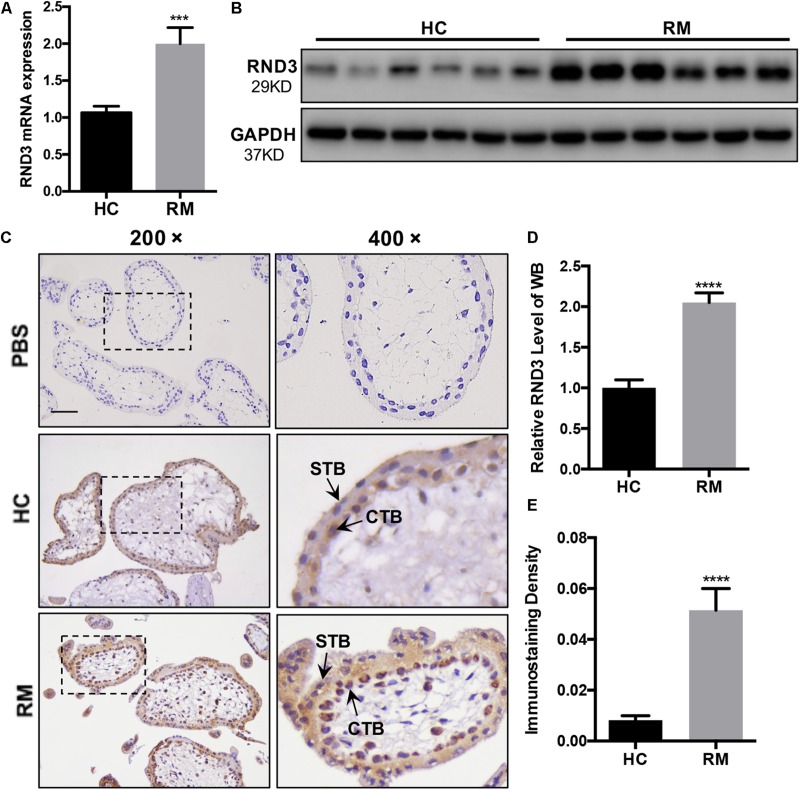
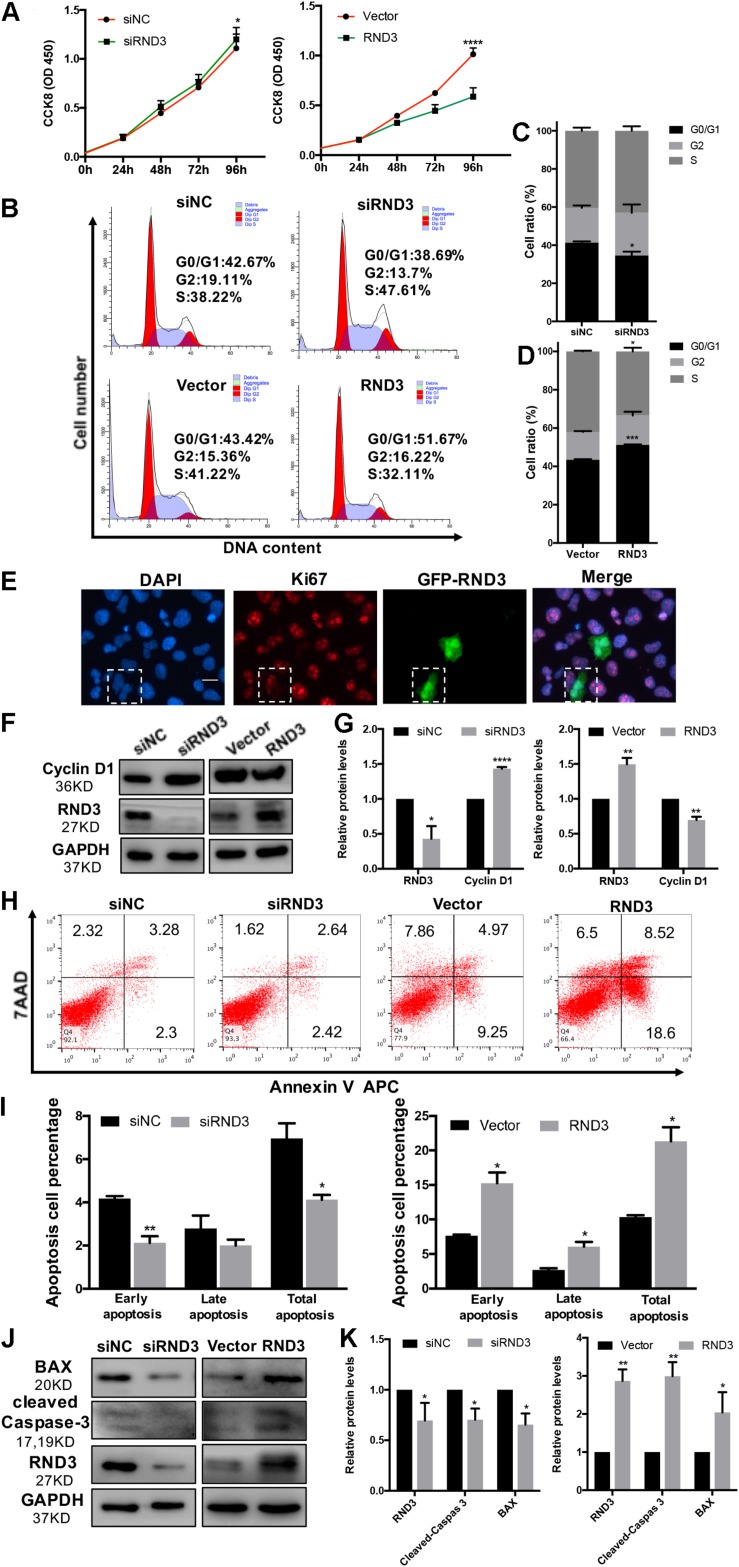
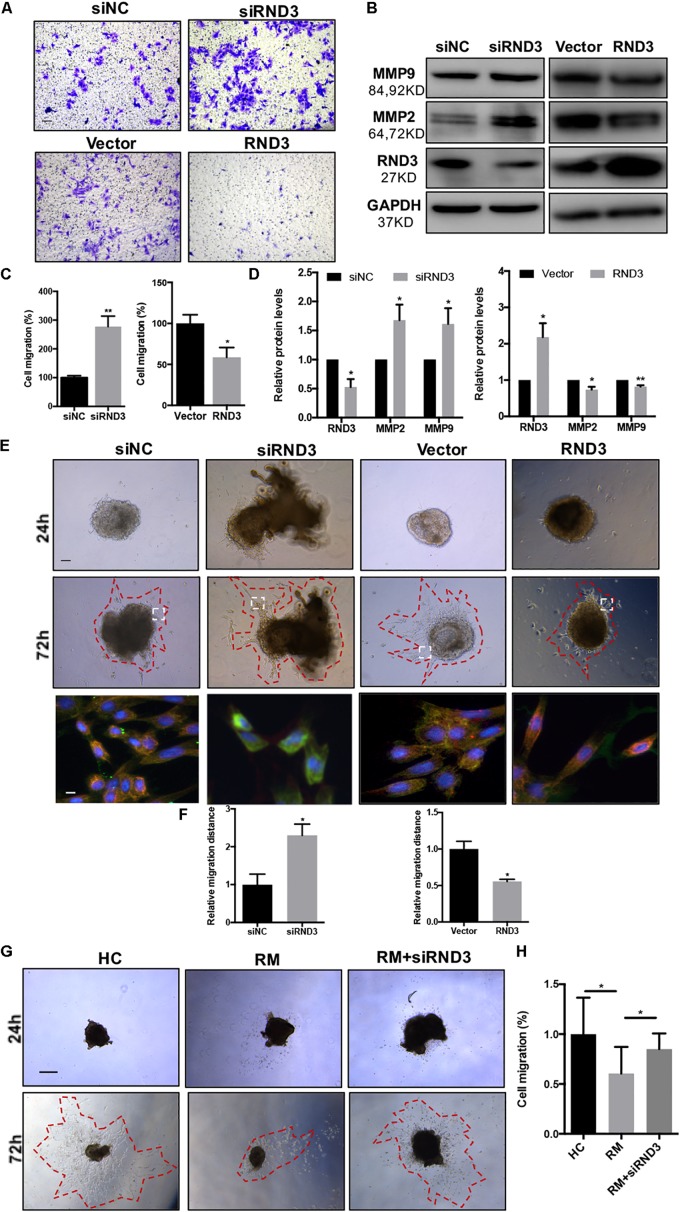
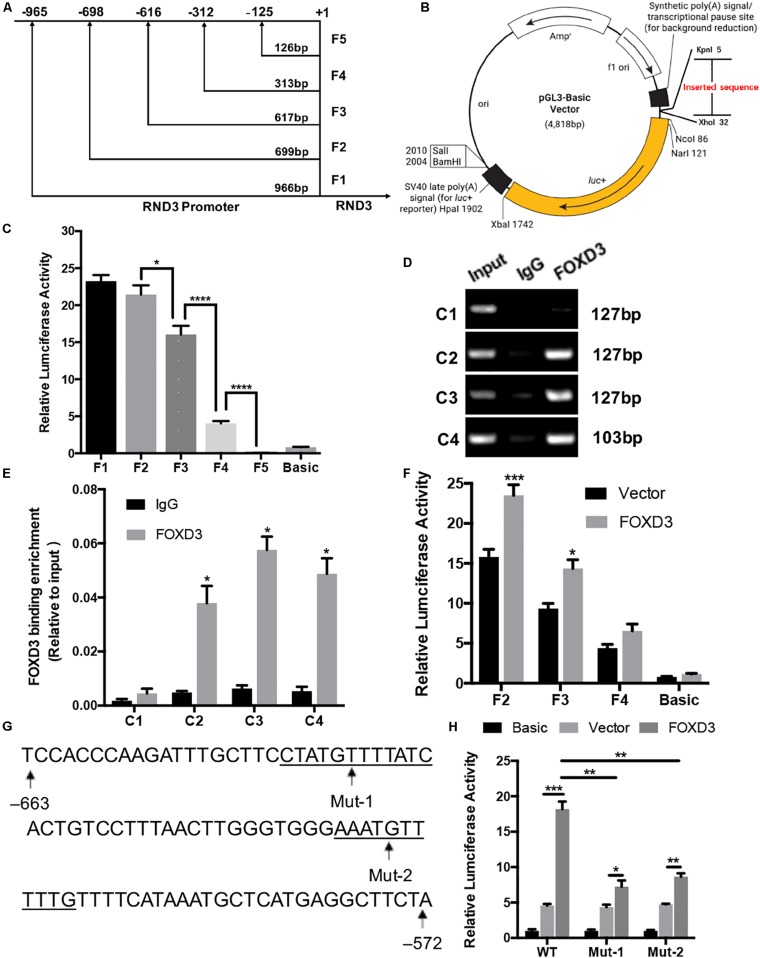
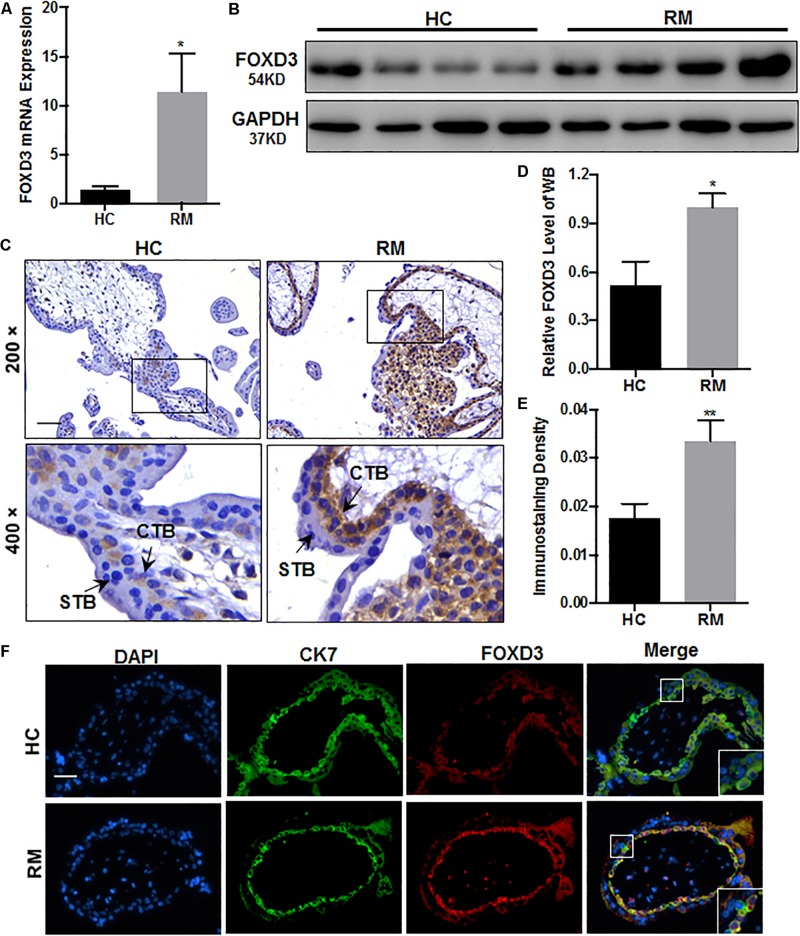
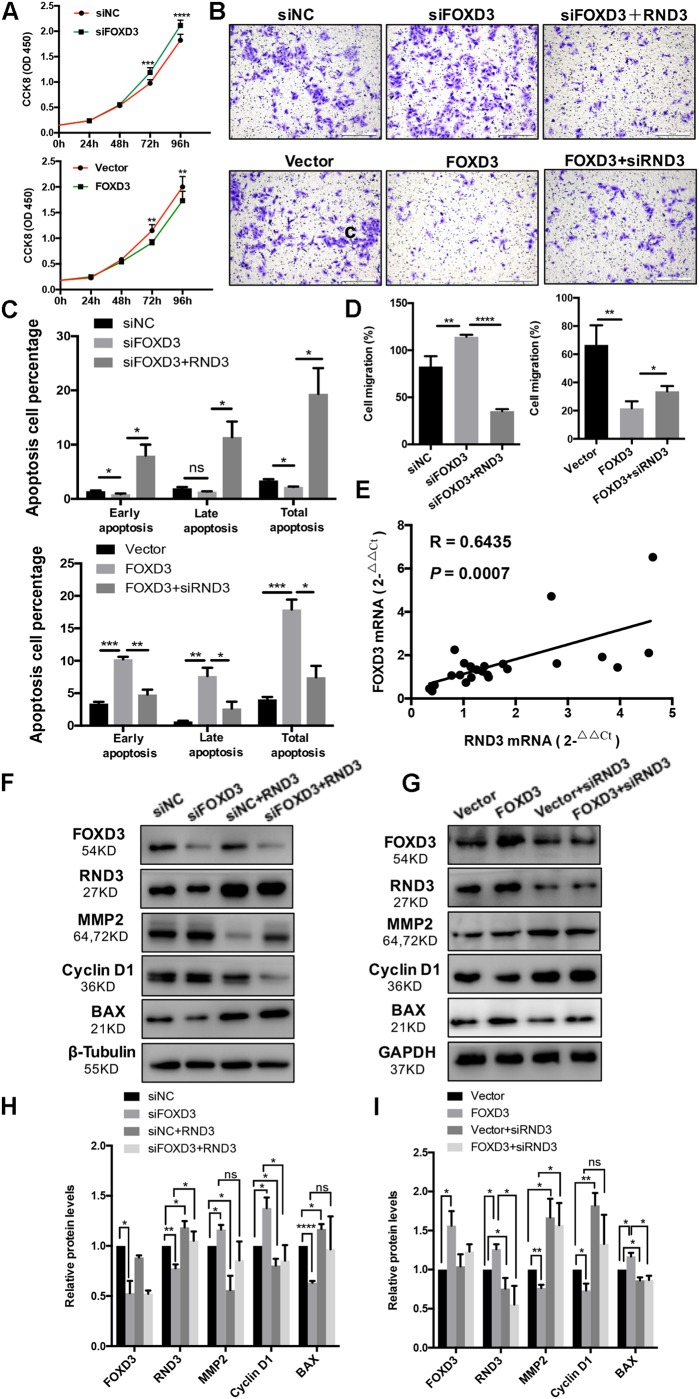
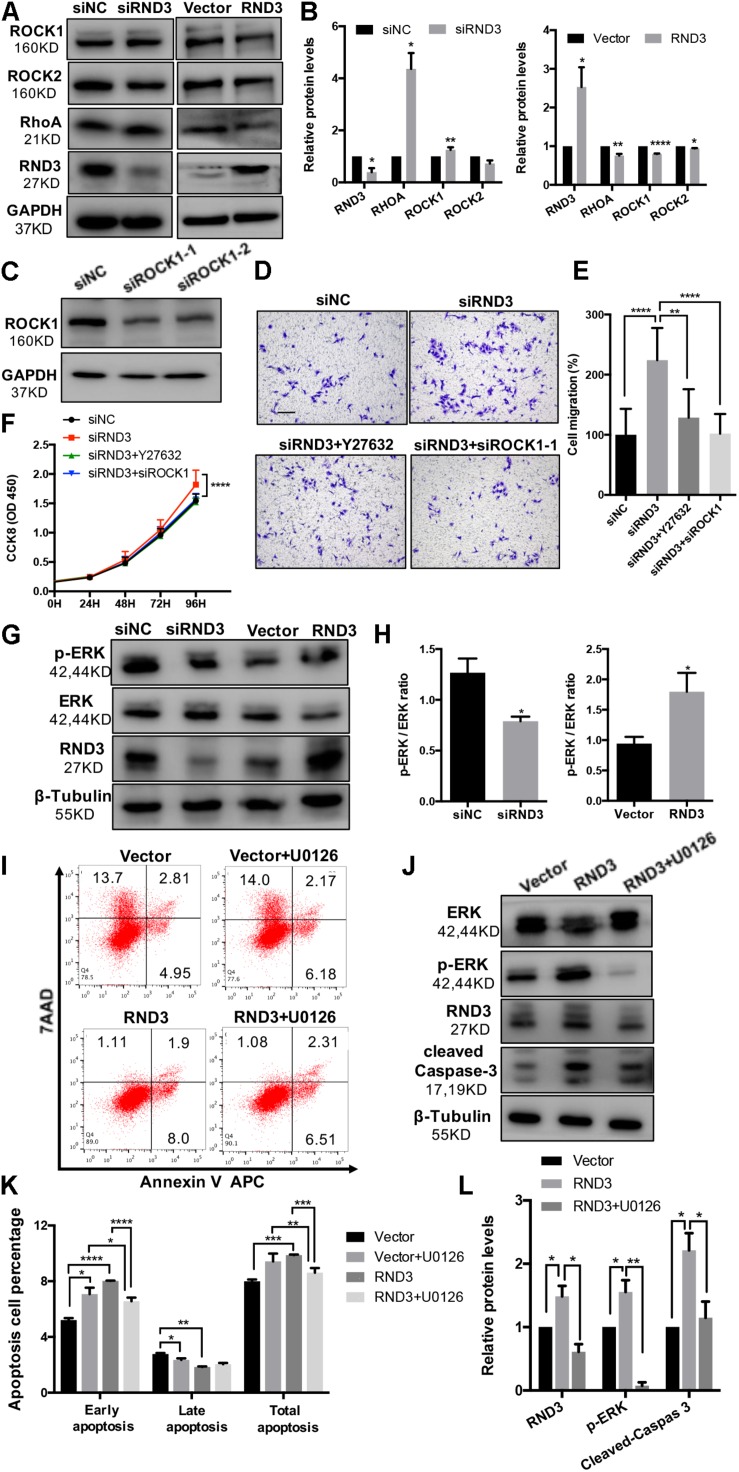
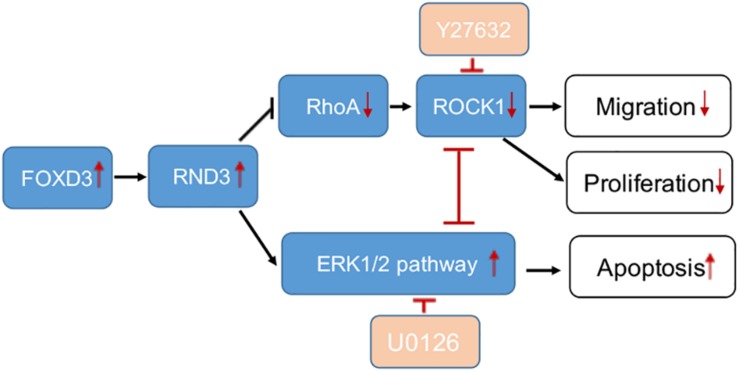
Trophoblasts as the particular cells of the placenta play an important role in implantation and formation of the maternal-fetal interface. RND3 (also known as RhoE) is a unique member of the Rnd subfamily of small GTP-binding proteins. However, its function in cytotrophoblasts (CTBs) at the maternal-fetal interface is poorly understood. In the present study, we found that RND3 expression was significantly increased in trophoblasts from the villous tissues of patients with recurrent miscarriage (RM). RND3 inhibited proliferation and migration and promoted apoptosis in HTR-8/SVneo cells. Using dual-luciferase reporter and chromatin immunoprecipitation assays, we found that forkhead box D3 (FOXD3) is a key transcription factor that binds to the RND3 core promoter region and regulates RND3 expression. Here, the level of FOXD3 was upregulated in the first-trimester CTBs of patients with RM, which in turn mediated RND3 function, including inhibition of cell proliferation and migration and promotion of apoptosis. Further, we found that RND3 regulates trophoblast migration and proliferation via the RhoA-ROCK1 signaling pathway and inhibits apoptosis via ERK1/2 signaling. Taken together, our findings suggest that RND3 and FOXD3 may be involved in pathogenesis of RM and may serve as potential therapeutic targets.

Keywords: ERK1/2; FOXD3; RND3; ROCK; recurrent miscarriage; trophoblast.


Figures

FIGURE 1
FIGURE 1
RND3 is upregulated in first-trimester placental CTB in patients with RM. (A,B,D) RND3 expression in first-trimester human villi tissues from patients with RM or HC was determined using qRT-PCR (n = 11) and western blot analysis (n = 6). (C,E) Immunohistochemical analysis of paraffin-embedded villous tissues showed that RND3 expression was increased in patients with RM compared with that in HC (n = 18). Scale bar = 100 μm. (D) Histogram showing the relative expression level of RND3 protein in HTR-8 cells as determined using ImageJ software. (E) The staining intensity of RND3 in both CTB and STB in paraffin-embedded villous tissues was quantified using Image-Pro Plus 6.0. CTB, cytotrophoblast; STB, syncytiotrophoblast. ***P < 0.001, ****P < 0.0001 vs. HC.
FIGURE 2
FIGURE 2
RND3 inhibits trophoblast proliferation, blocks G1 phase cell cycle progression and promotes HTR-8 cell apoptosis. (A) CCK-8 cell proliferation assay of RND3 knockdown and RND3-overexpressing HTR-8 cells and their respective control groups. (B–D) Cell cycle assay of RND3 knockdown and RND3-overexpressing HTR-8 cells and their respective control groups. The proliferation rate of cells in each phase was assessed. (E) Immunofluorescence staining with GFP-RND3 (green), Ki-67 (red), and DAPI (blue). Original magnification: ×200. Scale bar = 25 μm. (F–G) Western blot analysis of cyclin D1 levels in RND3 knockdown and RND3-overexpressing HTR-8 cells and their respective control groups. (H,I) Flow cytometry analysis of the apoptosis rate of RND3 knockdown and RND3-overexpressing HTR8 cells and their respective control groups. Histogram of Annexin V APC+/7-AAD represents early apoptotic cells. Histogram of Annexin V APC+/7-AAD+ represents late apoptotic cells. The sum of the former two categories equals the total number of apoptotic cells. (J,K) Western blot analysis of BAX and cleaved caspase-3 expression in RND3 knockdown and RND3-overexpressing HTR8 cells and their respective control groups. Data represent the means ± SD of three independent experiments. *P < 0.05, **P < 0.01, ***P < 0.001 vs. siNC or Vector group.
FIGURE 3
FIGURE 3
RND3 promotes trophoblast migration in vitro. (A,C) Transwell migration assay of RND3 knockdown and RND3-overexpressing HTR-8 cells and their respective control groups. Original magnification: ×100. Scale bar = 50 μm. (B,D) Western blot analysis of MMP-2 and MMP-9 expression in HTR-8 cells at 48 h after transfection with siNC, siRND3, control vector, or RND3 overexpression vector. (E,F) Villous explants were obtained from HC at 8–10 weeks of gestation and cultured on Matrigel. Tissues were then transfected with siRND3 or RND3 overexpression vector. Images were acquired after in vitro culture for 24 and 72 h. Original magnification: ×100. Scale bar = 100 μm. Immunofluorescence staining images of trophoblasts expressing RND3 (red) and CK7 (green). Original magnification: ×200. Scale bar = 25 μm. (G,H) Villous explants were obtained from HC and RM at 8–12 weeks of gestation and cultured on Matrigel. RM tissues were then transfected with siRND3. Images were acquired after in vitro culture for 24 and 72 h. Original magnification: ×40. Scale bar = 200 μm. Data represent the means ± SD of three independent experiments. *P < 0.05, **P < 0.01 vs. siNC, Vector, HC or RM group.
FIGURE 4
FIGURE 4
Identification of RND3 core promoter region and FOXD3 as a transcriptional enhancer for RND3 in HTR-8 cells. (A) Specific primers for sequences upstream of the RND3 transcription initiation site were designed and (B) cloned into pGL3-basic vector. (C) Relative luciferase activity of F1–F5 and basic plasmids. *P < 0.05, ****P < 0.0001. (D,E) ChIP assay of the combination of RND3 promoter. *P < 0.05 vs. the IgG group. (F) Relative luciferase activity of F2–F4 and basic plasmids in HTR-8 cells at 48 h after transfection with control vector or RND3 overexpression vector. *P < 0.05 vs. Vector group. (G) Prediction of two FOXD3 binding sites in the RND3 core promoter region (–663 to –572) (underlined) and construction of the FOXD3 binding site mutant reporters. (H) Relative luciferase activity of RND3 reporter plasmids (WT) and FOXD3 binding site mutant reporters (Mut-1 and Mut-2). Data represent the means ± SD of three independent experiments. *P < 0.05, **P < 0.01, ***P < 0.001 vs. Vector group or FOXD3 group.
FIGURE 5
FIGURE 5
FOXD3 is upregulated in first-trimester placental CTB in patients with RM. (A,B,D) FOXD3 expression in first-trimester human villi tissues from patients with RM or HC was determined using qRT-PCR (n = 10) and western blot analysis (n = 6). (C,E) Immunohistochemical analyses of paraffin-embedded villous tissue showed that FOXD3 expression was increased in patients with RM compared with that in HC (n = 17). Original magnification: ×200. Scale bar = 100 μm. (D) Histogram showing the relative expression level of FOXD3 protein in HTR-8 cells as determined using ImageJ software. (E) The staining intensity of FOXD3 in paraffin-embedded villous tissues was quantified using Image-Pro Plus 6.0. (F) Two-color immunofluorescence staining analyses of paraffin-embedded villous tissues revealed expression of FOXD3 (red) and CK7 (green), and counterstaining with DAPI (blue). Original magnification: ×200. Scale bar = 50 μm. CTB, cytotrophoblast; STB, syncytiotrophoblast. *P < 0.05, **P < 0.01 vs. HC.
FIGURE 6
FIGURE 6
FOXD3 regulates RND3 expression, inhibits proliferation and migration, and promotes apoptosis in HTR-8 cells in vitro. (A) CCK-8 assay of FOXD3 knockdown and FOXD3-overexpressing HTR8 cells and their respective control groups. (B,D) Transwell migration assay of FOXD3 knockdown without or with RND3 overexpression and FOXD3-overexpressing without or with siRND3 HTR-8 cells and their respective control groups. Original magnification: × 100. Scale bar = 100 μm. (C) Flow cytometry analysis of the apoptosis rate of siNC, siFOXD3, siFOXD3 + RND3 and Vector, FOXD3, FOXD3 + siRND3 group. Histogram of Annexin V APC+/7-AAD represents early apoptotic cells. Histogram of Annexin VAPC+/7-AAD+ cells represents late apoptotic cells. The sum of the former two categories equals the total number of apoptotic cells. (E) The mRNA expression level of RND3 and FOXD3 in the villous tissues of patients with RM and HC was determined using qRT-PCR (n = 24). RND3 mRNA expression was correlated with FOXD3 mRNA expression in villous tissues. Correlation analysis was performed using Spearman’s rank correlation test. (F–I) Western blot analysis of FOXD3, RND3, MMP2, Cyclin D1, and BAX expression in HTR-8 cells at 48 h after transfection with siNC and siFOXD3 or control vector and FOXD3 overexpression vector. AT 24 h after transfection with siFOXD3 or FOXD3 overexpression vector, HTR-8 cells were transfected RND3 overexpression vector or siRND3 again. Data represent the means ± SD of three independent experiments. *P < 0.05, **P < 0.01, ***P < 0.001, ****P < 0.0001 vs. siNC, Vector, siFOXD3 or FOXD3 group.
FIGURE 7
FIGURE 7
RND3 regulates trophoblast proliferation and migration via the RhoA-ROCK1 signaling pathway and regulates trophoblast apoptosis via the ERK1/2 signaling pathway. (A,B) Western blot analysis of ROCK1, ROCK2, and RhoA expression in HTR-8 cells at 48 h after transfection with siNC and siRND3 or control vector and RND3 overexpression vector. (C) Western blot showing ROCK1 levels in HTR-8 cells transfected with siROCK1. (D,E) HTR-8 cells were transfected with siNC, siRND3, siROCK1 for 36 h, and then treated with Y-27632 for 12 h. Trophoblast migration was assessed by crystal violet staining. Original magnification: ×100. Scale bar = 100 μm. (F) CCK-8 assay of siNC- and siRND3-transfected HTR-8 cells in the presence or absence of Y-27632 or siROCK1. (G,H) Western blot analysis of p-ERK and ERK expression in HTR-8 cells at 48 h after transfection with siNC and siRND3 or control vector and RND3 overexpression vector. (I,K) HTR-8 cells were transfected with control vector or RND3 overexpression vector for 36 h, and then treated with U0126 for 12 h. The apoptosis rate was assessed by flow cytometry. (J,L) Western blot analysis of p-ERK, ERK, cleaved caspase-3, and RND3 expression in HTR-8 cells at 48 h after transfection with control vector or RND3 overexpression vector in the presence or absence of U0126. Data represent the means ± SD of three independent experiments. *P < 0.05, **P < 0.01, ***P < 0.001, ****P < 0.0001 vs. siNC, Vector or RND3 group.
FIGURE 8
FIGURE 8
A schematic illustration of the role of RND3 in trophoblast function. RND3 regulates trophoblast migration, proliferation, and apoptosis through different but related pathways. The red arrows show the changes in patients with RM compared with HC. The red T sign indicates the inhibitor effect.

References

    1. Aspenström P., Fransson A. S. J. (2004). Rho GTPases have diverse effects on the organization of the actin filament system. Biochem. J. 377 327–338. - PMC - PubMed
    1. Belgiovine C., Frapolli R., Bonezzi K., Chiodi I., Favero F., Mello-Grand M., et al. (2010). Reduced expression of the ROCK inhibitor Rnd3 is associated with increased invasiveness and metastatic potential in mesenchymal tumor cells. PLoS One 5:e14154. 10.1371/journal.pone.0014154 - DOI - PMC - PubMed
    1. Collett G. P., Goh X. F., Linton E. A., Redman C. W., Sargent I. L. (2012). RhoE is regulated by cyclic AMP and promotes fusion of human BeWo choriocarcinoma cells. PLoS One 7:e30453. 10.1371/journal.pone.0030453 - DOI - PMC - PubMed
    1. David M., Petit D., Bertoglio J. (2012). Cell cycle regulation of Rho signaling pathways. Cell Cycle 11 3003–3010. 10.4161/cc.21088 - DOI - PMC - PubMed
    1. Fortier M., Comunale F., Kucharczak J., Blangy A., Charrasse S., Gauthier-Rouviere C. (2008). RhoE controls myoblast alignment prior fusion through RhoA and ROCK. Cell Death. Differ. 15 1221–1231. 10.1038/cdd.2008.34 - DOI - PubMed