. 2020 Mar 25;6(13):eaay3314.
doi: 10.1126/sciadv.aay3314. eCollection 2020 Mar.

Slow slip source characterized by lithological and geometric heterogeneity

Affiliations

Slow slip source characterized by lithological and geometric heterogeneity

Philip M Barnes et al. Sci Adv. .

Abstract

Slow slip events (SSEs) accommodate a significant proportion of tectonic plate motion at subduction zones, yet little is known about the faults that actually host them. The shallow depth (<2 km) of well-documented SSEs at the Hikurangi subduction zone offshore New Zealand offers a unique opportunity to link geophysical imaging of the subduction zone with direct access to incoming material that represents the megathrust fault rocks hosting slow slip. Two recent International Ocean Discovery Program Expeditions sampled this incoming material before it is entrained immediately down-dip along the shallow plate interface. Drilling results, tied to regional seismic reflection images, reveal heterogeneous lithologies with highly variable physical properties entering the SSE source region. These observations suggest that SSEs and associated slow earthquake phenomena are promoted by lithological, mechanical, and frictional heterogeneity within the fault zone, enhanced by geometric complexity associated with subduction of rough crust.


Figures

Fig. 1
Fig. 1. Tectonic setting of slow slip at the northern Hikurangi subduction margin.
(A) Bathymetric map showing the extent of three recent SSEs (18, 19), associated with seismic tremor (low-frequency energy bursts in the 4- to 10-Hz frequency range) and microearthquakes (20, 38). Fine black lines with labels are slip contours (mm) for the September to October 2014 SSE. Blue and red dashed lines are 40-mm slip contours for the January to February 2010 Tolaga SSE and the March to April Gisborne SSE, respectively. Dashed black lines show approximate depth to the plate interface (39). Bold black line with teeth marks the plate boundary deformation front. Fine red lines are upper plate thrust faults. Bold white line is the footprint (at 6.75 km depth) of an inferred subducted seamount (21). The 1947 tsunami earthquake location is from (23, 24). PR, Puke Ridge. (B) Regional tectonic setting. Yellow shading shows distribution of cumulative slow slip from 2002 to 2012 (18). (C) Interpretation of seismic profile 05CM-04 [modified from (21, 25)]. HRZ, highly reflective zone (5); HKB, Hikurangi basement; VB, volcanic basement [units adapted from (13)]. Colored scale shows slip in the October 2014 SSE (19).
Fig. 2
Fig. 2. Enlarged panels of our interpretations of seismic profile 05CM-04, showing major fault structures, IODP drilling Sites U1520 and U1526, and seismic units (SU) tied to borehole data.
(A) Frontal accretionary wedge, major thrust faults (red lines with displacement symbols), megathrust plate interface (bold black line), and normal faults in the subducting plate (blue lines) [modified from (21, 25)]. Yellow shading highlights what we infer to be up to ~500-m uncertainty in the position of the megathrust fault zone. Basement units HKB and VB interpreted here are adapted from (13). (B) Subduction “inputs” beneath the eastern Hikurangi Trough. Blue shaded zone represents the stratigraphic interval correlated down-dip with the plate interface fault zone. Profile location is shown in Fig. 1. See fig. S1 for uninterpreted sections, and figs. S2 to S4 for integration of core and seismic data.
Fig. 3
Fig. 3. Maps of bathymetry, seismic profile coverage, basement surface, and seismic profile along the subducting plate in the region of drilling.
(A) Bathymetric hillshade and distribution of seismic profiles used in this study. Black dashed lines with labels P1 and P2 are profiles illustrating basement relief, published in (17). PR, Puke Ridge. (B) Geometry of the composite top HKB/VB reflection, marking the upper surface of the subducting Hikurangi Plateau basement (derived from our interpretation of the horizon in all seismic profiles shown in part A. Twtt, two-way travel time. (C) Contiguous seismic reflection profiles GeoDyNZ Ge93-21a and Ge93-21b highlighting the basement relief and major stratigraphic intervals along the strike of the subducting plate. Profile location is shown in part B. Plio, Pliocene; Quat, Quaternary; Mio, Miocene; Pal, Paleogene; Cret, Cretaceous. Basement units HKB and VB are adapted from (13).
Fig. 4
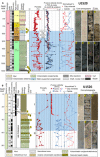
Fig. 4. IODP core and borehole data from the subducting sequence that is being transported into the plate interface fault zone and SSE source region.
The blue shaded intervals in both panels represent the sequence that correlated to the primary plate interface zone (see Fig. 2). (A) Composite of Site U1520, commencing 650 mbsf. White intervals represent no core recovery. Vp, P-wave velocity; PWL, P-wave logger. Normalized mineral abundances are based on bulk powder x-ray diffraction and coulometric measurements, where total clay minerals + quartz + feldspar + calcite = 100%. Core photographs 1 to 8 (locations noted on the lithology column) include the following: 1, calcareous mudstone; 2, chalk; 3, matrix-supported conglomerate; 4, chalk over volcaniclastic conglomerate; 5, cemented volcaniclastic conglomerate; 6, silty claystone; 7, siltstone over volcaniclastic conglomerate; 8, basalt. (B) Composite of Site U1526 data. Core photographs 1 to 6 (locations noted on the lithology column) include the following: 1, calcareous mud over nannofossil ooze; 2, pebble conglomerate over coarse sandstone; 3, coarse volcaniclastic sand; 4, vesicular basalt; 5, pebble-boulder volcaniclastic conglomerate; 6, basalt breccia cemented by calcite.
Fig. 5
Fig. 5. Conceptual models of the subducting northern Hikurangi Plateau and adjacent shallow subduction slow slip environment.
(A) Generic cross-section X-Y (not to scale) depicting our interpretation of the stratigraphic architecture of the subducting plateau and the position (with uncertainty) where the plate interface forms on subduction of the section. The schematic is derived from seismic data (e.g., Figs. 1B, 2, and 3C) (17), drilling results (Fig. 4) (25), and crustal and stratigraphic data east of the Hikurangi Trough (13, 14). Legend includes the following: 1, siliciclastic sediments (Site U1520); 2, mass transport deposits (Site U1520); 3, pelagic sediments (chalk, marl, calcareous mudstone, nannofossil ooze) and volcanic tuff (Sites U1520 and U1526); 4, inferred siliciclastics (13); 5, volcanic conglomerate/breccia, minor marl, and volcaniclastic sandstones (Sites U1520 and U1526); 6, basaltic volcanics and volcaniclastic sediments (90 to 100 million years old) (U1526) (13, 14); 7, volcaniclastic sediments, siltstone, silty claystone, limestone, and basalt (Site U1520); 8, Hikurangi Plateau basaltic basement (13). The right panel is a conceptual map showing the location of section X-Y. Yellow shading, Hikurangi Trough turbidites; pink shading, volcanic seamounts. Small stars atop the broader seamounts are late-stage volcanic cones. (B) Generic cross section (not to scale) of the frontal accretionary wedge, depicting the inferred geological framework of the northern Hikurangi shallow slow slip environment. The first-order geometry of the section, adapted from a seismic profile located in the slow slip region 120 km south of the drilling transect (16), depicts subduction of a guyot-type seamount of comparable scale to Tūranganui Knoll. The structural, stratigraphic, and seismological elements are derived from our interpretations of seismic data (e.g., Figs. 1B, 2, and 3C), drilling results (Fig. 4) (25), and the references labeled. Legend includes the following (–17): 1, mainly Pliocene-Quaternary siliciclastic sediments; 2, mainly Paleogene-Miocene pelagic sediments, with possible siliciclastic sequences more landward; 3, imbricated Mesozoic-Paleogene rocks.

References

    1. Liu Y., Rice J. R., Spontaneous and triggered aseismic deformation transients in a subduction fault model. J. Geophys. Res. 112, (2007).
    1. Skarbek R. M., Rempel A. W., Schmidt D. A., Geologic heterogeneity can produce aseismic slip transients. Geophys. Res. Lett. 39, (2012).
    1. Saffer D. M., Wallace L. M., The frictional, hydrologic, metamorphic and thermal habitat of shallow slow earthquakes. Nat. Geosci. 8, 594–600 (2015).
    1. Kodaira S., Iidaka T., Kato A., Park J.-O., Iwasaki T., Kaneda Y., High pore fluid pressure may cause silent slip in the Nankai trough. Science 304, 1295–1298 (2004). - PubMed
    1. Bell R., Sutherland R., Barker D. H. N., Henrys S., Bannister S., Wallace L. M., Beavan J., Seismic reflection character of the Hikurangi subduction interface, New Zealand, in the region of repeated Gisborne slow slip events. Geophys. J. Int. 180, 34–48 (2010).

LinkOut - more resources