. 2020 Mar 25;6(13):eaay7608.
doi: 10.1126/sciadv.aay7608. eCollection 2020 Mar.

Bioenergetic-active materials enhance tissue regeneration by modulating cellular metabolic state

Affiliations

Bioenergetic-active materials enhance tissue regeneration by modulating cellular metabolic state

Haoming Liu et al. Sci Adv. .

Abstract

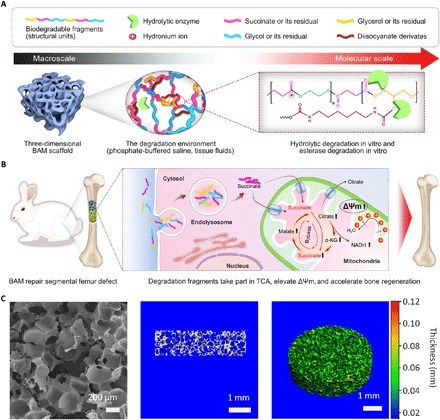
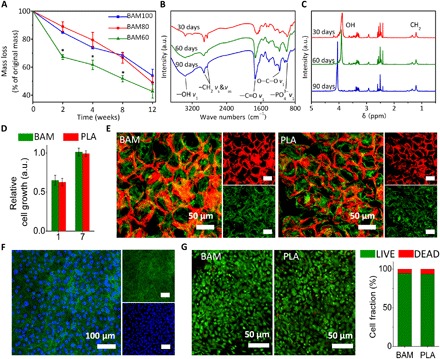
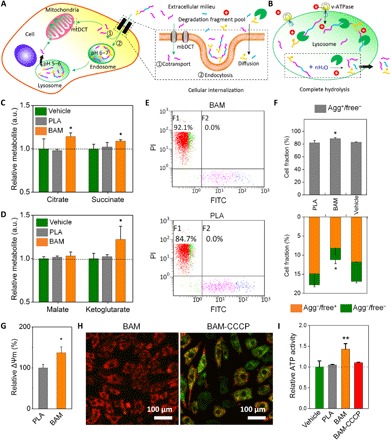
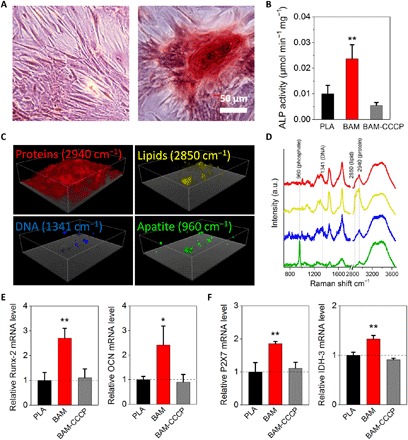
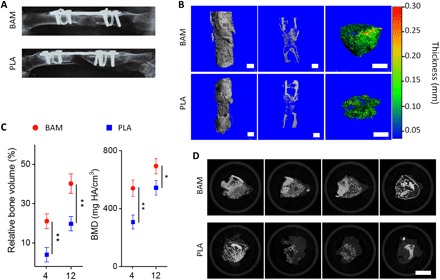
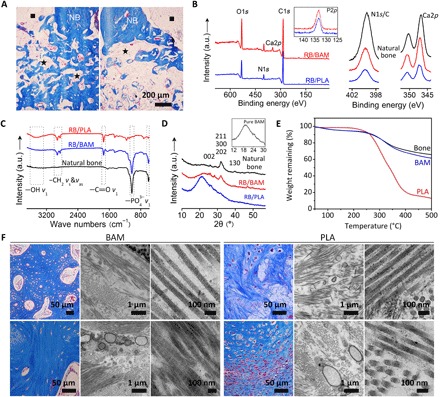
Cellular bioenergetics (CBE) plays a critical role in tissue regeneration. Physiologically, an enhanced metabolic state facilitates anabolic biosynthesis and mitosis to accelerate regeneration. However, the development of approaches to reprogram CBE, toward the treatment of substantial tissue injuries, has been limited thus far. Here, we show that induced repair in a rabbit model of weight-bearing bone defects is greatly enhanced using a bioenergetic-active material (BAM) scaffold compared to commercialized poly(lactic acid) and calcium phosphate ceramic scaffolds. This material was composed of energy-active units that can be released in a sustained degradation-mediated fashion once implanted. By establishing an intramitochondrial metabolic bypass, the internalized energy-active units significantly elevate mitochondrial membrane potential (ΔΨm) to supply increased bioenergetic levels and accelerate bone formation. The ready-to-use material developed here represents a highly efficient and easy-to-implement therapeutic approach toward tissue regeneration, with promise for bench-to-bedside translation.


Figures

Fig. 1
Fig. 1. Proposed effect of BAM scaffold degradation on tissue regeneration.
(A) Schematic of the chemical structures and proposed in vitro or in vivo degradation mechanism of BAMs. (B) Potential mechanism of degradation fragments mediated bioenergetic effects for enhanced bone regeneration. (C) Representative scanning electron microscopy image (left), as well as longitudinal section (middle) and pseudo-color 3D (right) micro–computed tomography images, showing the uniform and interconnected pore structure of a typical BAM scaffold, with pore diameters ranging from 150 to 250 μm. α-KG, α-ketoglutarate; NADH, reduced form of NAD+.
Fig. 2
Fig. 2. Morphological and biological characterization of BAM scaffolds.
(A) Degradation profiles for BAM scaffolds in PBS. By controlling the degree of polymerization and density of cross-linking in the polymer network, a zero-order kinetic profile was achieved (within the confines of the experimental conditions), resulting in approximately 50% weight loss at 12 weeks. Values are expressed as means ± SD. *P < 0.05 (significant differences between BAM60 and other tested groups). a.u., arbitrary units. (B) FTIR and (C) 1H NMR spectra confirming the presence of the TCA metabolite succinate in the degradation solution of BAM scaffold. Absorption peaks at around 2950 cm−1 (−CH2) and 1730 cm−1 (−C═O) in FTIR spectra and absorption peaks between 1.2 and 1.5 parts per million (ppm) (CH2) in 1H NMR spectra are attributed to succinate molecules. (D) Relative rat mesenchymal stem cell (rMSC) proliferation on BAM and PLA membrane at days 1 and 7, as determined by CCK-8. (E) F-actin staining of rMSCs on rhodamine B–stained BAM (left) and PLA (right) scaffolds. (F) F-actin staining of rMSCs on BAM membrane. Red, BAM scaffold; green, F-actin (phalloidin); blue, nuclei (4′,6-diamidino-2-phenylindole). (G) LIVE/DEAD staining for rMSCs seeded on BAM (left) and PLA (right) scaffolds and quantified using ImageJ (National Institutes of Health software). Statistical analysis: Unpaired two-tailed Student’s t test. Results in (D) represent the means ± SD of three samples.
Fig. 3
Fig. 3. BAM degradation products enhance CBE in vitro by fueling the TCA cycle.
(A) General schematic of degradation fragments’ uptake by mitochondria. mtDCT, mitochondria dicarboxylic translocator; mbDCT, membrane dicarboxylic translocator. (B) Complete breakup of degradation fragments in lysosomes. ATPase, adenosine triphosphatase. (C and D) Cellular abundances of TCA metabolites in cells treated with TM for 6 hours. Data are relative to the vehicle. FITC, fluorescein isothiocyanate. (E) Flow cytometry scatter (dot) plot shows that more cells treated with degradation products in the BAM group (top) are positive for aggregation state (zone F1, high ΔΨm) compared to those in the PLA group (bottom). (F) Quantification of flow cytometry data according to the gate outlined in (E) shows the percentage of “high ΔΨm” cells in each group. There are more “high ΔΨm” cells (top) and fewer “low ΔΨm” cells (bottom) in the BAM group. Agg+ indicates cells with high ΔΨm and aggregated JC-1 (red fluorescence), Agg indicates cells with low ΔΨm and no aggregated JC-1, free+ indicates cells with low ΔΨm and free JC-1 (green fluorescence), and free indicates cells with low ΔΨm and no JC-1. (G) Related mitochondrial membrane potential as indicated by fluorescence intensity of JC-1. (H) JC-1 staining of cells incubated with BAM TM with or without carbonyl cyanide 3-chlorophenylhydrazone (CCCP) for 6 hours. (I) Relative intracellular ATP content after cells incubated with indicated TM for 6 hours. Results in (C), (D), (F), (G), and (I) represent the means ± SD (n = 3 biological repeats). *P < 0.05, significant differences between BAM and PLA groups. **P < 0.01, highly significant differences between BAM and PLA groups.
Fig. 4
Fig. 4. Degradation fragments of BAM enhance in vitro osteogenesis.
(A) ARS staining of rMSCs undergoing osteogenic differentiation for 3 weeks in vitro. Scale bar, 50 μm. (B) ALP activity of rMSCs undergoing osteogenic differentiation. Cells were incubated with osteogenic induction medium supplemented with PLA and BAM degradation fragments with or without uncoupler CCCP (10 μM) for 7 days. Data are determined using ALP kit and normalized by the total protein. (C) 3D reconstructed confocal Raman spectroscopy images of distinct peaks associated with proteins (CH3 stretching vibrations at 2940 cm−1), lipids (CH2 stretching vibrations at 2850 cm−1), DNA (1341 cm−1), and apatite [ν1(PO4) at 960 cm−1] in the BAM group. (D) Representative Raman spectra of cellular regions containing proteins, lipids, DNA, and apatite, respectively. All Raman spectra have been baseline-corrected, normalized, and offset for clarity. (E and F) Expression for runt-related transcription factor 2 (Runx-2), osteocalcin (OCN), purinoceptors (P2X7), and isocitrate dehydrogenase (IDH-3) genes as relative to PLA control. Results in (B), (E), and (F) represent the means ± SD (n = 3 biological repeats). Statistical analysis: One-way ANOVA with Tukey’s post hoc test. *P < 0.05, significant differences between BAM and PLA groups. **P < 0.01, highly significant differences between BAM and PLA groups.
Fig. 5
Fig. 5. BAM scaffold enhances bone regeneration in vivo.
(A) Radiography examination of rabbit femur at week 4, indicating newly formed bone connecting both ends of the defect in the BAM group, while there was no bridging for the PLA group. (B) Micro-CT 3D reconstruction (left), cross-section profile (middle), and pseudo-color images (right) of the repair tissues at the defect sites treated with BAM (top) and PLA (bottom) scaffolds at week 12. Scale bars, 2 mm. (C) Quantitative evaluation of micro-CT data on the repair of rabbit femur CSDs in BAM and PLA groups at weeks 4 and 12. (D) Sequential micro-CT scanning slices of the mineralized tissue in the BAM (top) and PLA (bottom) groups after 12 weeks of repair. Slices were selected from approximately 1000 slices for each group, with a 150-slice interval between each. Scale bar, 5 mm. Results in (C) represent the means ± SD (n = 3 animal per condition). Statistical analysis: Unpaired two-tailed Student’s t test. *P < 0.05, significant differences between BAM and PLA groups. **P < 0.01, highly significant differences between BAM and PLA groups.
Fig. 6
Fig. 6. Morphological and spectral assessment of repair tissue in femoral bone defects.
(A) Masson trichrome staining for the regenerated bone, comparing BAM (left) and PLA (right) scaffold-induced repair after 12 weeks. NB, native bone; black squares, marrow cavity; black stars, residual implants; red arrows, new bone. Scale bar, 200 μm. (B) XPS, (C) FTIR, and (D) WAXD analysis on repair tissues in BAM, PLA scaffolds, and natural bone. (E) TG analysis of the repair tissue in BAM and PLA groups; natural bone (rabbit femur) was used as control. (F) Masson trichrome staining and transmission electron microscopy (TEM) micrographs for visualizing collagen at the defect region after 4 weeks (top) and 12 weeks (bottom) regeneration. TEM images at low magnification illustrate the pattern of collagen bundles, and higher-magnification images to the right depict fibrils in detail.

References

    1. Balogh Z. J., Reumann M. K., Gruen R. L., Mayer-Kuckuk P., Schuetz M. A., Harris I. A., Gabbe B. J., Bhandari M., Advances and future directions for management of trauma patients with musculoskeletal injuries. Lancet 380, 1109–1119 (2012). - PubMed
    1. Martino M. M., Tortelli F., Mochizuki M., Traub S., Ben-David D., Kuhn G. A., Müller R., Livne E., Eming S. A., Hubbell J. A., Engineering the growth factor microenvironment with fibronectin domains to promote wound and bone tissue healing. Sci. Transl. Med. 3, 100ra89 (2011). - PubMed
    1. Quarto R., Mastrogiacomo M., Cancedda R., Kutepov S. M., Mukhachev V., Lavroukov A., Kon E., Marcacci M., Repair of large bone defects with the use of autologous bone marrow stromal cells. N. Engl. J. Med. 344, 385–386 (2001). - PubMed
    1. Agarwal S., Loder S. J., Brownley C., Eboda O., Peterson J. R., Hayano S., Wu B., Zhao B., Kaartinen V., Wong V. C., Mishina Y., Levi B., BMP signaling mediated by constitutively active Activin type 1 receptor (ACVR1) results in ectopic bone formation localized to distal extremity joints. Dev. Biol. 400, 202–209 (2015). - PMC - PubMed
    1. Shyh-Chang N., Zhu H., de Soysa T. Y., Shinoda G., Seligson M. T., Tsanov K. M., Nguyen L., Asara J. M., Cantley L. C., Daley G. Q., Lin28 enhances tissue repair by reprogramming cellular metabolism. Cell 155, 778–792 (2013). - PMC - PubMed

Publication types

Substances

LinkOut - more resources