. 2020 Mar 25;6(13):eaay9789.
doi: 10.1126/sciadv.aay9789. eCollection 2020 Mar.

Irradiated tumor cell-derived microparticles mediate tumor eradication via cell killing and immune reprogramming

Affiliations

Irradiated tumor cell-derived microparticles mediate tumor eradication via cell killing and immune reprogramming

Chao Wan et al. Sci Adv. .

Abstract

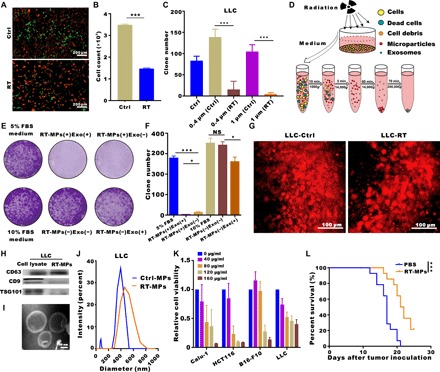
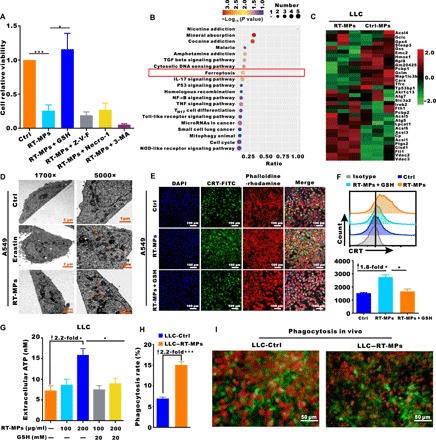
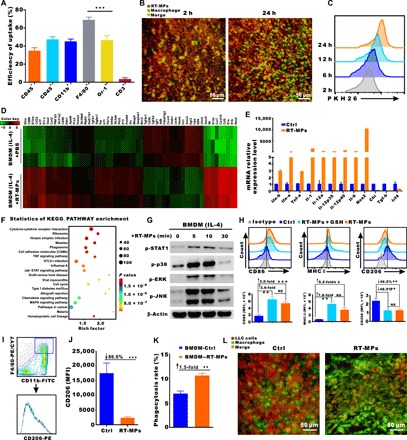
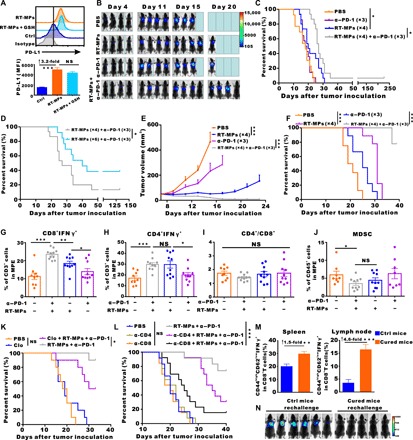
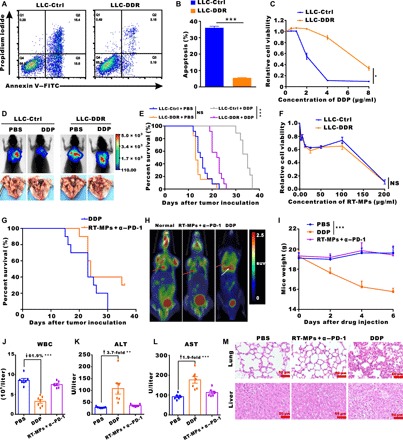
Radiotherapy (RT) is routinely used in cancer treatment, but expansion of its clinical indications remains challenging. The mechanism underlying the radiation-induced bystander effect (RIBE) is not understood and not therapeutically exploited. We suggest that the RIBE is predominantly mediated by irradiated tumor cell-released microparticles (RT-MPs), which induce broad antitumor effects and cause immunogenic death mainly through ferroptosis. Using a mouse model of malignant pleural effusion (MPE), we demonstrated that RT-MPs polarized microenvironmental M2 tumor-associated macrophages (M2-TAMs) to M1-TAMs and modulated antitumor interactions between TAMs and tumor cells. Following internalization of RT-MPs, TAMs displayed increased programmed cell death ligand 1 (PD-L1) expression, enhancing follow-up combined anti-PD-1 therapy that confers an ablative effect against MPE and cisplatin-resistant MPE mouse models. Immunological memory effects were induced.


Figures

Fig. 1
Fig. 1. RIBE is mainly mediated by RT-MPs.
(A) Representative fluorescence microscope images of cell mixtures of unirradiated LLC-RFP and unirradiated LLC-GFP (top) and irradiated LLC-RFP and unirradiated LLC-GFP (bottom). Scale bars, 200 μm. (B) Flow cytometry analysis of green LLC-GFP cells in (A). (C) Quantification of clone formation after coculture with medium from irradiated cells using 0.4- and 1-μm pores. (D) Experimental outline for the production of microparticles and exosomes. (E and F) Representative images showing the colony numbers of LLC cells in the presence of microparticles or exosomes. NS, not significant. (G) Titanium chambers were surgically implanted in C57BL/6 mice, and irradiated or control tumor cells were then subcutaneously injected (2 × 10⁴) into the window. Irradiated tumor cells released more microparticles in the window chamber. Representative images are shown. Scale bars, 100 μm. (H) Western blots of CD9, CD63, and TSG101 expression in LLC whole-cell lysates (positive control) and RT-MPs pellets. (I) TEM images of RT-MPs. Scale bars, 100 nm. (J) Representative size and particle distribution plots of LLC-derived MPs and RT-MPs. (K) Calu-1, HCT116, B16-F10, and LLC cells were treated with various concentrations of RT-MPs for 48 hours, and cell viability was estimated using Cell Counting Kit-8 (CCK-8) assays. (L) Survival analysis in all two groups (n = 14 per group). *P < 0.05 and ***P < 0.001.
Fig. 2
Fig. 2. RT-MPs induce tumor cell death by causing ferroptosis.
(A) Modulatory profiling of known small-molecule cell death inhibitors in A549 cells treated with RT-MPs (100 μg/ml, 48 hours). (B) KEGG bubble map of differentially enriched proteins. The x axis indicates the ratio of the number of differential proteins in the corresponding pathway to the number of total proteins identified. The colors of the points represent the P values of the hypergeometric test. The sizes of the dots represent the numbers of differential proteins in the corresponding pathway. (C) Heat map of differentially expressed proteins in the ferroptosis pathways of RT-MP–treated and untreated cells. (D) TEM images of A549 cells treated with phosphate-buffered saline (PBS) (24 hours), erastin (2 μM, 24 hours), and RT-MPs (100 μg/ml, 24 hours). Single orange arrowheads indicate shrunken mitochondria. At least 10 cells were examined in each treatment condition. (E) Immunofluorescence staining of calreticulin (CRT) expression (green) on the surface of A549 cells after various treatments. Phalloidine-rhodamine (red) represents the cytoskeleton. Scale bars, 100 μm. (F) Flow cytometric analysis of CRT expression. (G) ATP levels in LLC cells treated as shown with the indicated compounds. (H) BMDMs from C57BL/6 mice showed a higher rate of phagocytosis for RT-MP–treated LLC cells. BMDMs were stained with antibodies to F4/80, and LLC cells were stained with red fluorescence dye PKH26. Flow cytometric analysis was performed to evaluate the rate of phagocytosis. (I) In vivo visualization of phagocytosis of RT-MP–treated cells. LLC-RFP cells were subcutaneously injected (2 × 10⁴) into the window. Macrophages were recruited and phagocytosed more RT-MP–treated LLC-RFP cells in the CX3CR1+/GFP window chamber. Scale bars, 50 μm. *P < 0.05 and ***P < 0.001.
Fig. 3
Fig. 3. RT-MPs reprogram macrophages through Jak-STAT and MAPK pathways.
(A) Quantification of the accumulation of PKH26-labeled RT-MPs in various cell types in MPE mice (means ± SEM, n = 5 mice). (B) Representative images of macrophages (green) that were recruited and phagocytosed red RT-MPs over time in the CX3CR1+/GFP window chamber. RT-MPs were stained with red fluorescence dye PKH26 and subcutaneously injected into the window. Scale bar, 50 μm. (C) Flow cytometric analysis of RT-MPs internalization by macrophages at multiple time points (n = 3). (D) Heat map of RNA-seq on RT-MP–treated and untreated BMDM-M2 cells. (E) RT-qPCR analysis of the expression levels of M1- and M2-associated mRNAs in RT-MP–treated BMDM-M2 cells. The results indicate up-regulation of M1-associated mRNAs and down-regulation of M2-associated mRNAs. (F) The top 20 up-regulated functional pathways in RT-MP–treated and untreated groups, as determined by KEGG analysis. (G) Protein expression levels of p-STAT1, p-p38, p-ERK, p-JNK, and β-actin in BMDM-M2 cells treated with RT-MPs at the indicated time points were analyzed by Western blotting. (H) Flow cytometric analysis of CD86, major histocompatibility complex II (MHC II), and CD206 expression in BMDM-M2 cells treated with RT-MPs and GSH-incubated RT-MPs. MFI, mean fluorescence intensity. (I) Flow cytometry gating strategy for measurement of macrophages from MPE mice. (J) Quantification of CD206 expression in MPE mice after treatment with RT-MPs. (K) RT-MP–treated BMDM-M2 cells showed increased phagocytosis of LLC cells compared to that of control BMDM-M2 cells. Flow cytometric analysis was performed to evaluate the phagocytosis rate. FITC, fluorescein isothiocyanate; PE, phycoerythrin. (L) In the CX3CR1+/GFP mouse window chamber, RT-MP–treated macrophages were recruited and phagocytosed a greater number of LLC-RFP cells. Representative images were shown here. Scale bars, 50 μm. **P < 0.01 and ***P < 0.001.
Fig. 4
Fig. 4. Combination treatment with RT-MPs plus anti–PD-1–cured MPE mice and generated strong memory responses.
(A) Flow cytometry analysis of PD-L1 expression on the surface of BMDMs treated with RT-MPs. (B) Representative in vivo bioluminescence images of the growth of mice MPE under various treatment conditions. (C) Kaplan-Meier survival plot of MPE mice in the corresponding treatment groups described in (B) (n = 13 to 15 per group). (D) Comparison of the therapeutic efficacy of different frequencies of RT-MPs injection (n = 13 to 15 per group). (E) Tumor growth curves of B16-F10–LUC subcutaneous transplant model in corresponding treatment groups (n = 8 to 9 per group). (F) Kaplan-Meier survival plot of B16-F10–LUC melanoma-bearing mice in the corresponding treatment groups described in (E) (n = 8 to 9 per group). (G to J) Flow cytometry analysis of changes in the immune cells in the pleural lavage fluid of MPE mice that underwent different treatments (n = 8 to 11 per group). (K) Kaplan-Meier survival plot of LLC-LUC MPE-bearing C57BL/6 mice (n = 9 to 10 per group) that were treated with clodronate liposomes and/or RT-MPs plus anti–PD-1. (L) Kaplan-Meier survival plot of LLC-LUC MPE-bearing C57BL/6 mice treated with RT-MPs plus anti–PD-1, concomitant with anti-CD4 or anti-CD8 neutralizing antibody treatment (n = 12 to 13 per group). (M) Proportions of effector memory T cells (Tem and CD44highCD62low IFN-γ+) in the lymph node and spleen analyzed by flow cytometry (gated on CD3+CD8+ T cells) at day 60 (n = 5 to 6 per group). (N) In vivo bioluminescence images to monitor the growth of rechallenged thorax-injected LLC-LUC tumors (n = 5 to 6 per group). *P < 0.05, **P < 0.01, and ***P < 0.001.
Fig. 5
Fig. 5. Combination treatment with RT-MPs plus anti–PD-1 overcomes cisplatin resistance.
(A and B) Flow cytometry measurement of LLC-Ctrl and LLC-DDR cell apoptosis induced by cisplatin (DDP). (C) Sensitivity of LLC-Ctrl and LLC-DDR cells to DDP treatment. Relative cell viability was measured by CCK-8 assay. (D) Representative in vivo bioluminescence images to monitor the growth of thorax-injected LLC-Ctrl or LLC-DDR cells in different groups. LLC-DDR MPE was more resistant to DDP treatment. Photo credit: Chao Wan, Cancer Center, Wuhan Union Hospital. (E) Kaplan-Meier survival plot of LLC-Ctrl or LLC-DDR MPE-bearing mice in the corresponding treatment groups described in (D) (n = 9 to 13 per group). (F) Sensitivity of LLC-Ctrl and LLC-DDR cells to treatment with RT-MPs. Cell viability was measured by CCK-8 assay. (G) Kaplan-Meier survival plot of MPE-bearing mice treated with DDP or RT-MPs plus anti–PD-1. (H) Representative 18F-FDG PET-CT images of normal mice, RT-MPs plus anti–PD-1–cured MPE mice, and DDP-treated mice, respectively. (I) Weight changes after treatment with PBS, DDP, or RT-MPs plus anti–PD-1. (J to L) Hemanalysis was performed on blood withdrawn from mice on day 3 after treatment. White blood cell (WBC), alanine transaminase (ALT), and aspartate transaminase (AST) are presented as the means ± SEM (n = 7). (M) Representative histological examinations of the main organs with hematoxylin and eosin staining. Images of main organs from mice injected with PBS, DDP, or RT-MPs plus anti–PD-1. Scale bars, 50 μm. *P < 0.05, **P < 0.01, and ***P < 0.001.

References

    1. Ethun C. G., Bilen M. A., Jani A. B., Maithel S. K., Ogan K., Master V. A., Frailty and cancer: Implications for oncology surgery, medical oncology, and radiation oncology. CA Cancer J. Clin. 67, 362–377 (2017). - PubMed
    1. Herrera F. G., Bourhis J., Coukos G., Radiotherapy combination opportunities leveraging immunity for the next oncology practice. CA Cancer J. Clin. 67, 65–85 (2017). - PubMed
    1. Joyce J. A., Fearon D. T., T cell exclusion, immune privilege, and the tumor microenvironment. Science 348, 74–80 (2015). - PubMed
    1. Sanmamed M. F., Chen L., A paradigm shift in cancer immunotherapy: from enhancement to normalization. Cell 175, 313–326 (2018). - PMC - PubMed
    1. Khalil D. N., Smith E. L., Brentjens R. J., Wolchok J. D., The future of cancer treatment: Immunomodulation, CARs and combination immunotherapy. Nat. Rev. Clin. Oncol. 13, 273–290 (2016). - PMC - PubMed

Publication types

MeSH terms