A mathematical model for the novel coronavirus epidemic in Wuhan, China
- PMID: 32233562
- PMCID: PMC7376496
- DOI: 10.3934/mbe.2020148
A mathematical model for the novel coronavirus epidemic in Wuhan, China
Abstract
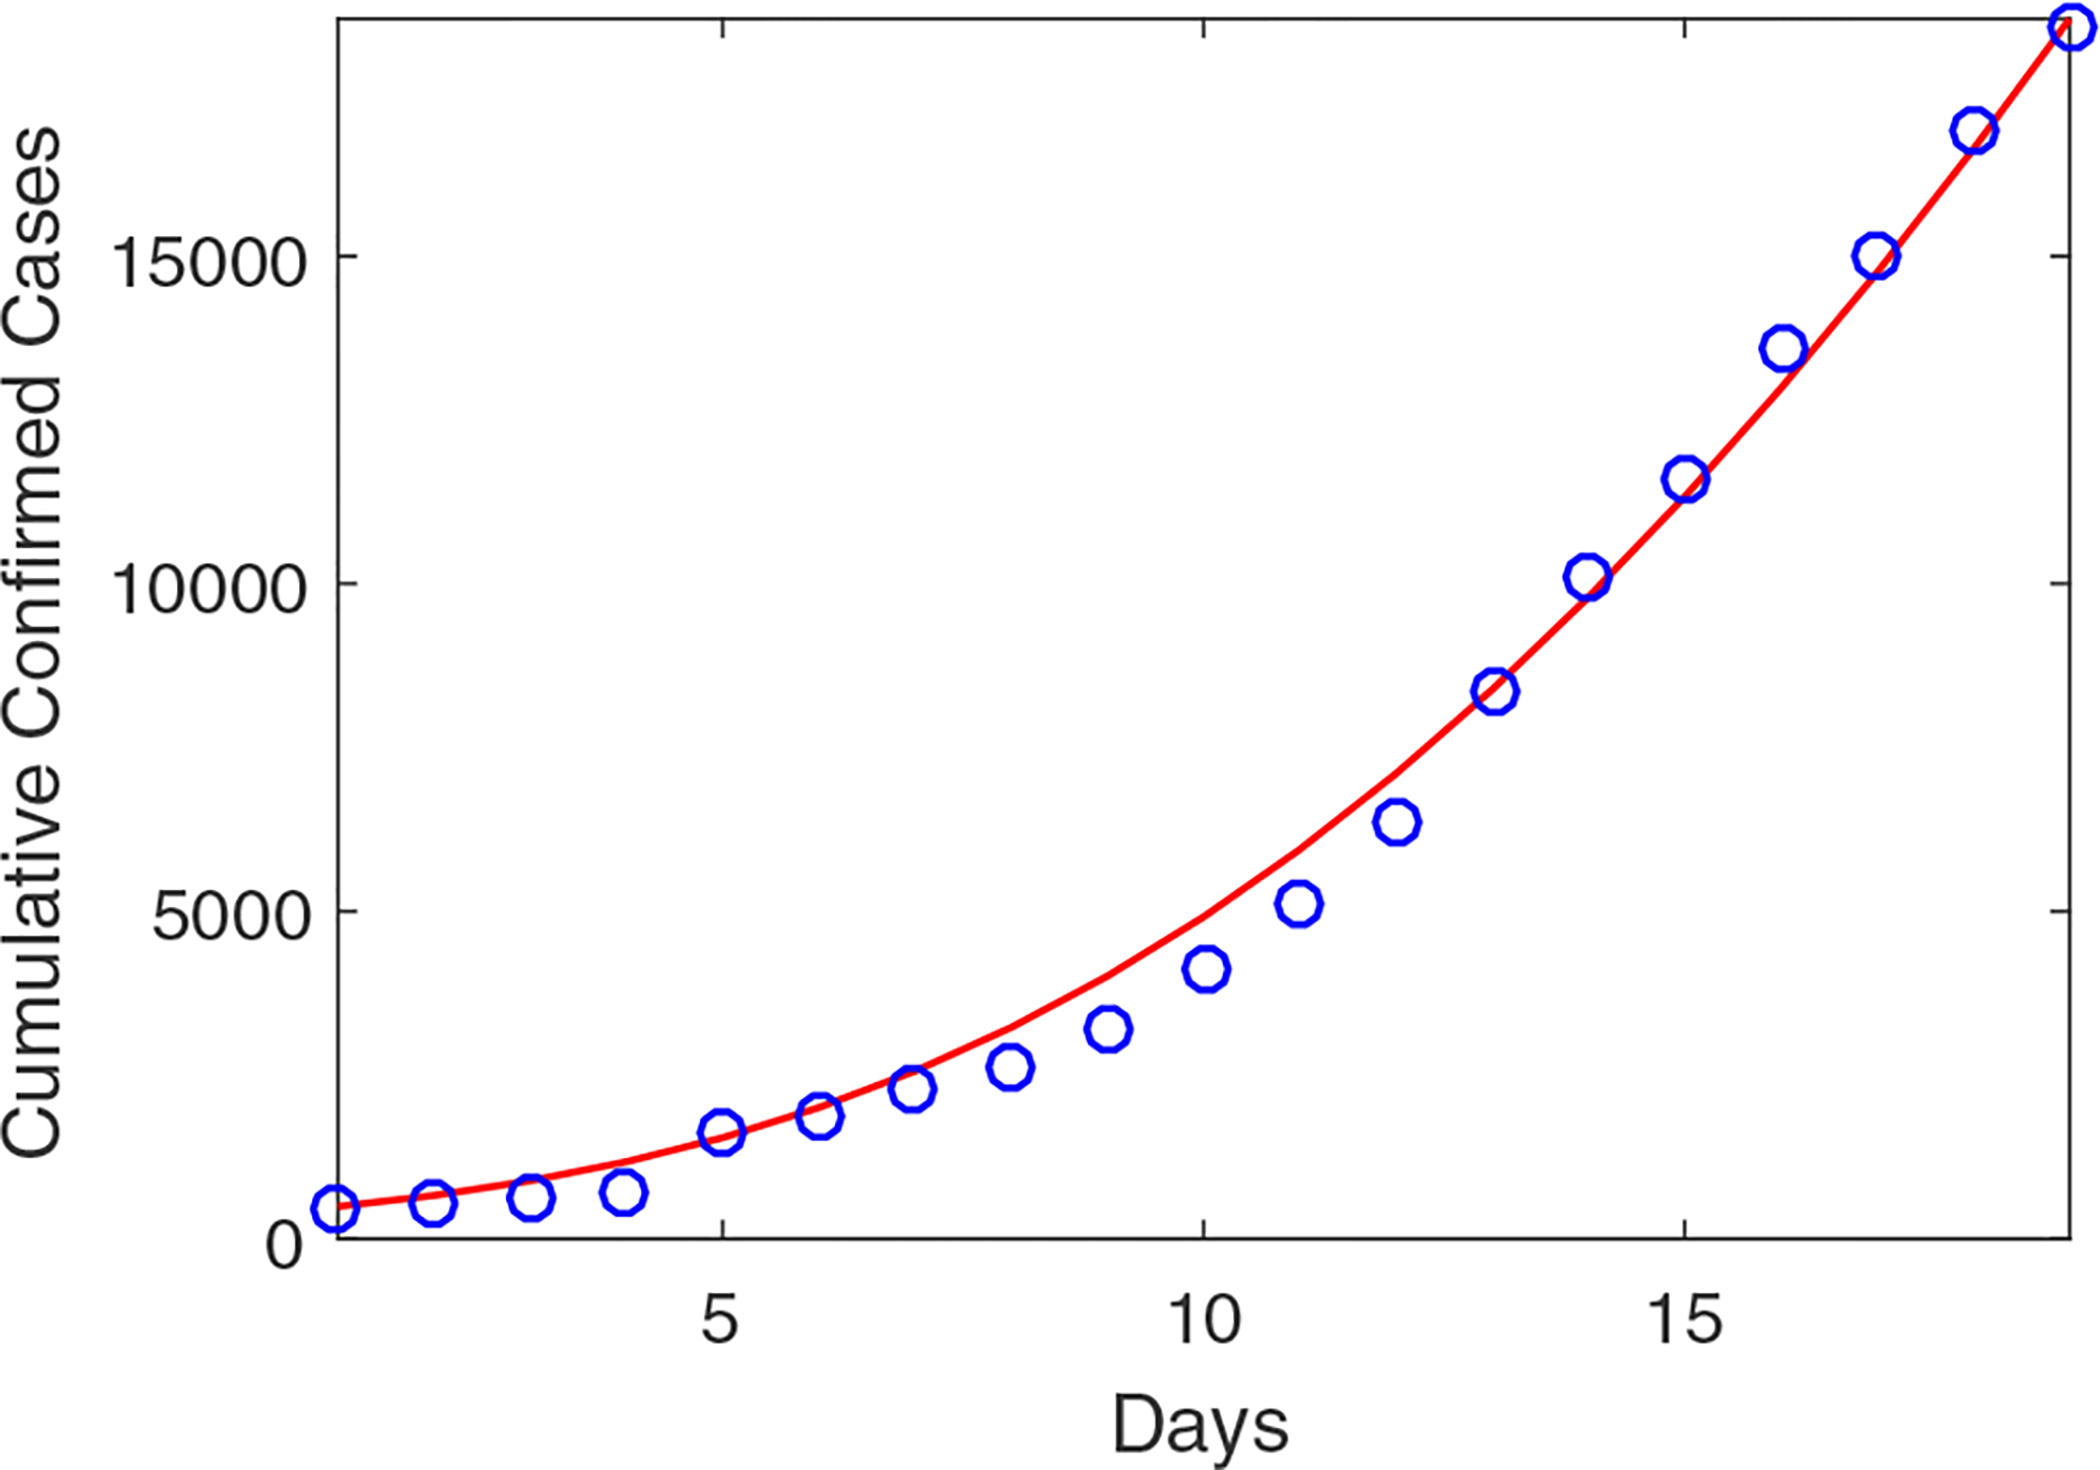
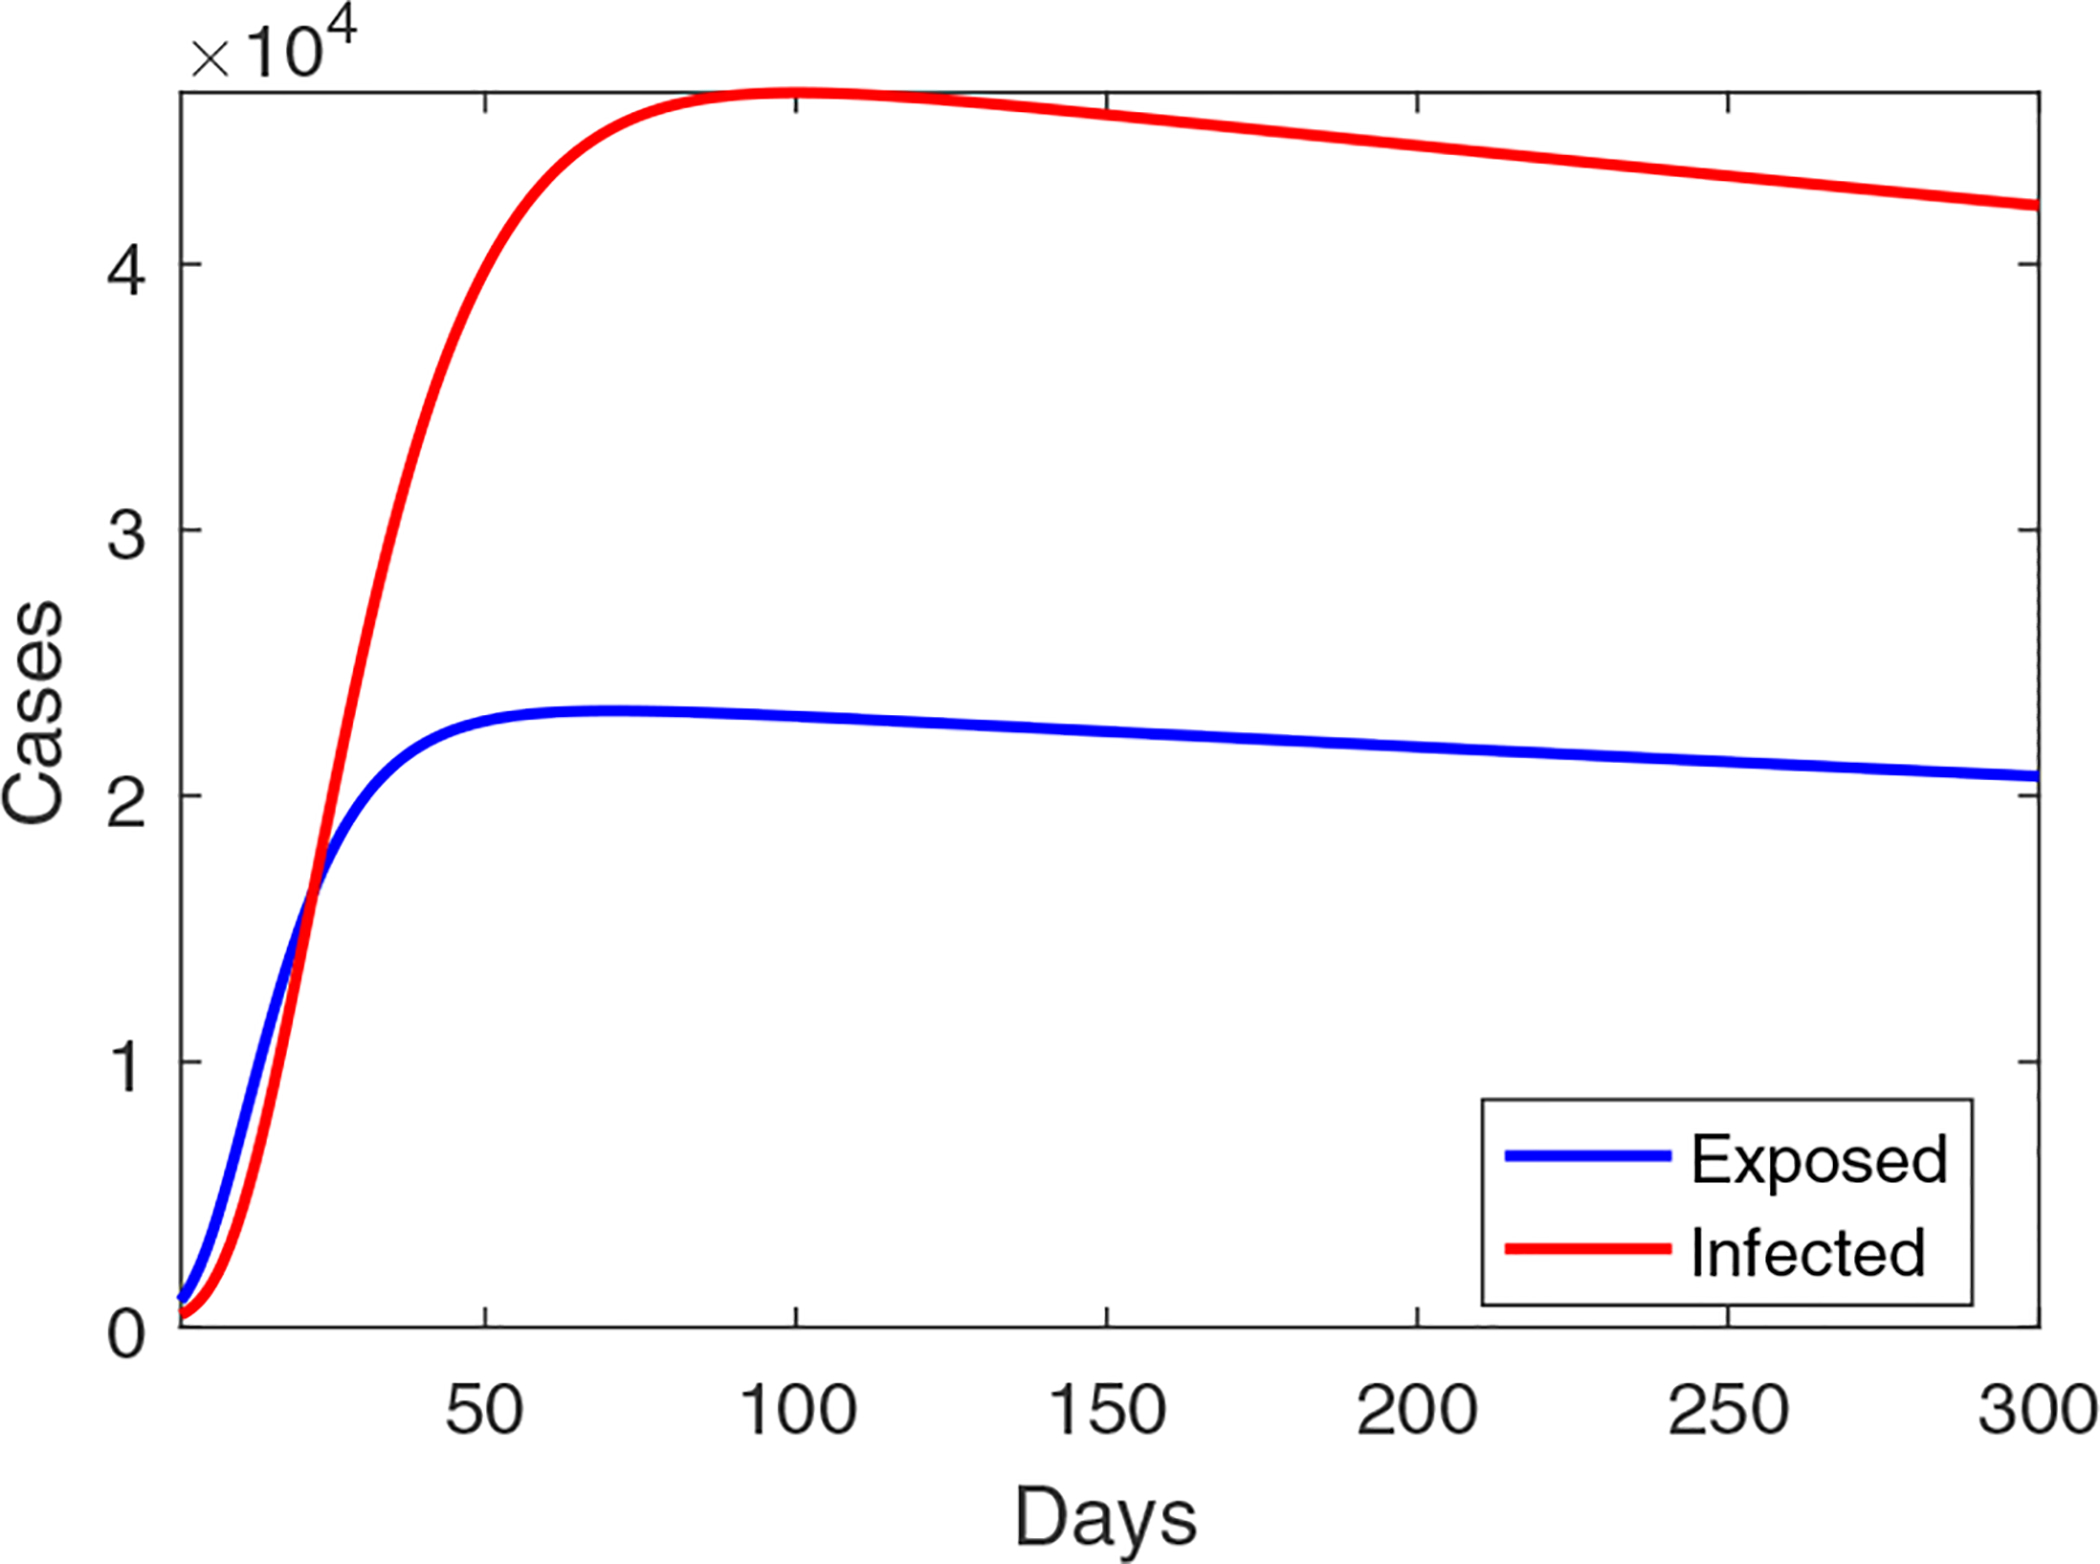
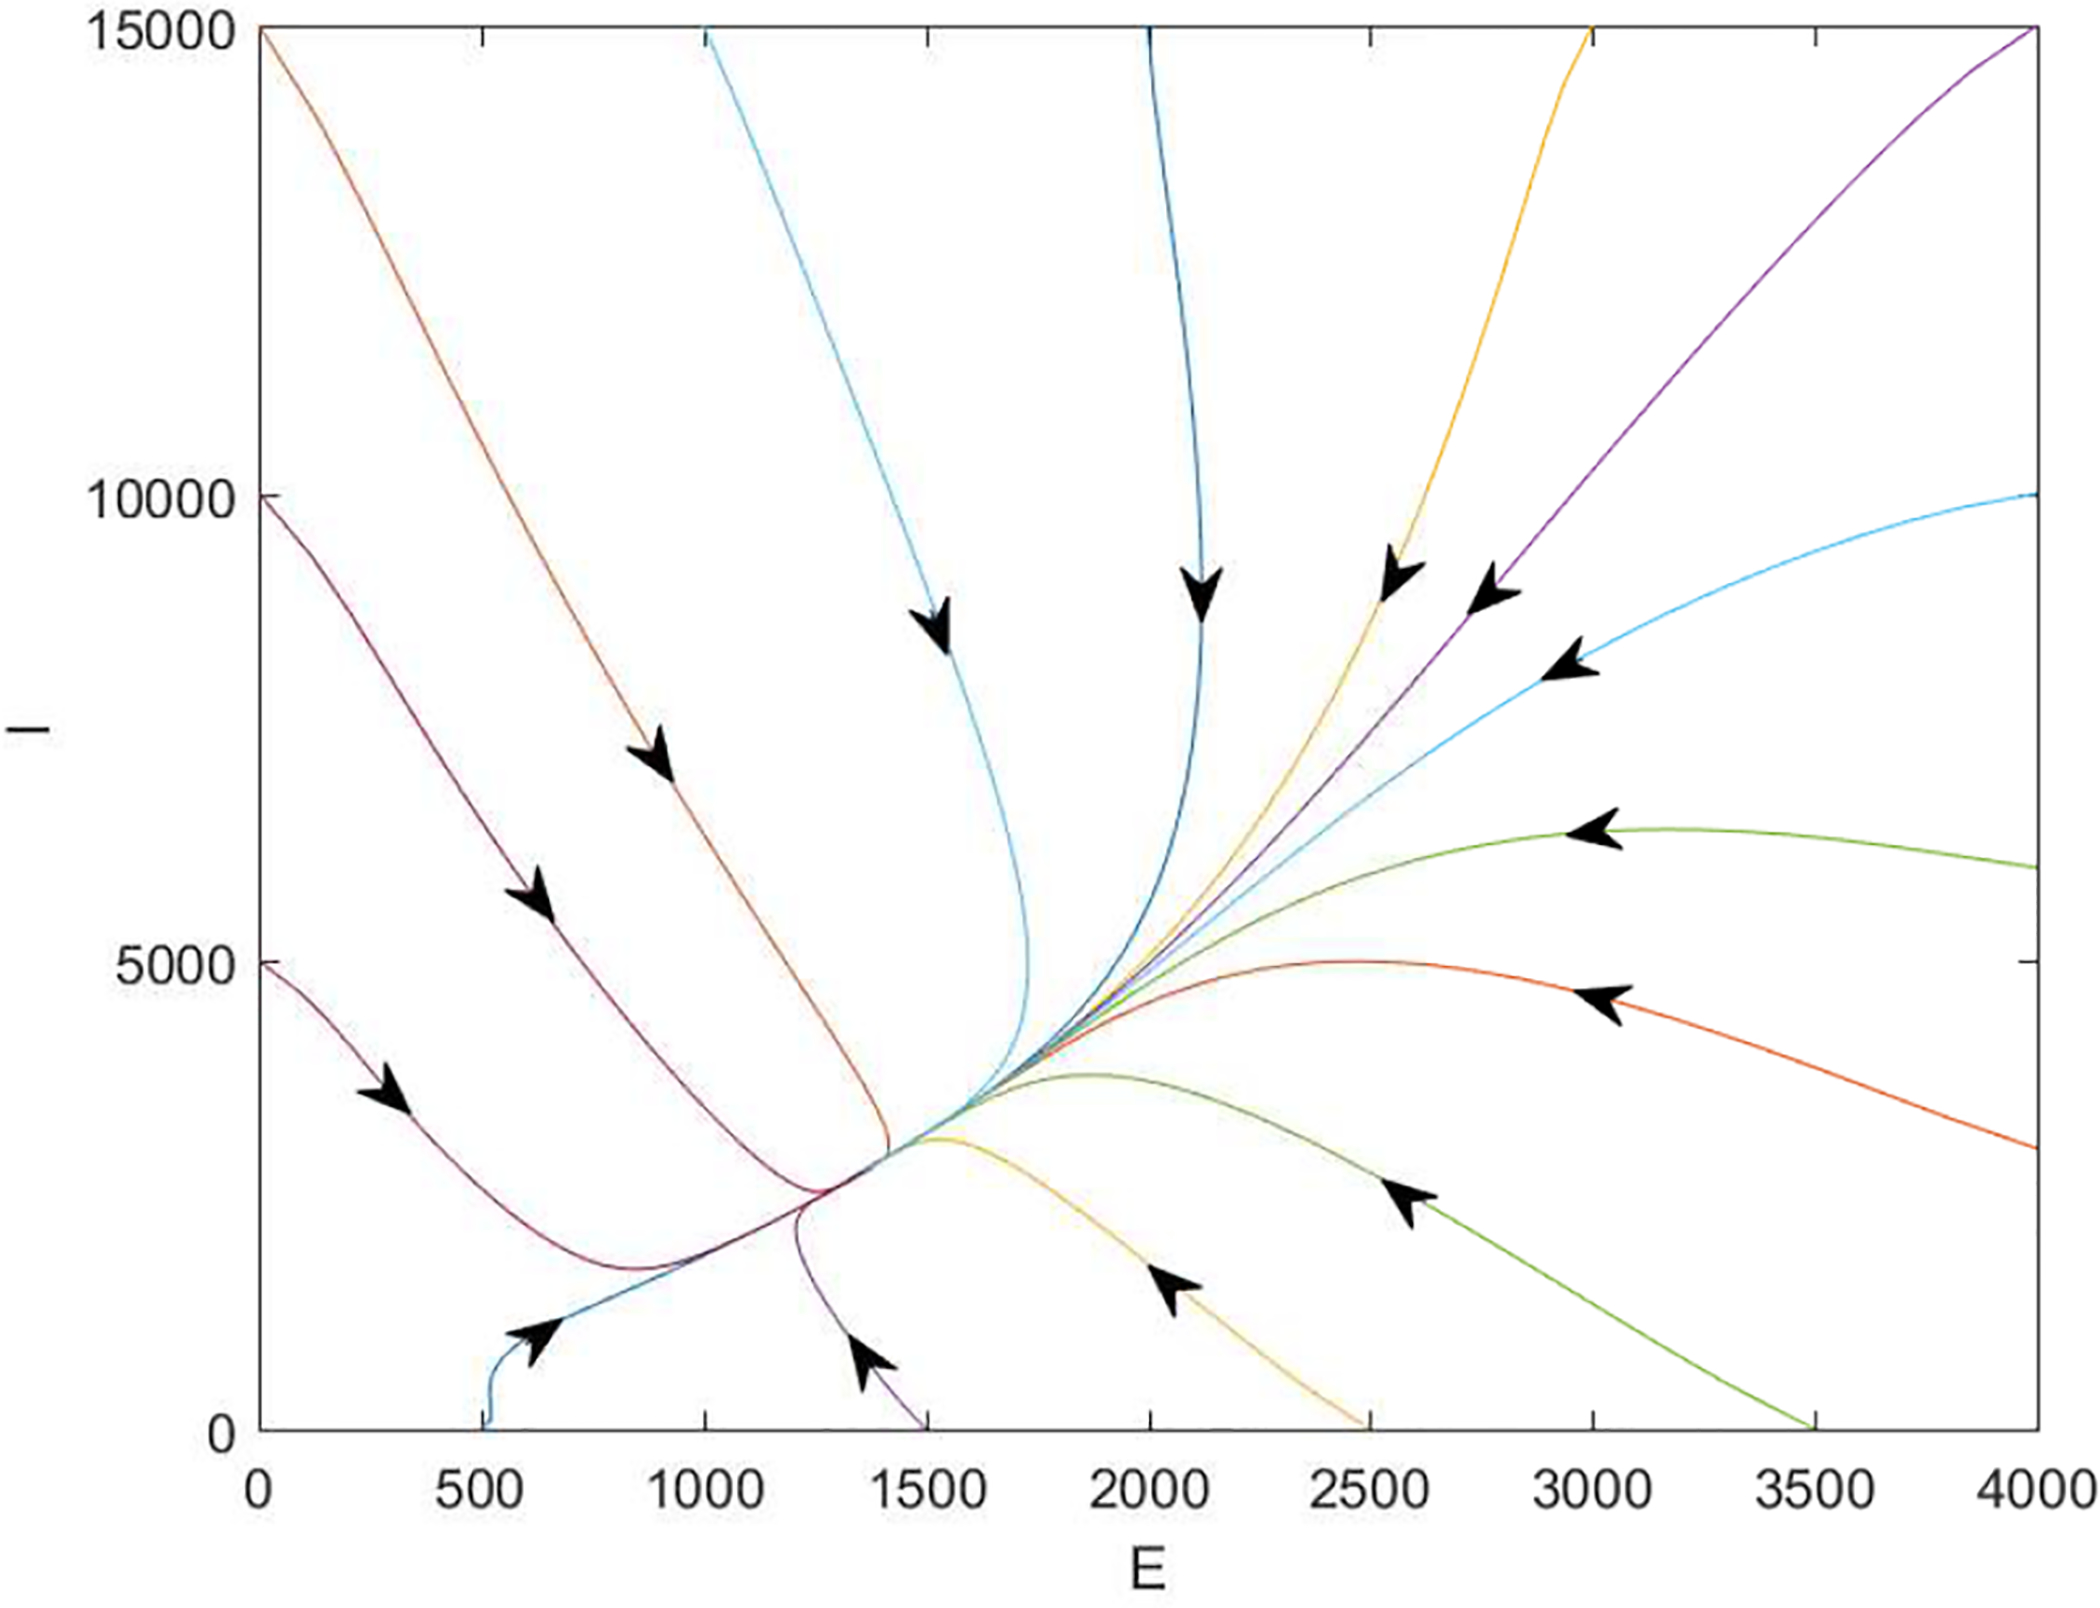
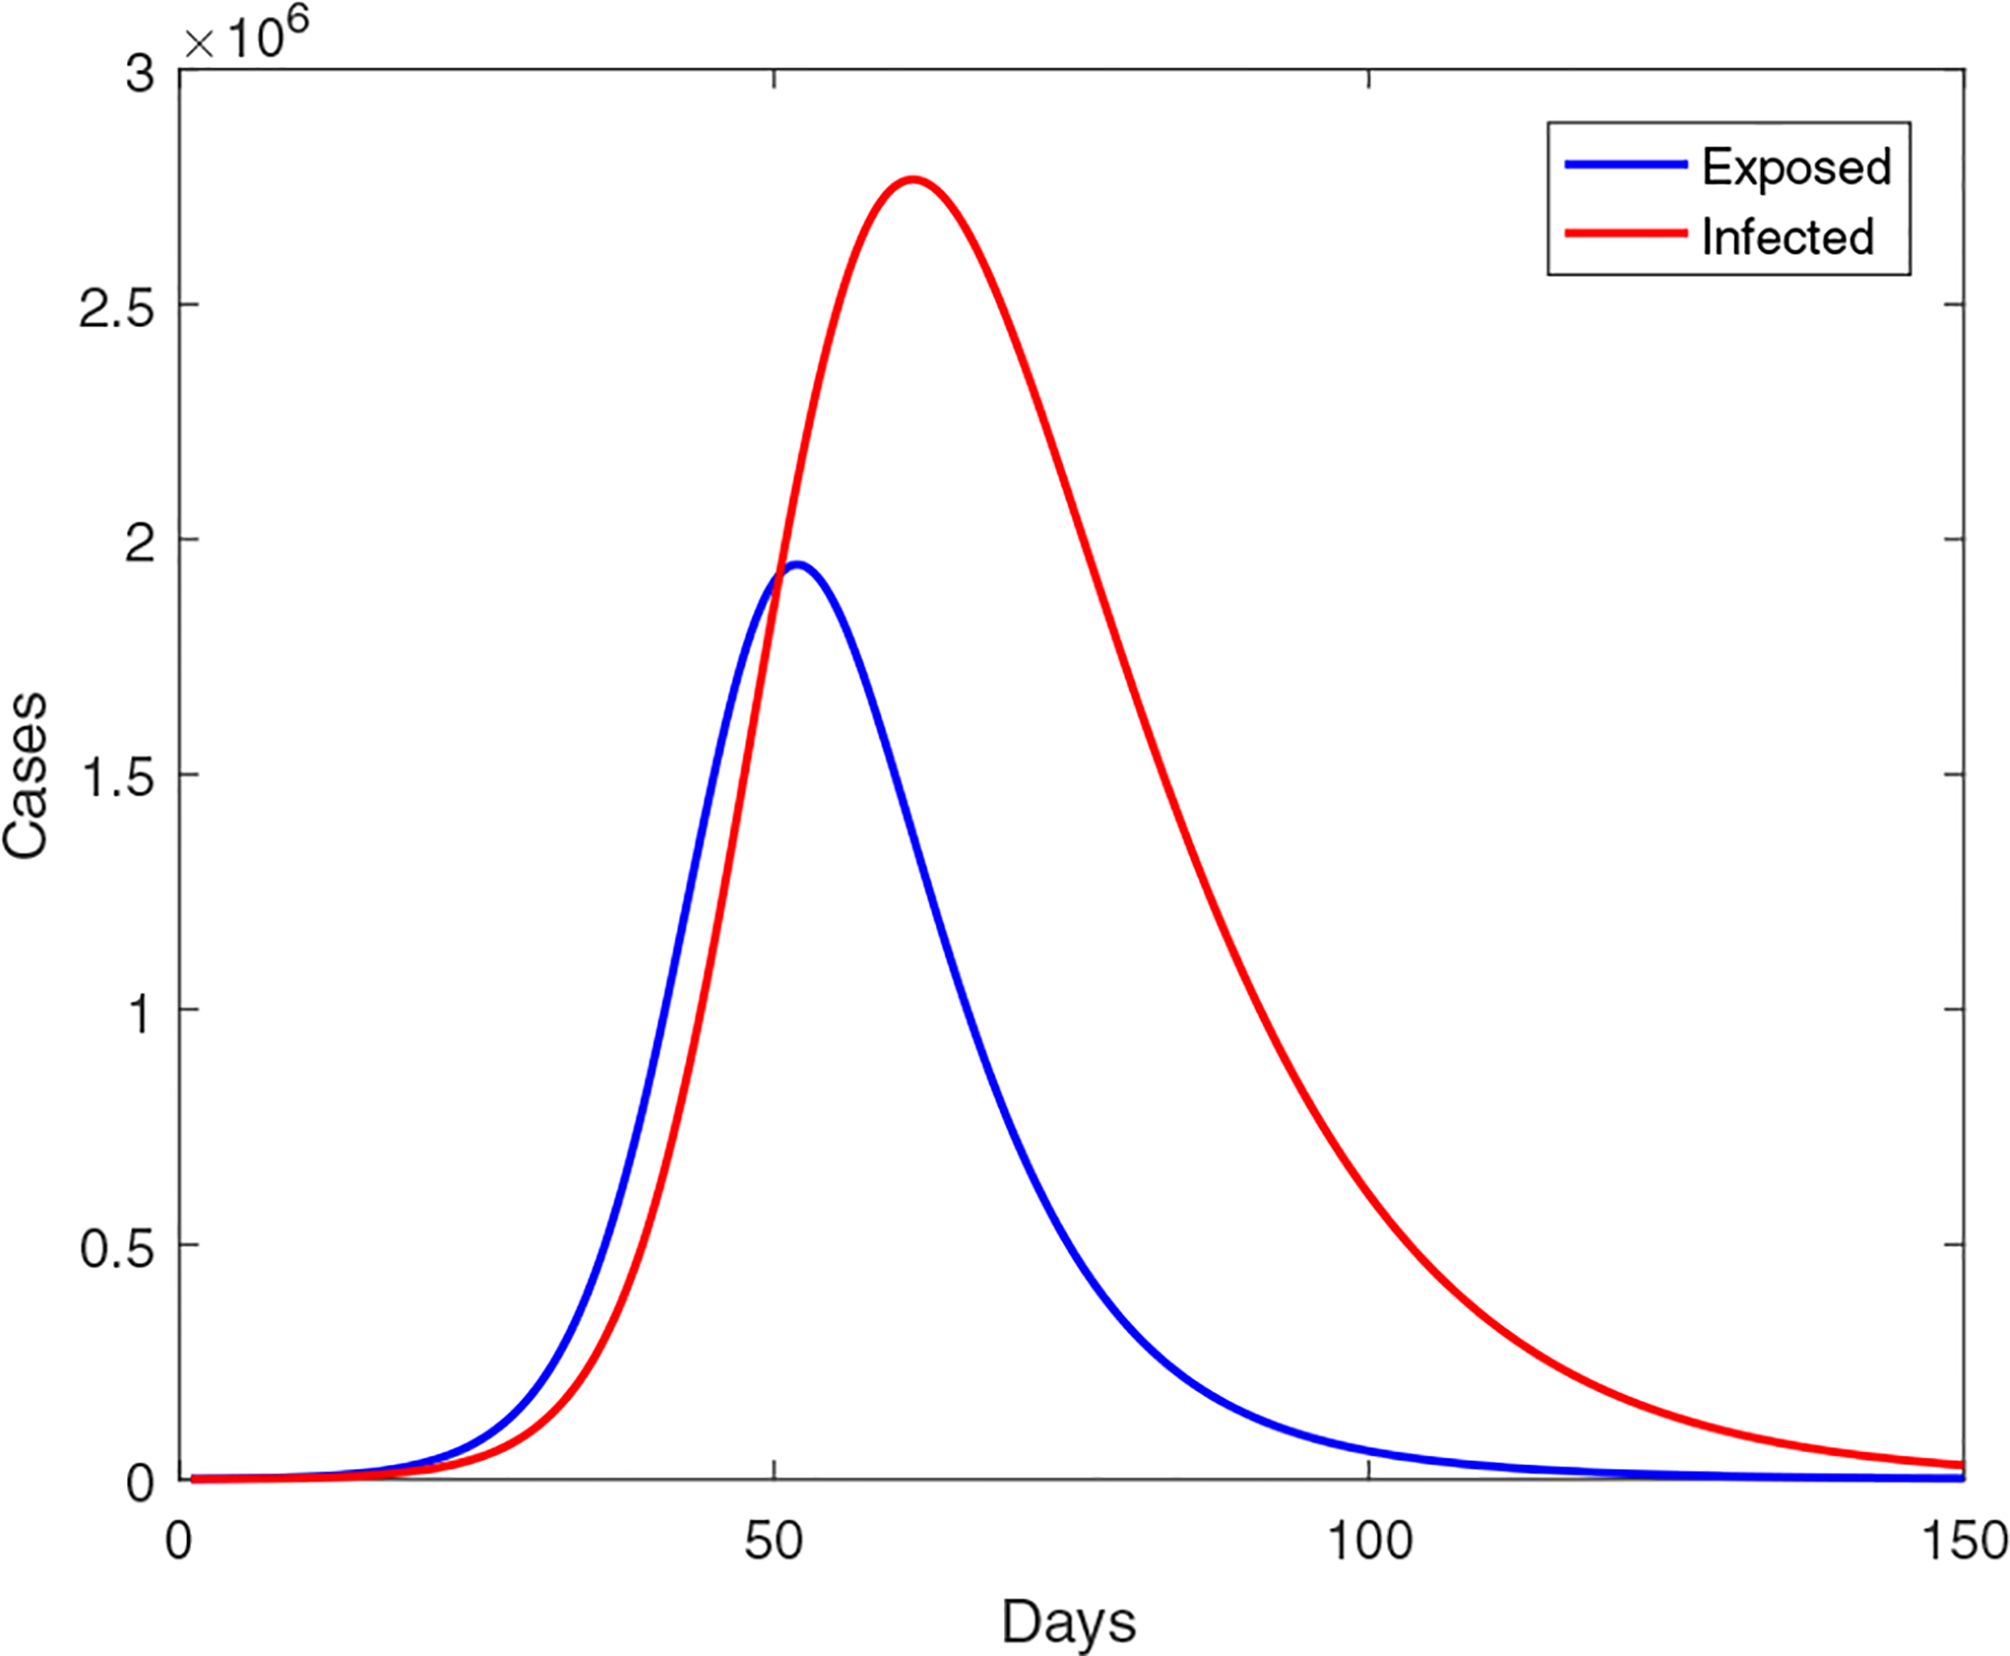
We propose a mathematical model to investigate the current outbreak of the coronavirus disease 2019 (COVID-19) in Wuhan, China. Our model describes the multiple transmission pathways in the infection dynamics, and emphasizes the role of the environmental reservoir in the transmission and spread of this disease. Our model also employs non-constant transmission rates which change with the epidemiological status and environmental conditions and which reflect the impact of the on-going disease control measures. We conduct a detailed analysis of this model, and demonstrate its application using publicly reported data. Among other findings, our analytical and numerical results indicate that the coronavirus infection would remain endemic, which necessitates long-term disease prevention and intervention programs.
Keywords: COVID-19; basic reproduction number; compartmental modeling.
Conflict of interest statement
Conflict of interest
All authors declare no conflicts of interest in this paper.
Figures
References
-
- WHO statement regarding cluster of pneumonia cases in Wuhan, China. 2020. Available from: https://www.who.int/china/news/detail/09-01-2020-\who-statement-regardin....
-
- Zhou P, Yang XL, Wang XG, Hu B, Zhang L, Zhang W, et al. , Discovery of a novel coronavirus associated with the recent pneumonia outbreak in humans and its potential bat origin, bioRxiv, 2020.
-
- Ellerin T, The new coronavirus: What we do- and don’t- know, Harvard Health Blog, January 25, 2020. Available from: https://www.health.harvard.edu/blog/the-new-coronavirus-what-we-do-and-d....