. 2020 Apr 1:9:e54532.
doi: 10.7554/eLife.54532.

Deep evolutionary analysis reveals the design principles of fold A glycosyltransferases

Affiliations

Deep evolutionary analysis reveals the design principles of fold A glycosyltransferases

Rahil Taujale et al. Elife. .

Abstract

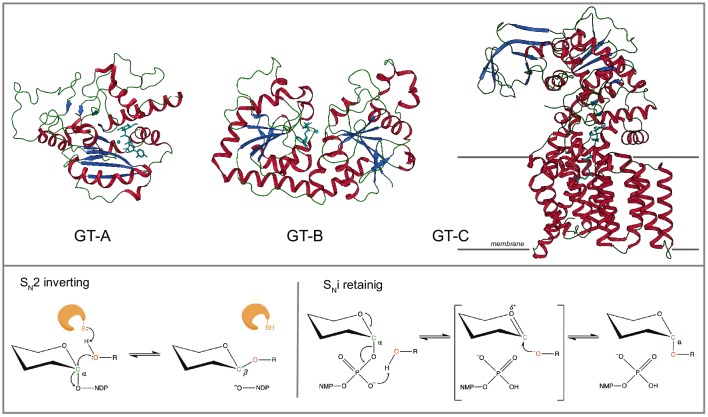
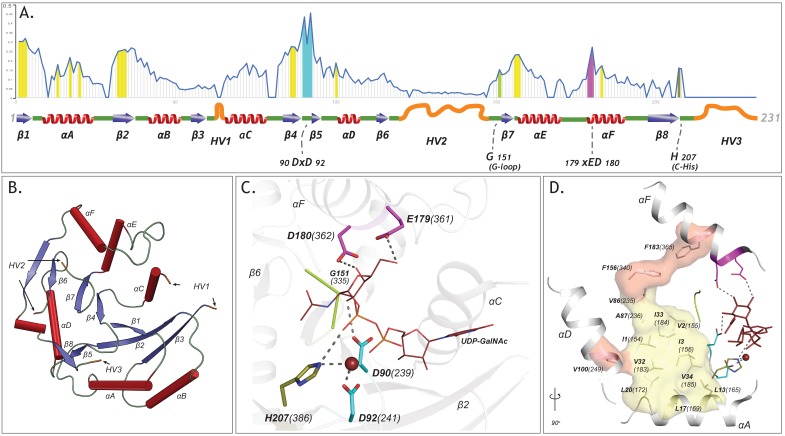
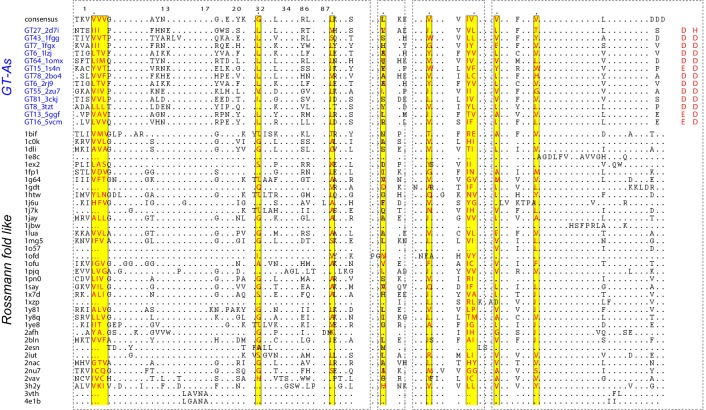
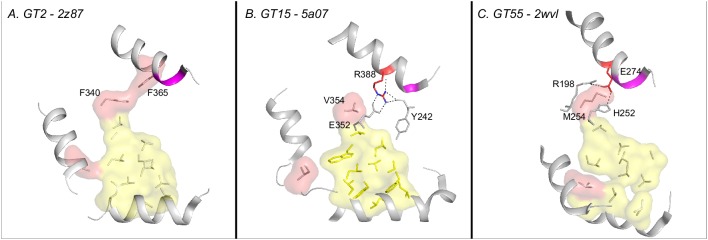
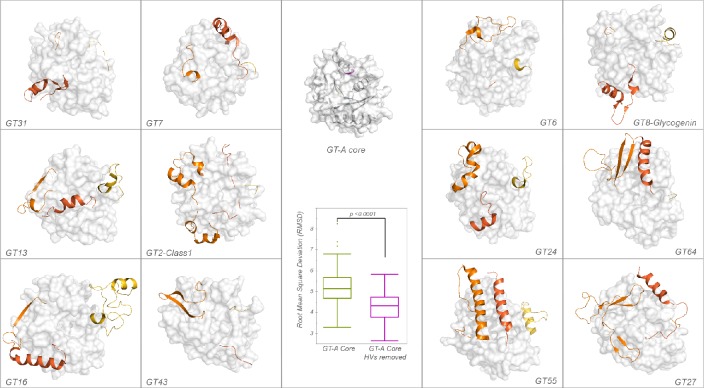
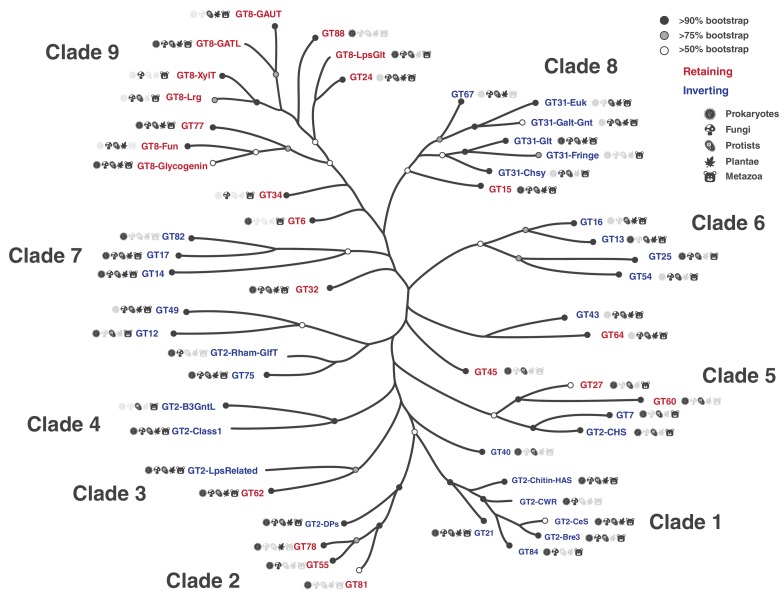
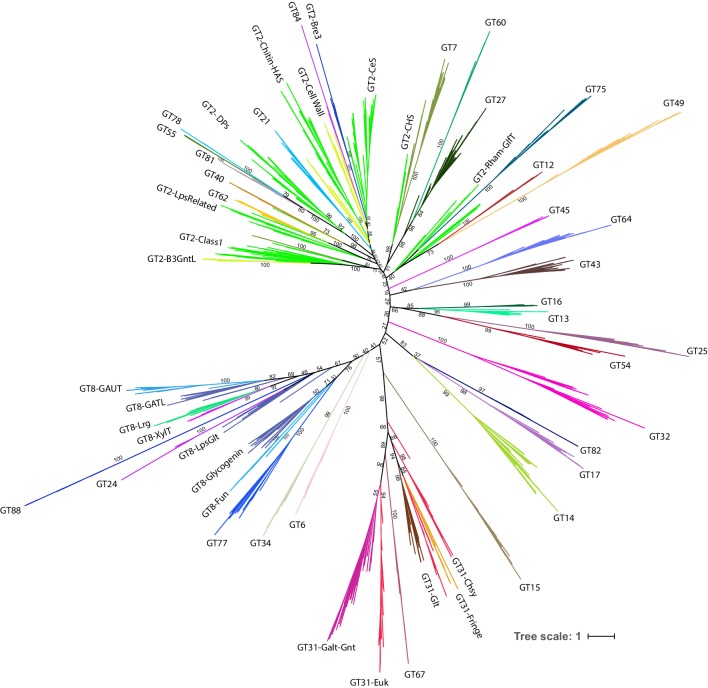
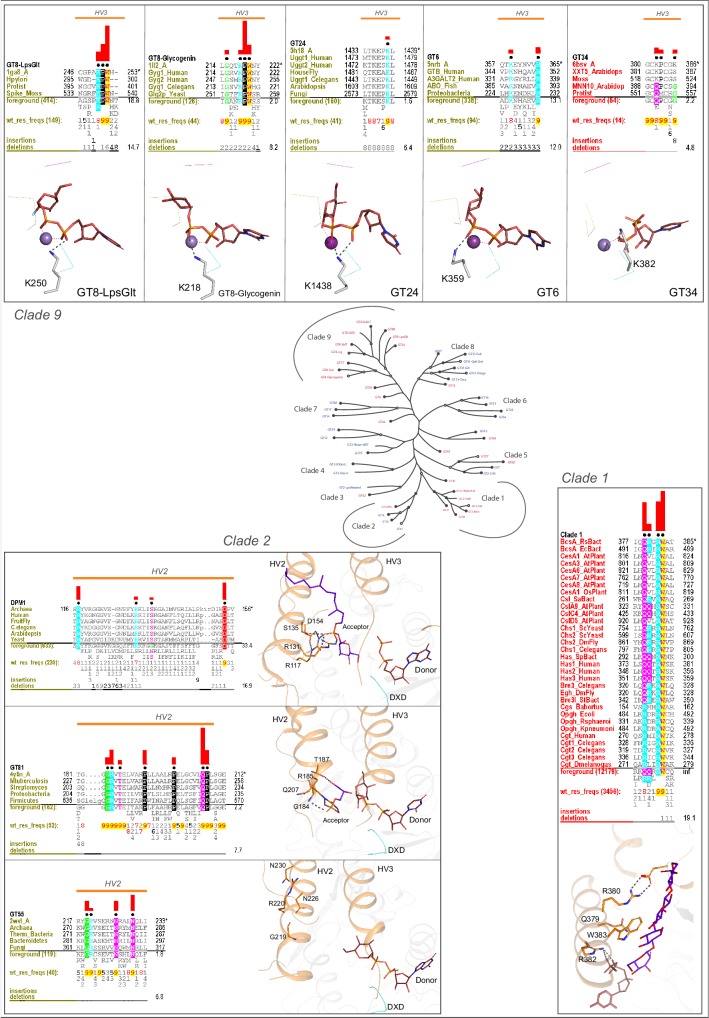
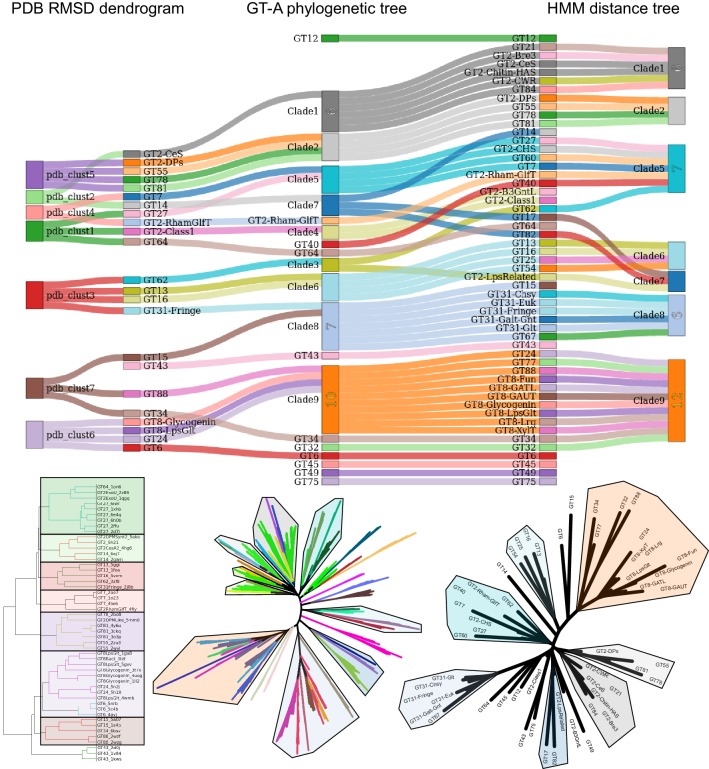
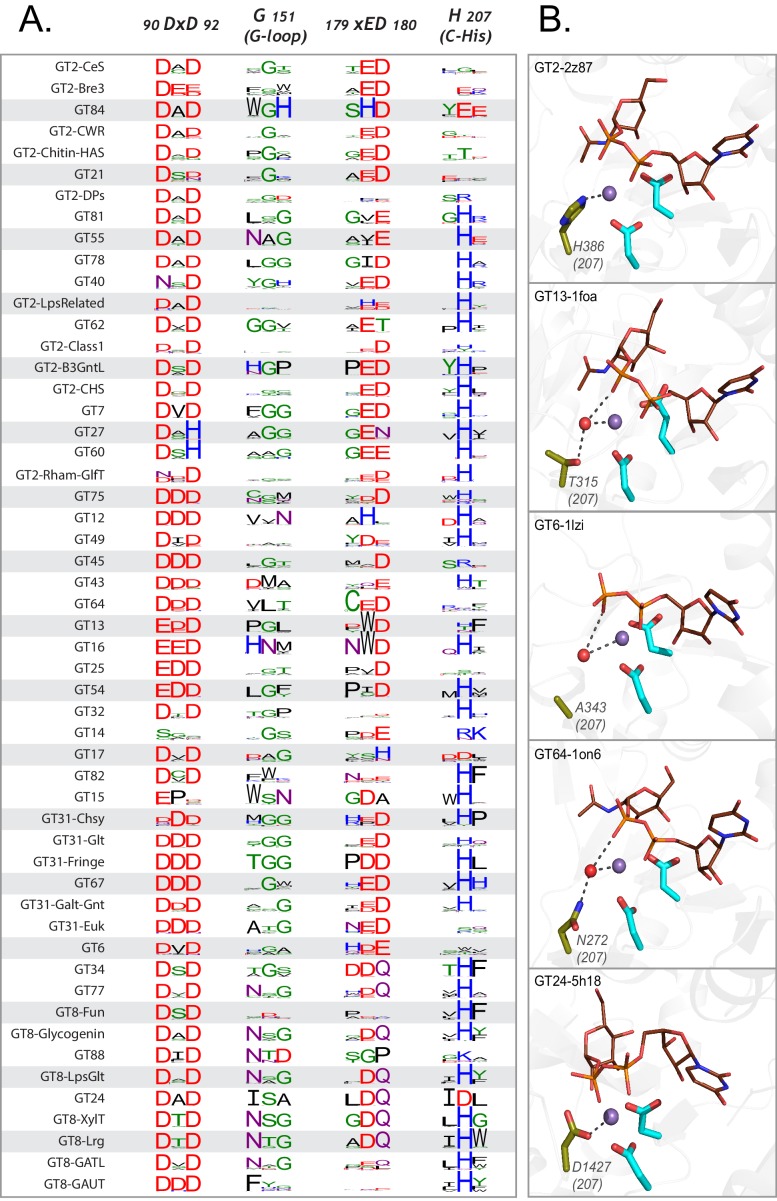
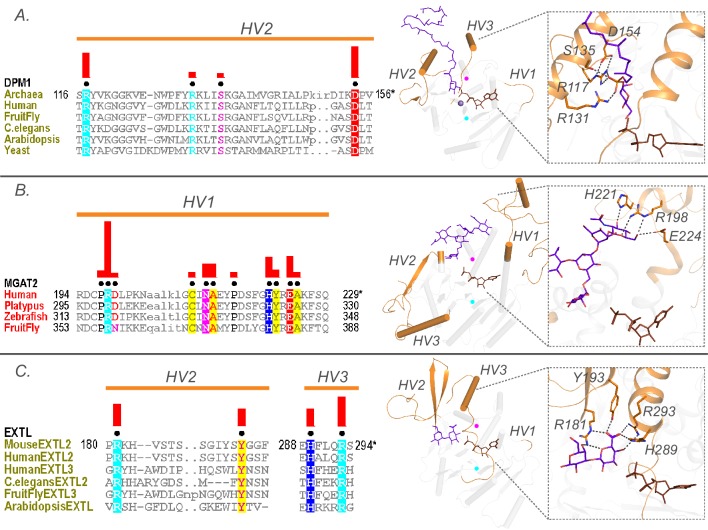
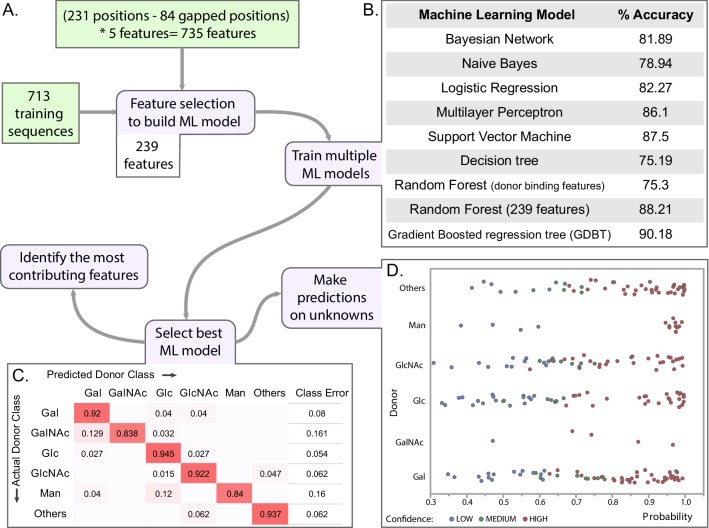
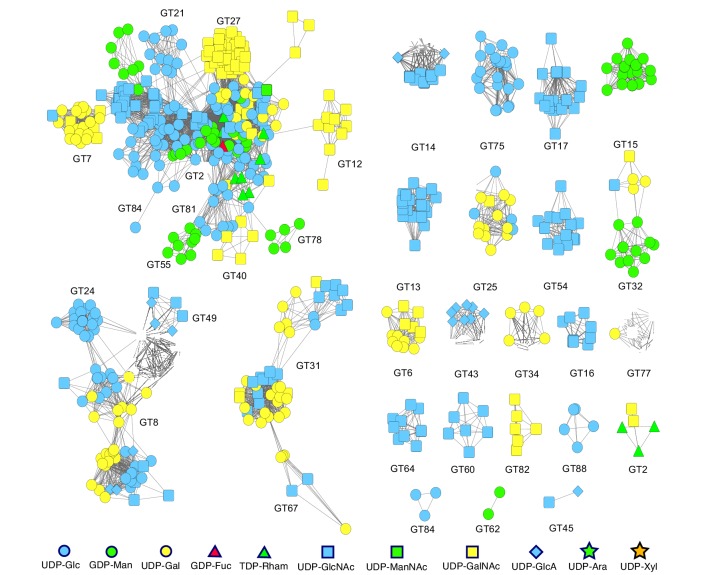
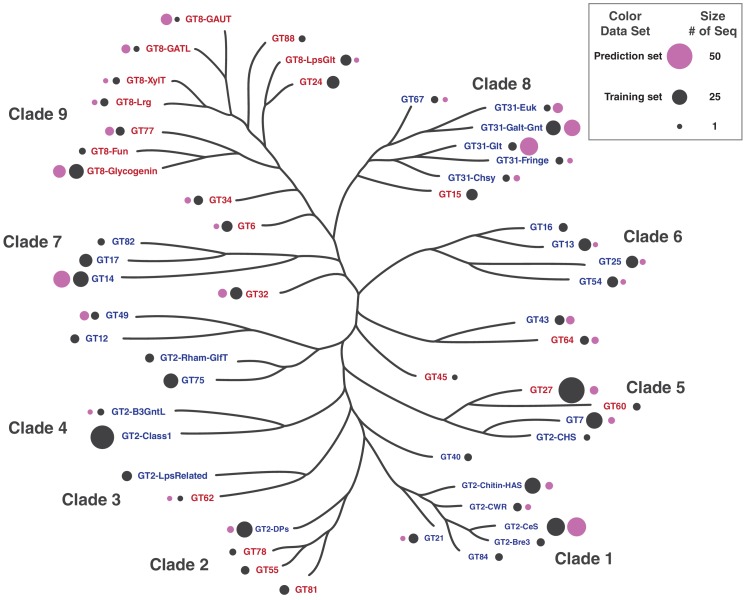
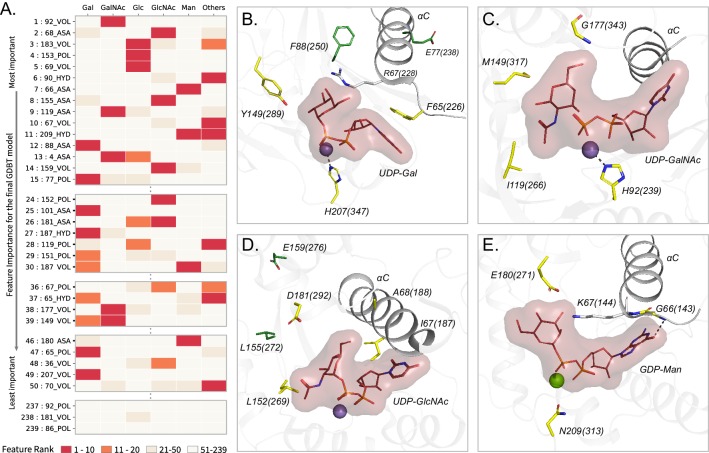
Glycosyltransferases (GTs) are prevalent across the tree of life and regulate nearly all aspects of cellular functions. The evolutionary basis for their complex and diverse modes of catalytic functions remain enigmatic. Here, based on deep mining of over half million GT-A fold sequences, we define a minimal core component shared among functionally diverse enzymes. We find that variations in the common core and emergence of hypervariable loops extending from the core contributed to GT-A diversity. We provide a phylogenetic framework relating diverse GT-A fold families for the first time and show that inverting and retaining mechanisms emerged multiple times independently during evolution. Using evolutionary information encoded in primary sequences, we trained a machine learning classifier to predict donor specificity with nearly 90% accuracy and deployed it for the annotation of understudied GTs. Our studies provide an evolutionary framework for investigating complex relationships connecting GT-A fold sequence, structure, function and regulation.

Keywords: A. thaliana; C. elegans; D. melanogaster; GT evolution; GT phylogeny; S. cerevisiae; common core; computational biology; donor prediction; evolutionary biology; glycosyltransferase; human; machine learning; systems biology.

Plain language summary

Carbohydrates are one of the major groups of large biological molecules that regulate nearly all aspects of life. Yet, unlike DNA or proteins, carbohydrates are made without a template to follow. Instead, these molecules are built from a set of sugar-based building blocks by the intricate activities of a large and diverse family of enzymes known as glycosyltransferases. An incomplete understanding of how glycosyltransferases recognize and build diverse carbohydrates presents a major bottleneck in developing therapeutic strategies for diseases associated with abnormalities in these enzymes. It also limits efforts to engineer these enzymes for biotechnology applications and biofuel production. Taujale et al. have now used evolutionary approaches to map the evolution of a major subset of glycosyltransferases from species across the tree of life to understand how these enzymes evolved such precise mechanisms to build diverse carbohydrates. First, a minimal structural unit was defined based on being shared among a group of over half a million unique glycosyltransferase enzymes with different activities. Further analysis then showed that the diverse activities of these enzymes evolved through the accumulation of mutations within this structural unit, as well as in much more variable regions in the enzyme that extend from the minimal unit. Taujale et al. then built an extended family tree for this collection of glycosyltransferases and details of the evolutionary relationships between the enzymes helped them to create a machine learning framework that could predict which sugar-containing molecules were the raw materials for a given glycosyltransferase. This framework could make predictions with nearly 90% accuracy based only on information that can be deciphered from the gene for that enzyme. These findings will provide scientists with new hypotheses for investigating the complex relationships connecting the genetic information about glycosyltransferases with their structures and activities. Further refinement of the machine learning framework may eventually enable the design of enzymes with properties that are desirable for applications in biotechnology.


Conflict of interest statement

RT, AV, LH, ZZ, WY, KR, SL, AE, KM, NK No competing interests declared

Figures

Figure 1.
Figure 1.. Glycosyltransferase (GT) folds and mechanisms.
Top: The three representative structural folds of GTs. The GT-A fold is characterized by a single globular domain that contains a α/β/α Rossmann nucleotide binding domain (shown 2rj7;GT6). The GT-B fold enzymes are usually metal independent and contain two α/β/α domains separated by a flexible linker region with the substrate binding cleft in between (shown 1jg7;GT63). The GT-C fold enzymes are hydrophobic integral membrane proteins, generally use lipid phosphate linked sugar donors and have multiple transmembrane helices (shown 6gxc; GT66). Bottom: The mechanism of sugar transfer employed by GTs. Inverting GTs follow a direct displacement SN-2-like mechanism that results in an inverted anomeric configuration. The mechanism for retaining GTs is still under debate although recently a same side SNi-type reaction has been proposed where the donor phosphate oxygen acts as a catalytic base and deprotonates the acceptor hydroxyl facilitating a same side attack, that results in the retention of anomeric configuration. The enzyme and catalytic base B are shown in orange. A generic hexose with α-linkage to a nucleoside diphosphate is used. Other mechanisms possibly employed by GTs is discussed in detail in M.
Figure 2.
Figure 2.. The GT-A common core and its elements.
(A) Plot showing the schematics of the GT-A common core with 231 aligned positions. Conserved secondary structures (red α-helices, blue β-sheets, green loops) and hypervariable regions (HVs)(orange) are shown. Conservation score for each aligned position is plotted in the line graph above the schematics. Evolutionarily constrained regions in the core: the hydrophobic positions (yellow) and the active site residues (DxD: Cyan, xED: Magenta, G-loop: green, C-His: olive) are highlighted above the positions. (B) The conserved secondary structures and the location of HVs are shown in the N-terminal GT2 domain of the multidomain chondroitin polymerase structure fromE. coli(PDB: 2z87) that is used as a prototype as it displays closest similarity to the common core consensus. (C) Active site residues of the prototypic GT-A structure. Metal ion and donor substrate are shown as a brown sphere and sticks, respectively. (D) Architecture of the hydrophobic core (Yellow: core conserved in all Rossmann fold containing enzymes, Red: core elements present only in the GT-A fold). Residues are labeled based on their aligned positions. Numbers within parentheses indicate their position in the prototypic (PDB: 2z87) structure.
Figure 2—figure supplement 1.
Figure 2—figure supplement 1.. Structure based sequence alignment showing the hydrophobic residue positions present across a collection of Rossmann fold like enzymes.
The conserved hydrophobic positions are highlighted in yellow blocks. Aligned positions are indicated at the top that correspond to aligned positions in Figure 2D. The alignment extends until the DxD motif. Other regions were unaligned due to very low homology.
Figure 2—figure supplement 2.
Figure 2—figure supplement 2.. Changes in the extended hydrophobic core residues in selected retaining families.
(A) The conserved hydrophobic core in the prototypic GT (2z87). (B and C) Hydrophobic residue in the core is substituted by an Arginine and a Glutamate in GT15 and GT55 respectively. The charged residue replacing the hydrophobic residue of the core is highlighted in red sticks. The xED motif is shown in magenta.
Figure 2—figure supplement 3.
Figure 2—figure supplement 3.. Comparison of structures for HV regions across GT-A families.
The GT-A common core is shown in surface in the middle. HVs are shown in shades of orange (HV1: light orange, HV2: dark orange, HV3: orange red). Root Mean Square Deviation (RMSD) was calculated by aligning the core GT-A domains of representative structures with and without the HVs. A significant reduction in the RMSD values was observed after removing HVs that is shown in the box plot in the center. *p-value<0.0001, t-test.
Figure 3.
Figure 3.. Phylogenetic tree highlighting the 53 major GT-A fold subfamilies.
Tips in this tree represent GT-A sub-families condensed from the original tree for illustration. Support values are indicated using different circles. Circles at the tips indicate bootstrap support for the GT-A family clade represented by that tip. Tips missing the circles represent GT-A families that do not form a single monophyletic clade. Nodes missing circles have a bootstrap support less than 50% and are unresolved. Icon labels indicate the taxonomic diversity of that sub clade. Colors indicate the mechanism for the families (blue: Inverting, red: Retaining). This condensed tree was generated by collapsing clades to the deepest node that includes sequences from the same family. For GT-A families that did not form a monophyletic clade, the clade that included the most sequences from that family was chosen. Branch lengths may approximate the original distances, but are not drawn to scale. Detailed tree with support values, expanded nodes and scaled branch lengths are provided in Figure 3—figure supplement 1 and in Newick format in Figure 3—source data 4. The family names are described in Figure 3—source data 1.
Figure 3—figure supplement 1.
Figure 3—figure supplement 1.. Complete phylogenetic tree of 993 representative GT-A sequences.
Sequences are provided in Figure 3—source data 2. Clades are colored for each of the 53 GT-A families and labeled. Values at nodes indicate bootstrap support with 1000 replicates. Values for all major nodes are indicated. This tree is also provided in Newick text format in Figure 3—source data 4.
Figure 3—figure supplement 2.
Figure 3—figure supplement 2.. Clade specific conserved features in the HVs.
The conserved mode of donor binding in clade 9, conserved mode of acceptor binding in clade two and the conserved QXXRW motif in clade one are illustrated. HVs are shown in orange. Metal ions are shown as spheres. Red bars above the alignment indicate the extent of significance of conservation of residue in the column (Higher is more significantly conserved). Below every position in the alignment, numbers indicate the extent of conservation of residues at the position.
Figure 3—figure supplement 3.
Figure 3—figure supplement 3.. Sankey diagram comparing topologies of phylogenetic tree with pdb and hmm based clustering of GT-A families.
Each column highlights clusters of GT-A families obtained through different methods (from left to right: PDB structural alignment clustering, GT-A phylogeny and hmm-distance based tree). Corresponding GT-A families within clusters are connected through colored links. Non overlapping links indicate an agreement in the placement of families across methods. Full clusters and trees are shown below the columns.
Figure 4.
Figure 4.. Variations in the GT-A conserved core.
(A) Weblogo depicting the conservation of active site residues in the common core are shown for each of the GT-A families. Residues are colored based on their physiochemical properties. (B) Variations in the C-His is compensated either using a water molecule (red sphere) or other charged residues (olive sticks) to conserve its interactions. The metal ion is shown as a purple sphere. The donor substrate is shown as brown lines. Interactions between the residues, metal ion and the donor are shown using dotted lines.
Figure 5.
Figure 5.. Family specific conserved features in the HV regions correlate with acceptor recognition and specificity.
Conserved residues in A) HV2 of the DPM1 sequences in the GT2-DP subfamily coordinate the phosphate group of the acceptor. (B) HV1 of GT16 MGAT1 provide acceptor specificity. (C) HV2 and HV3 of EXTL GT64 family (C-terminal GT domain of the multidomain sequences) coordinate the acceptor. Left: Alignments highlighting the constrained residues are shown for each family. The family specific conserved residues are shown using black dots above the alignment. Red bars above these dots indicate the significance of conservation (Higher bar corresponds to more significantly conserved position). Right: Representative pdb structures are shown for each family (GT2-DP:5mm1, GT16:5vcs, GT64:1on8); Donor substrates are colored brown. Acceptors are colored purple. HVs are highlighted in orange. The position of the conserved DxD and xED motif for each structure is shown as cyan and magenta circles respectively.
Figure 6.
Figure 6.. Machine learning (ML) approach for predicting donor class.
(A) Brief pipeline of the ML analysis. Training set input into the pipeline are shown in green boxes. Steps of the ML analysis in purple boxes are associated with different panels of the figure. (B) Percent accuracy based on 10-fold cross validation (CV) for each of the trained ML models. (C) Confusion matrix from the best model (GDBT using 239 features). (D) Scatter plot showing the probability scores assigned for each predicted sequence by the predicted donor type. Colors indicate the confidence level of the prediction based on probability of assignment to a given donor class as well as confidence intervals of the predicted class i.e. difference in probability values between the 1st prediction class and the 2nd prediction class. (Figure 6—source data 2).
Figure 6—figure supplement 1.
Figure 6—figure supplement 1.. Sequence homology-based network of all the experimentally characterized sequences form the GT-A fold families.
Nodes represent the sequences that were annotated as characterized and collected from the CAZy database to be used in the training dataset for ML. The color and shape of the nodes indicate the donor specificity for that sequence. An edge between two nodes indicate that the sequences are homologous with an e-value better than 1e-5. Smaller edge distance indicates a higher similarity between nodes. An edge-weighted spring embedded layout from Cytoscape was implemented to minimize edge crossings and enhance visual interpretability. At multiple locations in the network, closely related sequences differ in donor specificity, rendering prediction through similarity alone difficult.
Figure 6—figure supplement 2.
Figure 6—figure supplement 2.. Distribution of training and prediction datasets used in machine learning.
The size of the bubbles next to GT-A family names indicates the number of sequences in the training and prediction set from that family. Color of the bubbles indicate training or prediction set.
Figure 7.
Figure 7.. Top Contributing features from the GDBT model associated with sugar donor specificity.
(A) Heatmap showing the contributions of representative features. Features are ordered based on their importance for the final GDBT model along the vertical axis. The heatmap colors indicate how important each feature is for a given sugar donor type with red indicating ranks 1–10 (highly important) (M). (B–E) Contributing features important for individual donor types are mapped onto representative structures. The amino acids at the feature positions are shown in yellow sticks and labelled. Feature positions distal from the donor binding site are shown in green sticks. Labels include the amino acid code, aligned residue position and the amino acid position in the crystal structure within parentheses. Donor substrate with the sugar is shown in lines with surface bounds. Divalent metal ions are shown as spheres. The αC helix is shown. (B) Gal features mapped to a bovine β−1,4 Gal transferase (PDB ID: 1o0r). (C) GalNAc features mapped to a human UDP-GalNAc: polypeptide alpha-N-acetylgalactosaminyltransferase (PDB ID: 2d7i). (D) GlcNAc features mapped to a rabbit N-acetylglucosaminyltransferase I (PDB ID: 1foa). (E) Man features mapped to a bacterial Mannosyl-3-Phosphoglycerate Synthase (PDB ID: 2wvl).

References

    1. Albesa-Jové D, Romero-García J, Sancho-Vaello E, Contreras FX, Rodrigo-Unzueta A, Comino N, Carreras-González A, Arrasate P, Urresti S, Biarnés X, Planas A, Guerin ME. Structural snapshots and loop dynamics along the catalytic cycle of glycosyltransferase GpgS. Structure. 2017;25:1034–1044. doi: 10.1016/j.str.2017.05.009. - DOI - PubMed
    1. Alonso MD, Lomako J, Lomako WM, Whelan WJ. A new look at the biogenesis of glycogen. The FASEB Journal. 1995;9:1126–1137. doi: 10.1096/fasebj.9.12.7672505. - DOI - PubMed
    1. Altschul SF, Gish W, Miller W, Myers EW, Lipman DJ. Basic local alignment search tool. Journal of Molecular Biology. 1990;215:403–410. doi: 10.1016/S0022-2836(05)80360-2. - DOI - PubMed
    1. Andreeva A, Howorth D, Chothia C, Kulesha E, Murzin AG. SCOP2 prototype: a new approach to protein structure mining. Nucleic Acids Research. 2014;42:D310–D314. doi: 10.1093/nar/gkt1242. - DOI - PMC - PubMed
    1. Armougom F, Moretti S, Poirot O, Audic S, Dumas P, Schaeli B, Keduas V, Notredame C. Expresso: automatic incorporation of structural information in multiple sequence alignments using 3D-Coffee. Nucleic Acids Research. 2006;34:W604–W608. doi: 10.1093/nar/gkl092. - DOI - PMC - PubMed

Publication types

Substances