

doi: 10.1053/j.gastro.2020.03.045.
Epub 2020 Mar 28.
Multiomics Evaluation of Gastrointestinal and Other Clinical Characteristics of COVID-19
Affiliations
- PMID: 32234303
- PMCID: PMC7270476
- DOI: 10.1053/j.gastro.2020.03.045
Item in Clipboard
Multiomics Evaluation of Gastrointestinal and Other Clinical Characteristics of COVID-19
Gastroenterology.
2020 Jun.
No abstract available
Keywords: COVID-19; Gastrointestinal Symptoms; Multiomics; SARS-CoV-2.
Figures
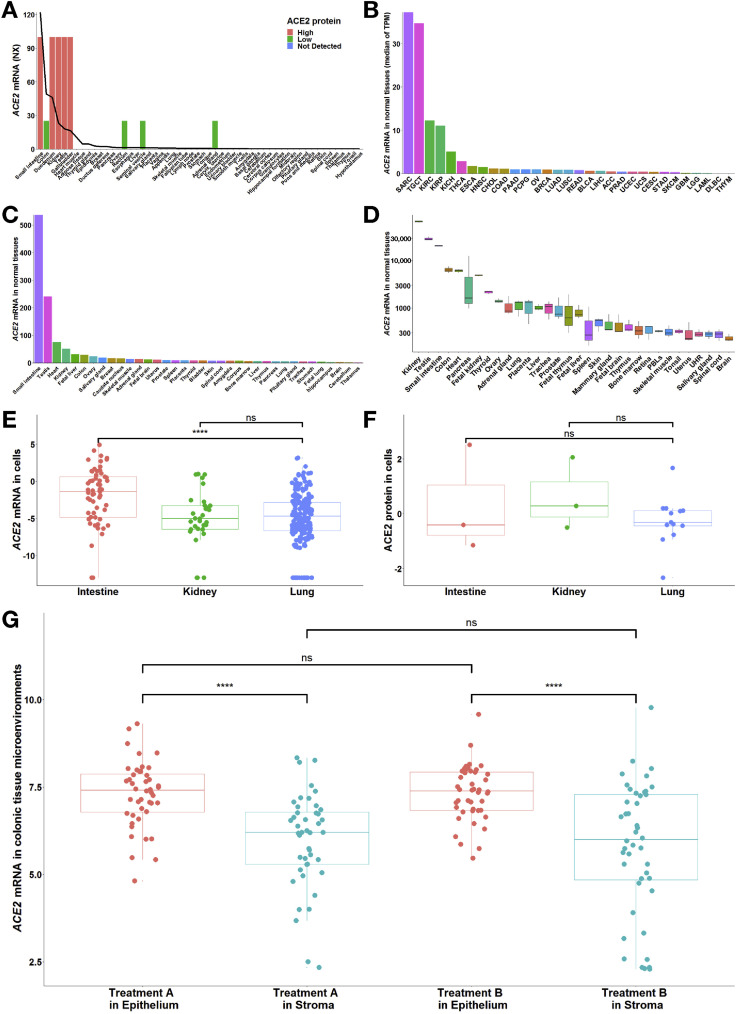
Expression pattern of ACE2 across tissues and cells in the human body. (A) At the mRNA level, in combined data from Human Protein Atlas, Genotype Tissue Expression, and Functional Annotation of The Mammalian Genome, the top 5 tissues included those from 3 digestive organs (intestinal tract), along with the kidney and testis, indicating the intestine specificity of ACE2 (with normalized expression values of 122, 49.1 and 46 in small intestine, colon, and duodenum, respectively). The line represents the normalized expression value of ACE2 across all tissues. At the protein level, in samples from Human Protein Atlas, 9 tissues were stained with ACE2, among which 5 tissues were highly stained, including tissues from 2 digestive organs (duodenum and small intestine), and 4 tissues were minimally stained, including tissues from digestive organs (colon and rectum). Furthermore, similar to ACE2 mRNA, ACE2 protein was enriched in the kidney and testis. The bars indicate the immunohistochemical results for ACE2 protein. Antibody staining was reported as not detected, low, medium, or high, and the score was based on the staining intensity and fraction of stained cells. (B–D) Among the normal tissues with ACE2 mRNA expression from (B) The Cancer Genome Atlas (TCGA) and (C, D) Gene Expression Omnibus, the top tissues also included those from the intestine, kidney, and testis. We excluded SARC in TCGA because it contained only 2 samples of normal tissues. (C) GSE2361-supplied gene expression profiles in 36 normal human tissues with only 1 sample per tissue. (D) GSE7905-collected gene expression profiles from 31 normal tissues and a Universal Human Reference RNA, which used 3 replicates per tissue for a total of 96 samples. (E) At the mRNA level, ACE2 expression in the intestinal cell lines (n = 60; –2.08 ± 4.02) was higher than that in the lung cell lines (n = 194; –5.00 ± 3.51; ∗∗∗∗P = 2.88 × 10⁻⁶), but there was no significant difference between the kidney (n = 32; –4.92 ± 3.59) and lung cell lines. (F) At the protein level, the differences in ACE2 expression among the intestine (n = 3; 0.31 ± 1.94), kidney (n = 3; 0.61 ± 1.31) and lung (n = 13; –0.26 ± 0.89) cell lines were not statistically significant. Values are reported as mean ± standard deviation. Both mRNA and protein expression levels were adjusted by the global normalization. (G) GSE71571-provided gene expression profiles in the epithelial and stromal cells of normal colon in 44 healthy individuals recruited for an aspirin intervention trial. Briefly, participants were randomly assigned to the order in which they received treatment A or treatment B, respectively. (The type of treatment included active [aspirin] and placebo but was masked. The study authors must be contacted directly for unblinding). A paired t test was used for the comparison of ACE2 mRNA between epithelial and stromal cells (∗∗∗∗P = 4.60 × 10⁻⁸ in treatment A; ∗∗∗∗P = 8.81 × 10⁻⁷ in treatment B). An unpaired t test was applied for the comparison of ACE2 mRNA between treatment A and B. More details are provided in the Supplementary Methods. ACC, adrenocortical carcinoma; BLCA, bladder urothelial carcinoma; BRCA, breast invasive carcinoma; CESC, cervical squamous cell carcinoma and endocervical adenocarcinoma; CHOL, cholangiocarcinoma; COAD, colon adenocarcinoma; DLBC, Lymphoid neoplasm diffuse large B-cell lymphoma; ESCA, esophageal carcinoma; GBM, glioblastoma multiforme; HNSC, head and Neck squamous cell carcinoma; KICH, kidney chromophobe; KIRC, kidney renal clear cell carcinoma; KIRP, kidney renal papillary cell carcinoma; LAML, acute myeloid leukemia; LGG, brain lower-grade glioma; LIHC, liver hepatocellular carcinoma; LUAD, lung adenocarcinoma; LUSC, lung squamous cell carcinoma; MESO, mesothelioma; ns, no significance; OV, ovarian serous cystadenocarcinoma; PAAD, pancreatic adenocarcinoma; PCPG, pheochromocytoma and paraganglioma; PRAD, prostate adenocarcinoma; READ, rectum adenocarcinoma; SARC, sarcoma; SKCM, skin cutaneous melanoma; STAD, stomach adenocarcinoma; TGCT, testicular germ cell tumors; THCA, thyroid carcinoma; THY, thymoma; TPM, transcripts per million; UCEC, uterine corpus endometrial carcinoma; UCS, uterine carcinosarcoma; UHR, Universal Human Reference RNA; UVM, uveal melanoma.
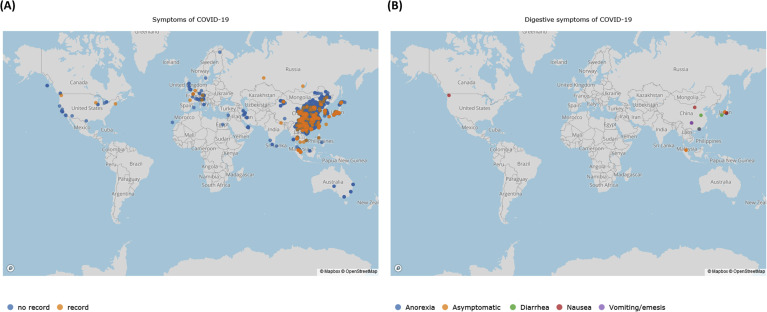
The global distribution of COVID-19 cases. The data set was downloaded on February 23, 2020 (https://tinyurl.com/s6gsq5y ). (A) On that date, a total of 26,357 cases were distributed around the world, among which 398 cases (39 cases derived from Hubei and 359 from outside Hubei) recorded with complete clinical symptoms at the onset of illness are marked in orange, and the cases without recorded clinical symptoms are shown in blue. (B) Patients with symptoms in digestive system or asymptomatic carriers are marked in varying colors. A Web site location provided a user-friendly interface for visualization of clinical symptoms (https://mulongdu.shinyapps.io/map_covid/ ).
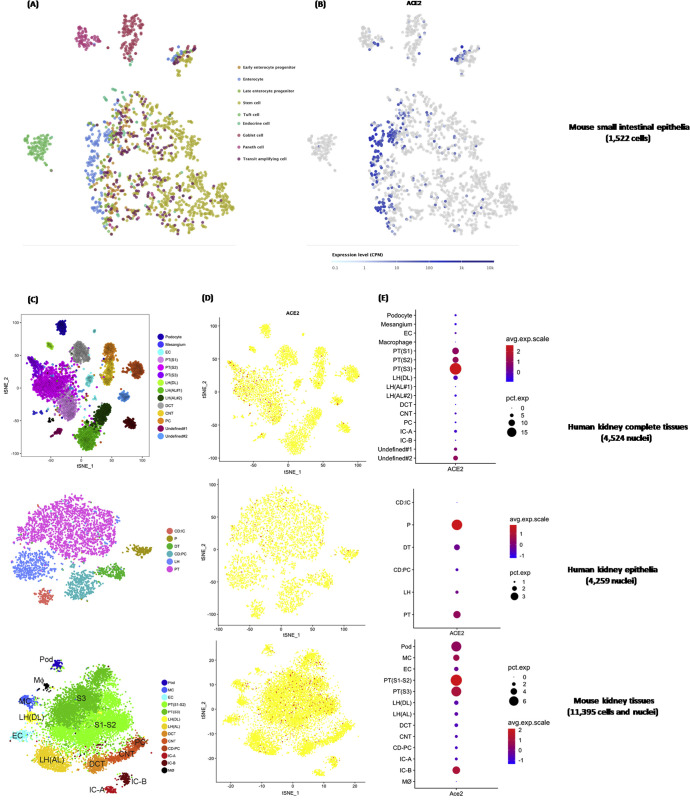
Single-cell RNA sequencing data showing the ACE2 expression pattern in the intestinal tract and kidney. (A) tSNE plot of small intestinal epithelial cell subgroups. Cells were partitioned into 9 groups: early enterocyte progenitor, enterocyte, late enterocyte progenitor, stem cell, tuft cell, endocrine cell, goblet cell, Paneth cell, and transit amplifying cell. (B) Cells expressing ACE2 expression are colored blue, indicating enrichment of ACE2 in intestinal enterocytes. (C) tSNE plot of cell subgroups for each kidney data set. Cells from human and mouse kidney tissues were grouped by kidney anatomy: ascending limb (AL), collecting duct–principal cell (CD-PC), connecting tubule (CNT), distal convoluted tubule (DCT/DT), descending limb (DL), endothelial cell (EC), intercalated cell (IC), loop of Henle (LH), mesangial cell (MC), macrophage (MΦ), podocyte (Pod/P), and proximal tubule (PT). (D) Cells expressing ACE2 are colored red, indicating enrichment of ACE2 in the proximal tubule of the kidney. (E) The abundance of ACE2 expression across each cell subgroup in human and mouse kidneys. avg, average; exp, expression; CPM, counts per million; pct, percent; tSNE, t-distributed stochastic neighbor embedding.
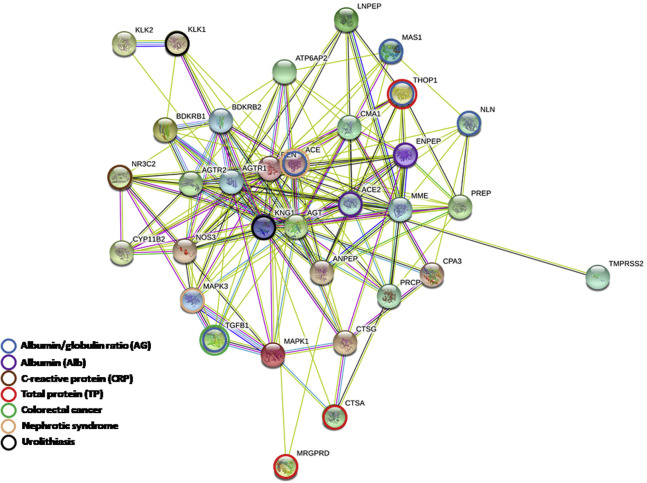
Network of genes in the ACE2 pathway. The network was constructed by STRING (https://string-db.org/ ) with the default parameters.
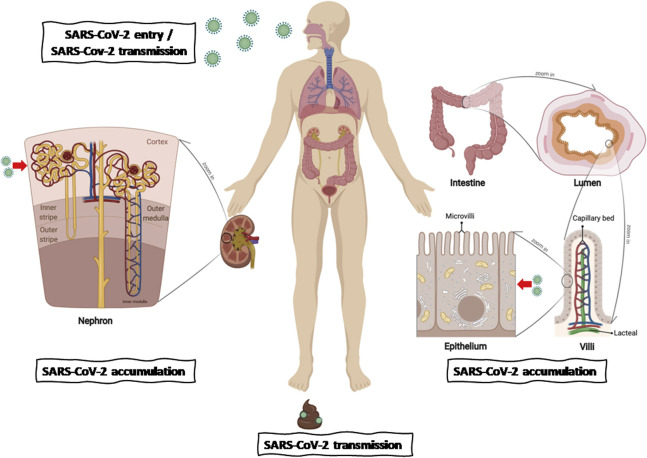
Schematic of the bulk-to-cell strategy for evaluating SARS-CoV-2 infection, accumulation, and transmission across hosts. The diagram was constructed with BioRender (https://biorender.com/ ).
Comment in
-
Gastrointestinal ACE2, COVID-19 and IBD: Opportunity in the Face of Tragedy?Gastroenterology. 2020 Oct;159(4):1623-1624.e3. doi: 10.1053/j.gastro.2020.04.051. Epub 2020 Apr 27. Gastroenterology. 2020. PMID: 32353370 Free PMC article. No abstract available.
References
MeSH terms
Substances
LinkOut - more resources
Full Text Sources
Miscellaneous
