

Linking Light-Dependent Life History Traits with Population Dynamics for Prochlorococcus and Cyanophage
- PMID: 32234774
- PMCID: PMC7112961
- DOI: 10.1128/mSystems.00586-19
Linking Light-Dependent Life History Traits with Population Dynamics for Prochlorococcus and Cyanophage
Erratum in
-
Correction for Demory et al., "Linking Light-Dependent Life History Traits with Population Dynamics for Prochlorococcus and Cyanophage".mSystems. 2021 Oct 26;6(5):e0100521. doi: 10.1128/mSystems.01005-21. Epub 2021 Sep 14. mSystems. 2021. PMID: 34519529 Free PMC article. No abstract available.
Abstract
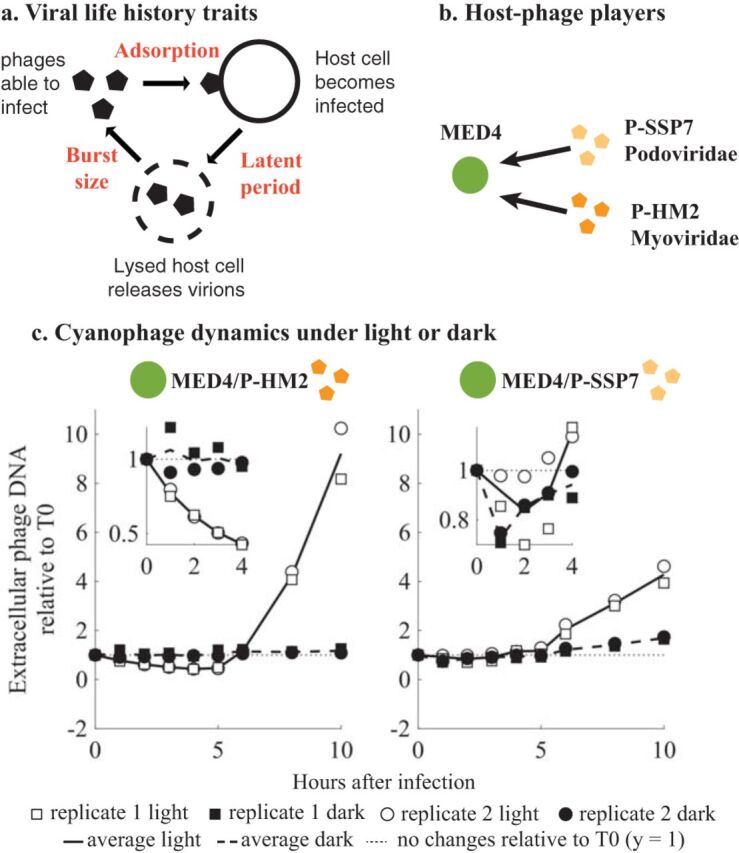
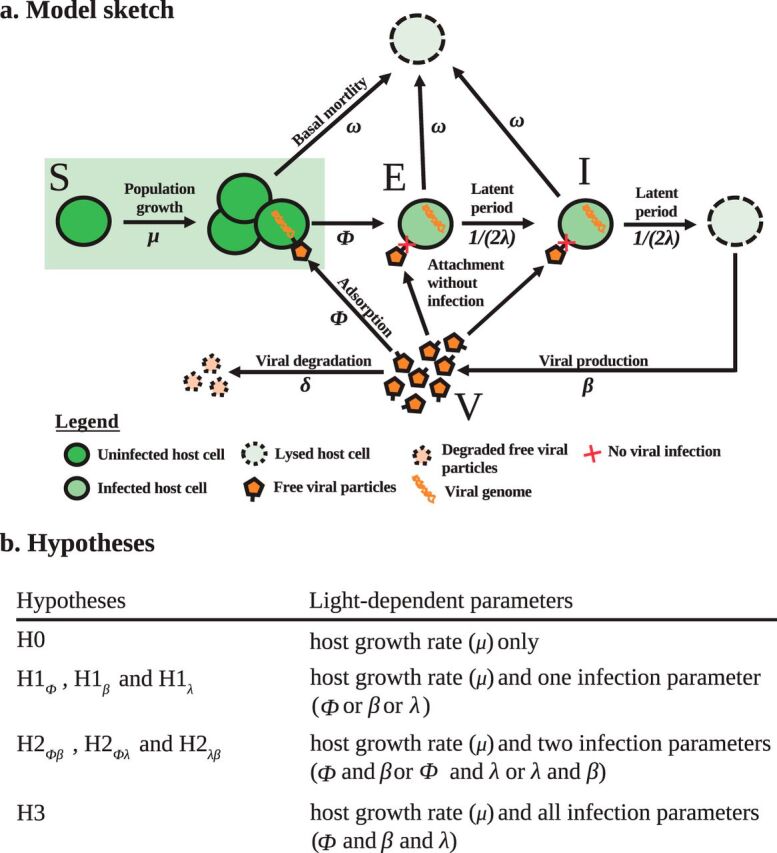
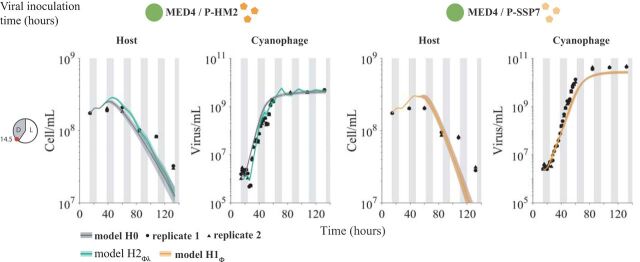
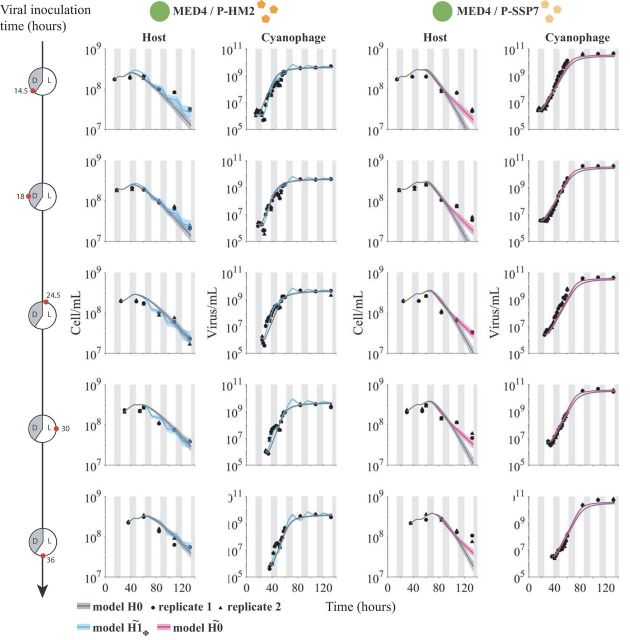
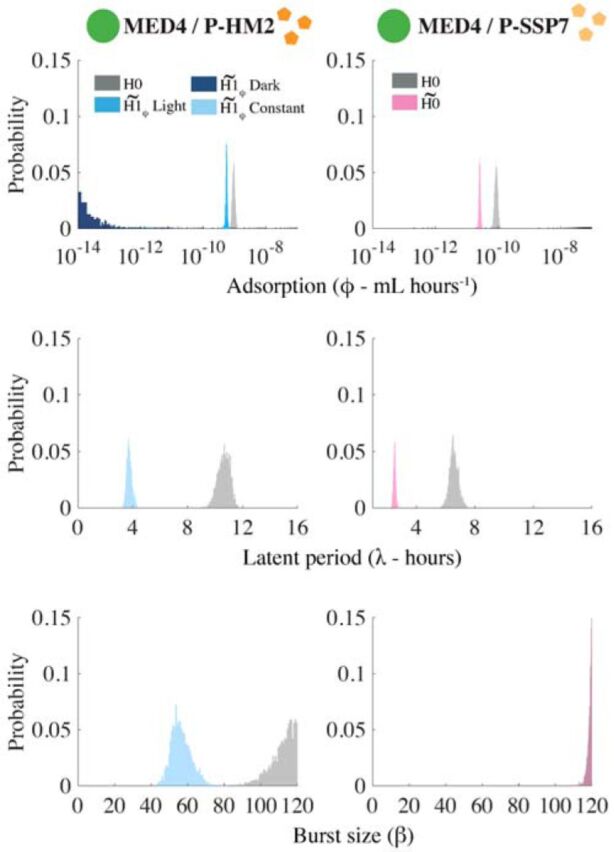
Prochlorococcus cyanobacteria grow in diurnal rhythms driven by diel cycles. Their ecology depends on light, nutrients, and top-down mortality processes, including lysis by viruses. Cyanophage, viruses that infect cyanobacteria, are also impacted by light. For example, the extracellular viability and intracellular infection kinetics of some cyanophage vary between light and dark conditions. Nonetheless, it remains unclear whether light-dependent viral life history traits scale up to influence population-level dynamics. Here, we examined the impact of diel forcing on both cellular- and population-scale dynamics in multiple Prochlorococcus-phage systems. To do so, we developed a light-driven population model, including both cellular growth and viral infection dynamics. We then tested the model against measurements of experimental infection dynamics with diel forcing to examine the extent to which population level changes in both viral and host abundances could be explained by light-dependent life history traits. Model-data integration reveals that light-dependent adsorption can improve fits to population dynamics for some virus-host pairs. However, light-dependent variation alone does not fully explain realized host and virus population dynamics. Instead, we show evidence consistent with lysis saturation at relatively high virus-to-cell ratios. Altogether, our study represents a quantitative approach to integrate mechanistic models to reconcile Prochlorococcus-virus dynamics spanning cellular-to-population scales.IMPORTANCE The cyanobacterium Prochlorococcus is an essential member of global ocean ecosystems. Light rhythms drive Prochlorococcus photosynthesis, ecology, and interactions with potentially lethal viruses. At present, the impact of light on Prochlorococcus-virus interactions is not well understood. Here, we analyzed Prochlorococcus and virus population dynamics with a light-driven population model and compared our results with experimental data. Our approach revealed that light profoundly drives both cellular- and population-level dynamics for some host-virus systems. However, we also found that additional mechanisms, including lysis saturation, are required to explain observed host-virus dynamics at the population scale. This study provides the basis for future work to understand the intertwined fates of Prochlorococcus and associated viruses in the surface ocean.
Keywords: cyanobacteria; cyanophage; diurnal rhythm; light-dark cycle; modeling; virus.
Copyright © 2020 Demory et al.
Figures
References
-
- Chisholm SW, Olson RJ, Zettler ER, Goericke R, Waterbury JB, Welschmeyer NA. 1988. A novel free-living prochlorophyte abundant in the oceanic euphotic zone. Nature 334:340–343. doi:10.1038/334340a0. - DOI
-
- Flombaum P, Gallegos JL, Gordillo RA, Rincón J, Zabala LL, Jiao N, Karl DM, Li WKW, Lomas MW, Veneziano D, Vera CS, Vrugt JA, Martiny AC. 2013. Present and future global distributions of the marine cyanobacteria Prochlorococcus and Synechococcus. Proc Natl Acad Sci U S A 110:9824–9829. doi:10.1073/pnas.1307701110. - DOI - PMC - PubMed
-
- Rocap G, Larimer FW, Lamerdin J, Malfatti S, Chain P, Ahlgren NA, Arellano A, Coleman M, Hauser L, Hess WR, Johnson ZI, Land M, Lindell D, Post AF, Regala W, Shah M, Shaw SL, Steglich C, Sullivan MB, Ting CS, Tolonen A, Webb EA, Zinser ER, Chisholm SW. 2003. Genome divergence in two Prochlorococcus ecotypes reflects oceanic niche differentiation. Nature 424:1042–1047. doi:10.1038/nature01947. - DOI - PubMed
LinkOut - more resources
Full Text Sources
