. 2020 Jun;19(6):944-959.
doi: 10.1074/mcp.RA119.001792. Epub 2020 Mar 31.

Selection of Features with Consistent Profiles Improves Relative Protein Quantification in Mass Spectrometry Experiments

Affiliations

Selection of Features with Consistent Profiles Improves Relative Protein Quantification in Mass Spectrometry Experiments

Tsung-Heng Tsai et al. Mol Cell Proteomics. 2020 Jun.

Abstract

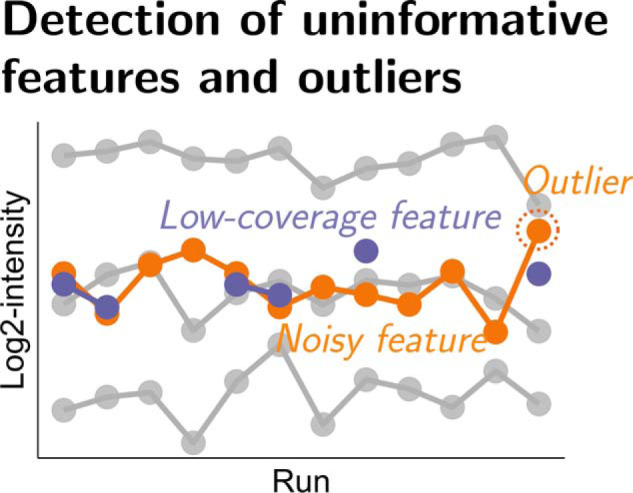
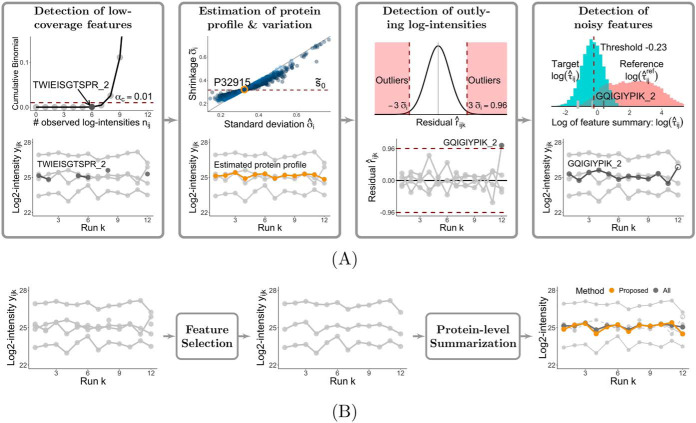
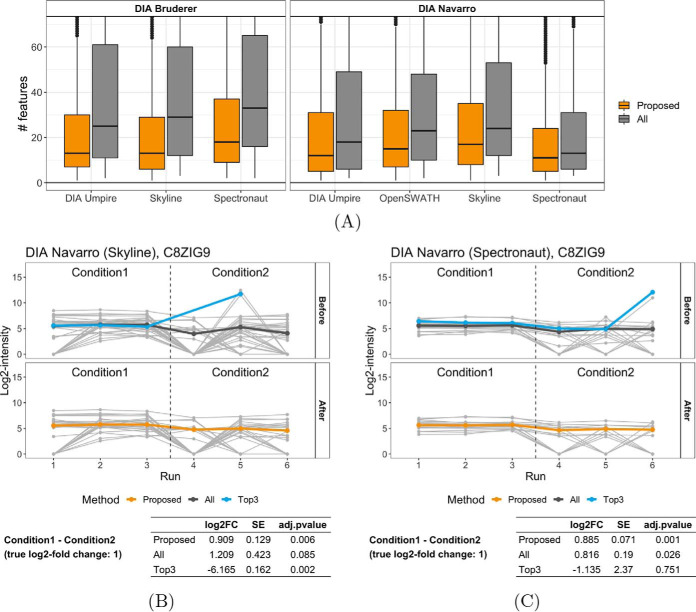
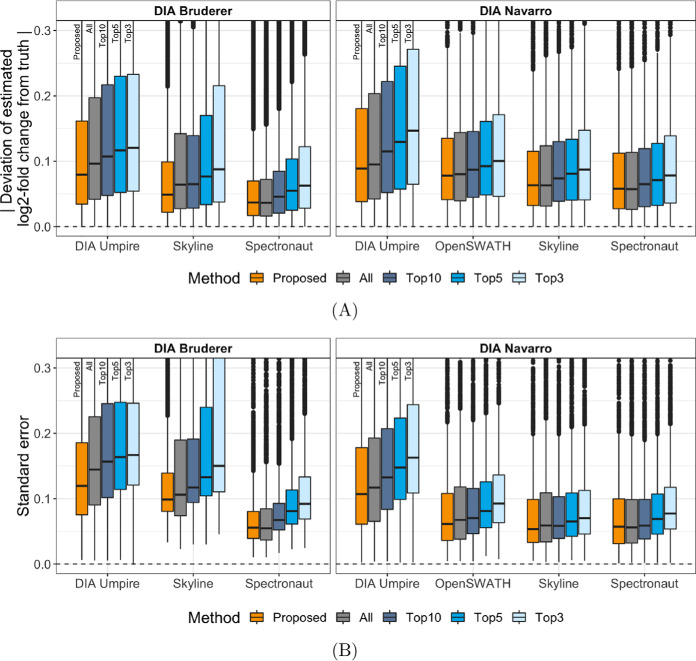
In bottom-up mass spectrometry-based proteomics, relative protein quantification is often achieved with data-dependent acquisition (DDA), data-independent acquisition (DIA), or selected reaction monitoring (SRM). These workflows quantify proteins by summarizing the abundances of all the spectral features of the protein (e.g. precursor ions, transitions or fragments) in a single value per protein per run. When abundances of some features are inconsistent with the overall protein profile (for technological reasons such as interferences, or for biological reasons such as post-translational modifications), the protein-level summaries and the downstream conclusions are undermined. We propose a statistical approach that automatically detects spectral features with such inconsistent patterns. The detected features can be separately investigated, and if necessary, removed from the data set. We evaluated the proposed approach on a series of benchmark-controlled mixtures and biological investigations with DDA, DIA and SRM data acquisitions. The results demonstrated that it could facilitate and complement manual curation of the data. Moreover, it can improve the estimation accuracy, sensitivity and specificity of detecting differentially abundant proteins, and reproducibility of conclusions across different data processing tools. The approach is implemented as an option in the open-source R-based software MSstats.

Keywords: Statistics; bioinformatics; biostatistics; computational biology; label-free quantification; mass spectrometry; multiple reaction monitoring; quantification; selected reaction monitoring; targeted mass spectrometry.


Conflict of interest statement

The authors declare that they have no conflicts of interest with the contents of this article

Figures

None
Graphical abstract
Fig. 1.
Fig. 1.
Overview of the proposed feature selection approach, illustrated with the case of protein P32915 from the DDA iPRG experiment, analyzed by MaxQuant. A, Four major steps, and their intermediate results: detection of low-coverage features, estimation of representative patterns of the protein, detection of outlying log-intensities, and detection of noisy features. The detection of low-coverage features is detailed in Detection of Low-coverage Features. The remaining steps are detailed in Detection of Outliers and Noisy Features. The example protein has five features quantified across 12 runs, where feature TWIEISGTSPR_2 (highlighted in dark gray in the first panel) has six observed log-intensities, which are significantly fewer than as expected. The feature is labeled as low-coverage, and is excluded. The remaining four features are used to estimate the representative protein profile and variation, as highlighted in yellow in the second panel. The log-intensity from feature GQIGIYPIK_2 and run 12 significantly deviates from the estimated patterns, and is labeled as an outlier (highlighted in dark gray in the third panel). Finally, feature GQIGIYPIK_2 (highlighted in dark gray in the fourth panel) exhibits substantial variation between the runs, and is labeled as a noisy feature. B, Application of the proposed feature selection approach for protein-level summarization and statistical inference. The profile plots of the protein with all the features and with the selected informative features are shown in the first two panels, where the detected outlier and uninformative features (TWIEISGTSPR_2 and GQIGIYPIK_2) are removed in the second panel. The informative features are used as input to perform subsequent statistical analyses. The third panel shows the results of protein-level summarization, using the informative features (shown in light gray, solid lines), or using all the features that also include the uninformative features (shown in dashed lines). The protein-level summary with the proposed approach and that with all the features are shown in yellow and dark gray, respectively.
Fig. 2.
Fig. 2.
Performance of the proposed feature selection approach in the DIA benchmarks. A, Number of features per protein, before and after the proposed selection of informative features. B–C, Example protein C8ZIG9 from the Navarro benchmark, quantified with (B) Skyline and (C) Spectronaut, highlights representative patterns of uninformative features, and their impact on the relative protein quantification. The plots show the features before and after the selection of informative features. They contrast the protein-level summaries by the proposed approach to those with all the features and with the top-3 features. The table below each plot summarizes the relative protein quantification in terms of the estimate of log-fold change (FC), its standard error, and FDR-adjusted p value, as determined by MSstats. Some low-intensity outliers are because of missing values, which are not considered by the proposed approach.
Fig. 3.
Fig. 3.
Performance evaluation for the background proteins (i.e. true log2-fold change between conditions is zero) in the DIA benchmarks. A, The absolute errors, i.e. deviation of the estimated log-fold change from the truth, for all background proteins in the Bruderer benchmark (left panel) and the Navarro benchmark (right panel), quantified with DIA Umpire, OpenSWATH, Skyline or Spectronaut. The proposed selection of informative features was compared with the all-features and top-n quantifications. Smaller values indicate better performance. B, The standard errors associated with the log-fold change estimates. Smaller values indicate better performance.
Fig. 4.
Fig. 4.
Euler diagrams for detected true changes across data processing tools in (A) the Bruderer benchmark and (B) the Navarro benchmark, using the proposed selection of informative features, and the all-features and top-n quantifications.
Fig. 5.
Fig. 5.
Performance of the proposed feature selection approach in the DDA benchmarks. A, Number of features per protein, before and after the proposed selection of informative features. B–C, Example protein P32898 from the iPRG benchmark, quantified with (B) Progenesis and (C) Skyline, highlights representative patterns of uninformative features, and their impact on the relative protein quantification. Progenesis quantified the protein with only four features, including two with inconsistent, high-intensity profile in runs 4–6. On the other hand, the Skyline analysis included more features, and majority of them formed a consistent pattern.
Fig. 6.
Fig. 6.
Impact of data processing options on the proposed selection of informative features, and the relative protein quantification in the four Selevsek data sets. A, Number of total proteins and number of detected changes over time with the all-features quantification. B, Profile plot for protein YPL117C in Full_Sparse, where uninformative features are shown in dashed lines and outliers are depicted with open circles. Protein-level summaries with the proposed approach (yellow) and the all-features quantification (dark gray) are shown on top of quantified features. The table summarizes the relative protein quantification of T2-T0, with both approaches. C–D, Same as in (B), but for the data sets Full_50% and LowCV_Sparse. E Euler diagrams for detected changes in the T2-T0 comparison across the four data sets, using all the features. F, Same as in (E), but using the selected informative features.

References

    1. Abbatiello S. E., Mani D. R., Keshishian H., and Carr S. A. (2010) Automated detection of inaccurate and imprecise transitions in peptide quantification by multiple reaction monitoring mass spectrometry. Clin. Chem. 56, 291–305 - PMC - PubMed
    1. Aebersold R., and Mann M. (2003) Mass spectrometry-based proteomics. Nature 422, 198–207 - PubMed
    1. Aebersold R., and Mann M. (2016) Mass-spectrometric exploration of proteome structure and function. Nature 537, 347–355 - PubMed
    1. Bruderer R., Bernhardt O. M., Gandhi T., Miladinović S. M., Cheng L.-Y., Messner S., Ehrenberger T., Zanotelli V., Butscheid Y., Escher C., Vitek O., Rinner O., and Reiter L. (2015) Extending the limits of quantitative proteome profiling with data-independent acquisition and application to acetaminophen-treated three-dimensional liver microtissues. Mol. Cell. Proteomics 14, 1400–1410 - PMC - PubMed
    1. Deleted in proof.

Publication types

LinkOut - more resources