. 2020 Mar 31;12(7):5832-5857.
doi: 10.18632/aging.102979. Epub 2020 Mar 31.

Development of a prognostic index and screening of potential biomarkers based on immunogenomic landscape analysis of colorectal cancer

Affiliations

Development of a prognostic index and screening of potential biomarkers based on immunogenomic landscape analysis of colorectal cancer

Kang Lin et al. Aging (Albany NY). .

Abstract

Background: Colorectal cancer (CRC) accounts for the highest fatality rate among all malignant tumors. Immunotherapy has shown great promise in management of many malignant tumors, necessitating the need to explore its role in CRC.

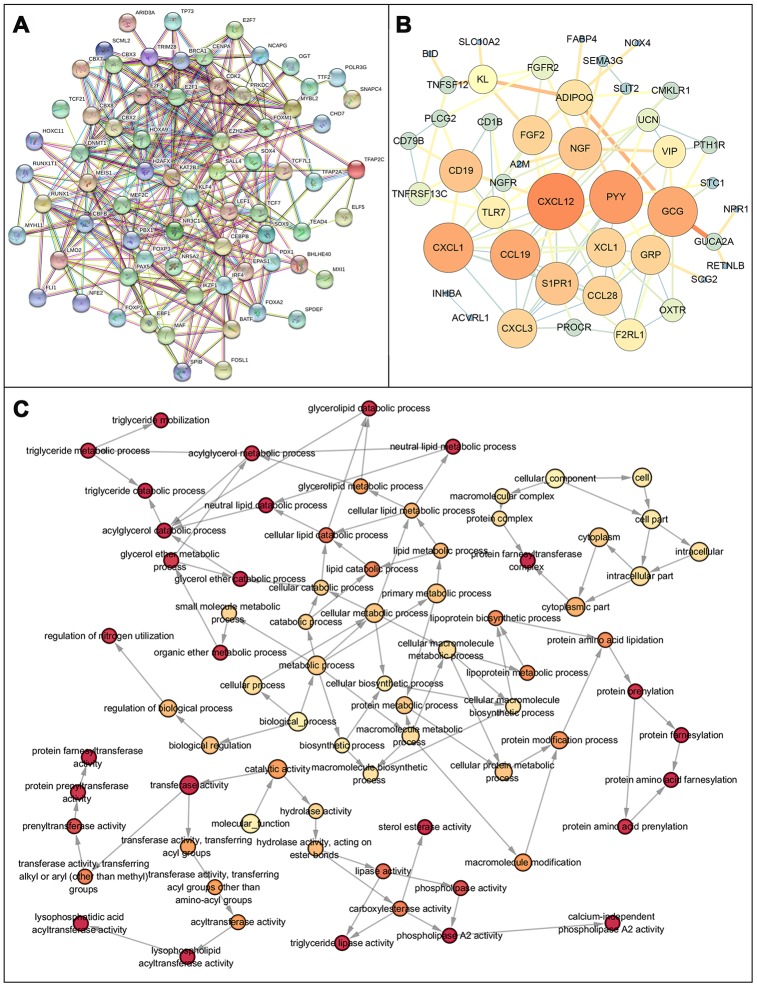
Results: Our analysis revealed a total of 71 differentially expressed IRGs, that were associated with prognosis of CRC patients. Ten IRGs (FABP4, IGKV1-33, IGKV2D-40, IGLV6-57, NGF, RETNLB, UCN, VIP, NGFR, and OXTR) showed high prognostic performance in predicting CRC outcomes, and were further associated with tumor burden, metastasis, tumor TNM stage, gender, age, and pathological stage. Interestingly, the IRG-based prognostic index (IRGPI) reflected infiltration of multiple immune cell types.

Conclusions: This model provides an effective approach for stratification and characterization of patients using IRG-based immunolabeling tools to monitor prognosis of CRC.

Methods: We performed a comprehensive analysis of expression profiles for immune-related genes (IRGs) and overall survival time in 437 CRC patients from the TCGA database. We employed computational algorithms and Cox regression analysis to estimate the relationship between differentially expressed IRGs and survival rates in CRC patients. Furthermore, we investigated the mechanisms of action of the IRGs involved in CRC, and established a novel prognostic index based on multivariate Cox models.

Keywords: colorectal cancer; immunogenomic landscape; personalized medicine; prognostic index; the cancer genome atlas.


Conflict of interest statement

CONFLICTS OF INTEREST: All authors declared that there were no conflicts of interest with the contents of this article.

Figures

Figure 1
Figure 1
(A) Differentially expressed genes, with red representing high expression and green representing low expression. (B) Differentially expressed immune-related genes, with red representing high expression and green representing low expression. (C) Volcano plot of 6524 differentially expressed genes, with red representing up-regulated and green representing down-regulated. (D) Volcano plot of 484 differentially expressed immune-related genes, with red representing up-regulated and green representing down-regulated. (E) Gene ontology analysis of differentially immune-related genes, circle presentations biological process, triangle presentations cellular component, square presentations molecular function. (F) KEGG pathway analysis of differentially immune-related genes.
Figure 2
Figure 2
Forest plot of hazard ratios of prognostically relevant immune genes, revealing prognostic value in CRC.
Figure 3
Figure 3
Protein protein interaction network and GO network of prognosis-related immune genes. (A) Protein-protein interaction network of prognosis-related immune genes, revealing their intrinsic connections. (B) The constructed PPIs in Cytoscape, with the size of the nodes showing the degree of connectivity of the immune genes, reveal the hub genes in the network. (C) Gene ontology network of prognosis-related immune genes. The color shade of the node represents the p-value, darker colors indicate smaller P values. P < 0.05 indicates statistically significant difference.
Figure 4
Figure 4
Mutation landscape of prognosis-related IRGs. PROCR is the gene with the highest mutation frequency. And there were 37 genes with a mutation rate ≥ 5%.
Figure 5
Figure 5
Co-expression network and gene enrichment analysis of prognostically relevant IRGs. (A) Network of prognostic IRGs and their co-expressed genes, with black-boxed nodes indicating prognostic IRGs and the remaining nodes indicating genes co-expressed with prognostic IRGs. (B) Gene ontology analysis and (C) KEGG pathway analysis of prognostic IRGs.
Figure 6
Figure 6
Gene Set Enrichment Analysis. (A) 10 significantly enriched pathways. (B) Cluster heatmap of top 50 high and low expressed genes in all samples. (C) Comparative analysis of the top 10 significantly enriched pathways.
Figure 7
Figure 7
Transcription factor mediated regulatory network. Differentially expressed transcription factors (TFs) (A) hetmap and (B) Volcano plot. (C) Regulatory network constructed based on clinically relevant TFs and IRGs. (D) Most significant modules in regulatory networks.
Figure 8
Figure 8
Establishment of prognostic index based on prognostic related immune genes. (A) Rank of prognostic index and distribution of groups. (B) Survival status of patients in different groups. (C) Heatmap of expression profiles of included genes. (D) Five-year survival was significantly lower in the high-risk group. (E) Survival-dependent receiver operating characteristic (ROC) curve validation of prognostic value of the prognostic index. (F) Univariate regression and (G) multiple regression analysis of colorectal cancer.
Figure 9
Figure 9
Relationship between immune gene expression and clinicopathological factors in CRC (P < 0.05).
Figure 10
Figure 10
Relationships between the immune–related prognostic index and infiltration abundances of six types of immune cells. (A) CD4 T cells; (B) CD8 T cells; (C) dendritic cells; (D) macrophages; (E) neutrophils; and (F) B cells. The correlation was performed by using Pearson correlation analysis. P < 0.05 was considered statistically significant.

References

    1. Inamura K. Colorectal Cancers: An Update on Their Molecular Pathology. Cancers (Basel). 2018; 10:10. 10.3390/cancers10010026 - DOI - PMC - PubMed
    1. Siegel R, Desantis C, Jemal A. Colorectal cancer statistics, 2014. CA Cancer J Clin. 2014; 64:104–17. 10.3322/caac.21220 - DOI - PubMed
    1. Brenner H, Kloor M, Pox CP. Colorectal cancer. Lancet. 2014; 383:1490–502. 10.1016/S0140-6736(13)61649-9 - DOI - PubMed
    1. Basile D, Garattini SK, Bonotto M, Ongaro E, Casagrande M, Cattaneo M, Fanotto V, De Carlo E, Loupakis F, Urbano F, Negri FV, Pella N, Russano M, et al.. Immunotherapy for colorectal cancer: where are we heading? Expert Opin Biol Ther. 2017; 17:709–21. 10.1080/14712598.2017.1315405 - DOI - PubMed
    1. Ganesh K, Stadler ZK, Cercek A, Mendelsohn RB, Shia J, Segal NH, Diaz LA Jr. Immunotherapy in colorectal cancer: rationale, challenges and potential. Nat Rev Gastroenterol Hepatol. 2019; 16:361–75. 10.1038/s41575-019-0126-x - DOI - PMC - PubMed

Publication types

Substances