. 2020 Mar 30;20(7):1911.
doi: 10.3390/s20071911.

Hyperspectral Imaging for the Detection of Glioblastoma Tumor Cells in H&E Slides Using Convolutional Neural Networks

Affiliations

Hyperspectral Imaging for the Detection of Glioblastoma Tumor Cells in H&E Slides Using Convolutional Neural Networks

Samuel Ortega et al. Sensors (Basel). .

Abstract

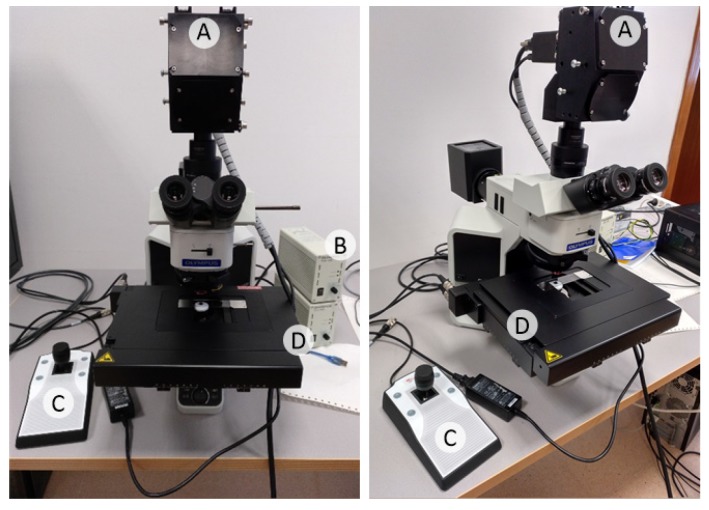
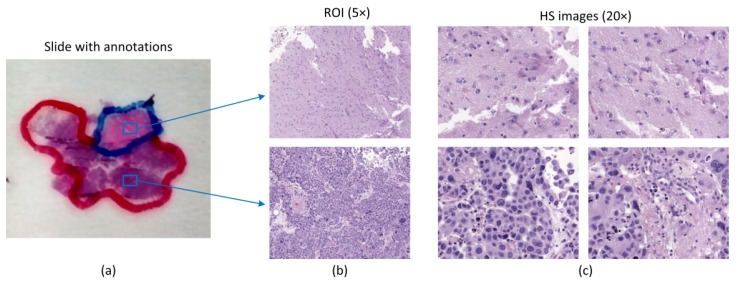
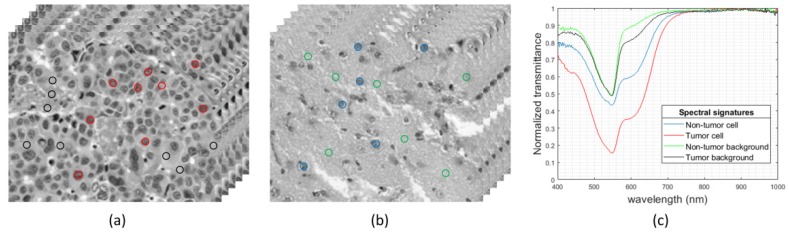
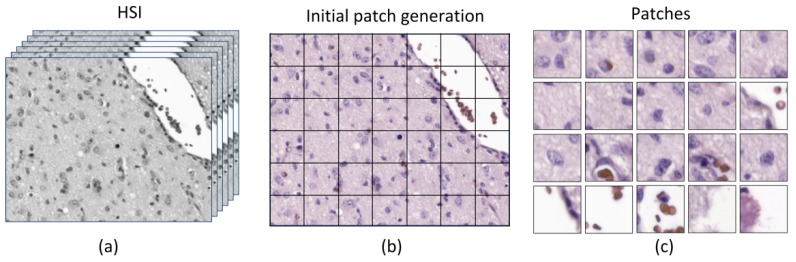
Hyperspectral imaging (HSI) technology has demonstrated potential to provide useful information about the chemical composition of tissue and its morphological features in a single image modality. Deep learning (DL) techniques have demonstrated the ability of automatic feature extraction from data for a successful classification. In this study, we exploit HSI and DL for the automatic differentiation of glioblastoma (GB) and non-tumor tissue on hematoxylin and eosin (H&E) stained histological slides of human brain tissue. GB detection is a challenging application, showing high heterogeneity in the cellular morphology across different patients. We employed an HSI microscope, with a spectral range from 400 to 1000 nm, to collect 517 HS cubes from 13 GB patients using 20× magnification. Using a convolutional neural network (CNN), we were able to automatically detect GB within the pathological slides, achieving average sensitivity and specificity values of 88% and 77%, respectively, representing an improvement of 7% and 8% respectively, as compared to the results obtained using RGB (red, green, and blue) images. This study demonstrates that the combination of hyperspectral microscopic imaging and deep learning is a promising tool for future computational pathologies.

Keywords: convolutional neural networks; glioblastoma; hyperspectral imaging; medical optics and biotechnology; optical pathology; tissue characterization; tissue diagnostics.


Conflict of interest statement

The authors declare no conflict of interest. The founding sponsors had no role in the design of the study; in the collection, analyses, or interpretation of data; in the writing of the manuscript, and in the decision to publish the results.

Figures

Figure 1
Figure 1
Microscopic hyperspectral (HS) acquisition system. (A) HS camera. (B) Halogen light source. (C) Positioning joystick. (D) XY linear stage.
Figure 2
Figure 2
Pathological samples used in this study. (a) Macroscopic annotations performed in pathological slides after diagnosis. Blue squares denote regions of interest (ROIs) within annotations; (b) ROIs from (a) shown at 5×; (c) Examples of HS images used in this study for classification (imaged at 20×).
Figure 3
Figure 3
HS histopathological dataset. (a,b) HS cubes from tumor and non-tumor samples, respectively. (c) Spectral signatures of different parts of the tissue: tumor cells (red), non-tumor cells (blue), tumor background tissue (black), and non-tumor background tissue (green).
Figure 4
Figure 4
Generation of patches. (a) Original HS image; (b) grid of patches within the HS image; (c) patches of size 87 × 87 used in the classification. The last row contained patches that were rejected for the dataset for having more than 50% of empty pixels. HSI: hyperspectral imaging.
Figure 5
Figure 5
Example of image defects detected in the test dataset. (a) Ink contamination; (b) unfocused images; (c) artifacts in the specimens; (d) samples mainly composed of red blood cells.
Figure 6
Figure 6
Evaluation assessment for the samples of Patient P6. Red pen markers indicate the initial evaluation of tumor regions. Regions without pen contour were considered as non-tumor. Red squares indicate the ROIs of tumor samples. Blue squares indicate the ROIs of non-tumor samples. (a) Initial evaluation of the sample; (b) second evaluation of the sample, where a yellow marker is used for the updated tumor areas; (c) example of HSI from tumor ROI; (d) example of HSI from non-tumor ROI.
Figure 7
Figure 7
Heat maps from good performance patients. (a) Non-tumor tissue with no false positive; (b) non-tumor tissue with some false positives; (c) tumor tissue with no false negative; (d) tumor tissue with some false negatives.
Figure 8
Figure 8
Heat maps from bad performing patients. (a,b) Non-tumor and tumor maps from Patient P4; (c,d) non-tumor and tumor maps from Patient P6.

References

    1. Van Es S.L. Digital pathology: Semper ad meliora. Pathology. 2019;51:1–10. doi: 10.1016/j.pathol.2018.10.011. - DOI - PubMed
    1. Flotte T.J., Bell D.A. Anatomical pathology is at a crossroads. Pathology. 2018;50:373–374. doi: 10.1016/j.pathol.2018.01.003. - DOI - PubMed
    1. Madabhushi A., Lee G. Image analysis and machine learning in digital pathology: Challenges and opportunities. Med. Image Anal. 2016;33:170–175. doi: 10.1016/j.media.2016.06.037. - DOI - PMC - PubMed
    1. Song Y., Zhang L., Chen S., Ni D., Lei B., Wang T. Accurate Segmentation of Cervical Cytoplasm and Nuclei Based on Multiscale Convolutional Network and Graph Partitioning. IEEE Trans. Biomed. Eng. 2015;62:2421–2433. doi: 10.1109/TBME.2015.2430895. - DOI - PubMed
    1. Rezaeilouyeh H., Mollahosseini A., Mahoor M.H. Microscopic medical image classification framework via deep learning and shearlet transform. J. Med. Imaging. 2016;3:044501. doi: 10.1117/1.JMI.3.4.044501. - DOI - PMC - PubMed

LinkOut - more resources