Review
. 2020 Jul;21(7):410-427.
doi: 10.1038/s41576-020-0223-2. Epub 2020 Mar 31.

Lineage tracing meets single-cell omics: opportunities and challenges

Affiliations
Review

Lineage tracing meets single-cell omics: opportunities and challenges

Daniel E Wagner et al. Nat Rev Genet. 2020 Jul.

Abstract

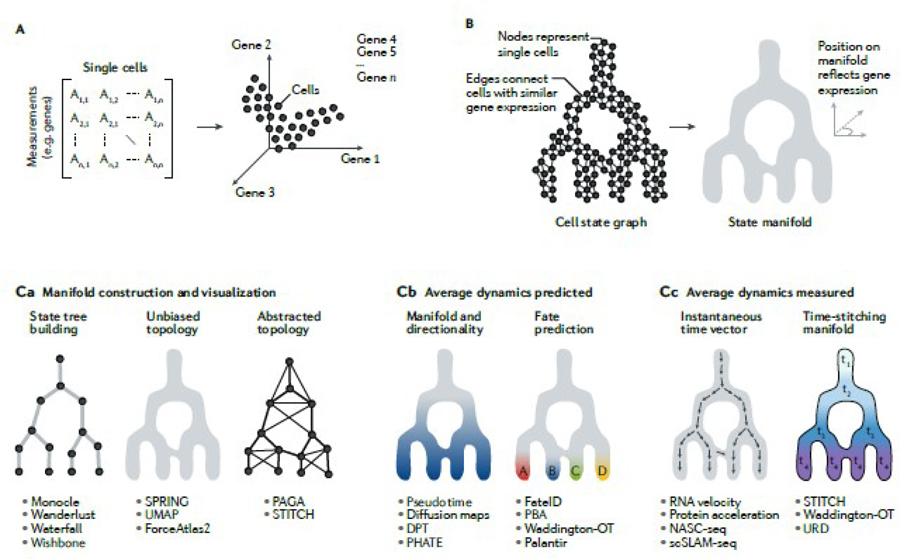
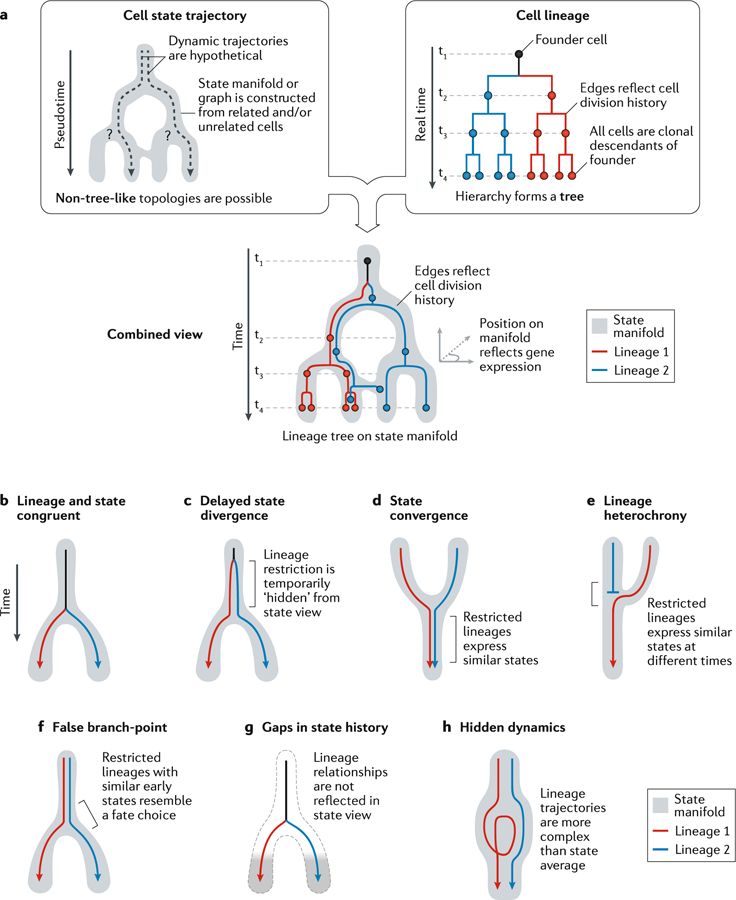
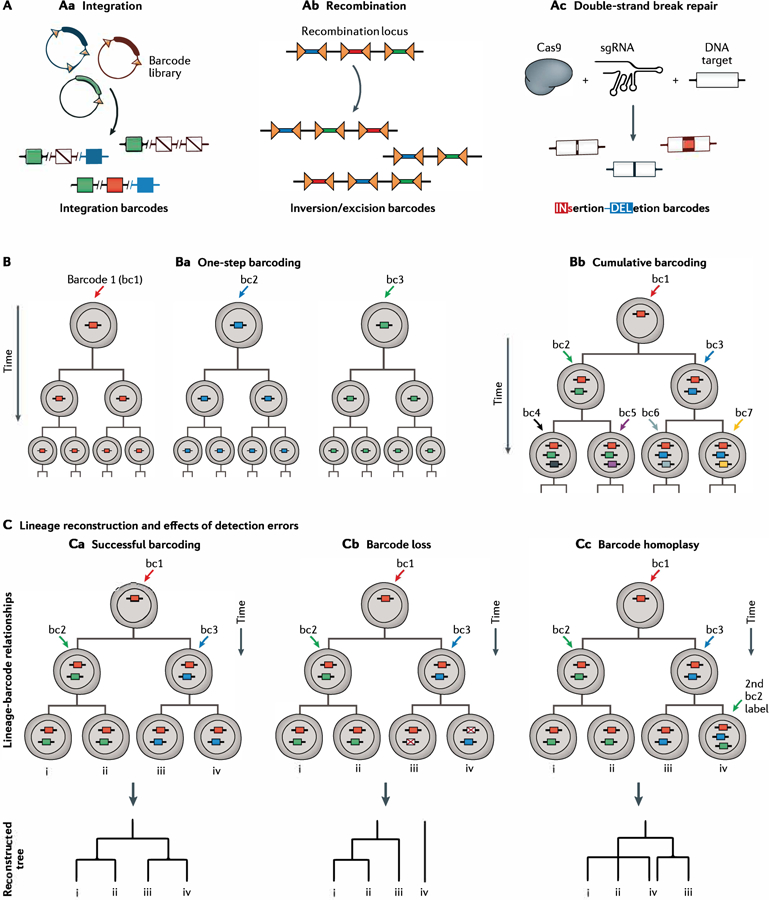
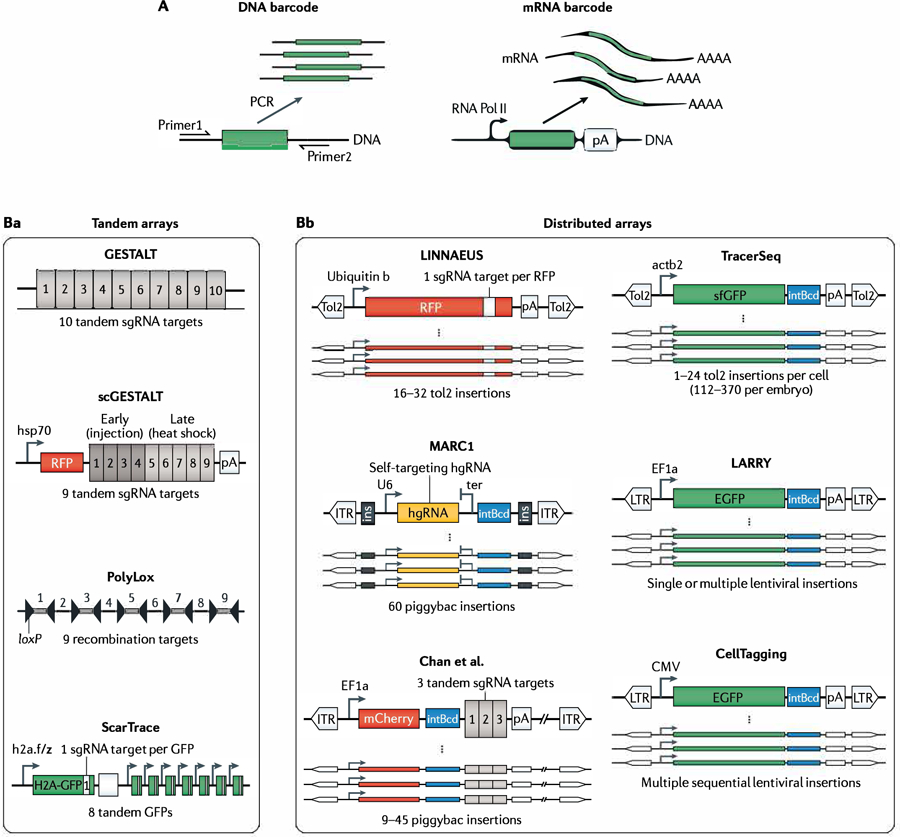
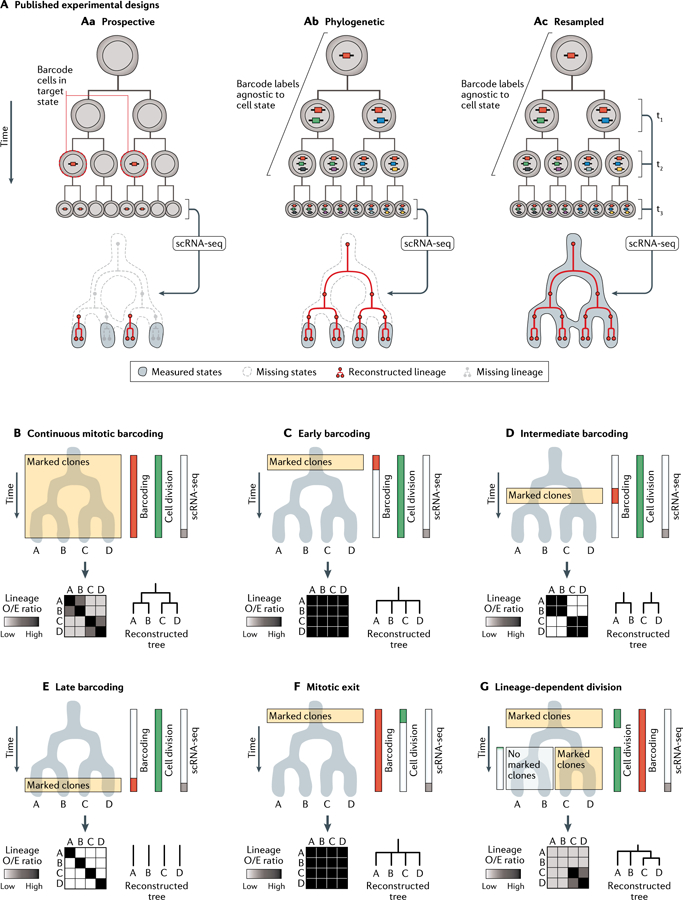
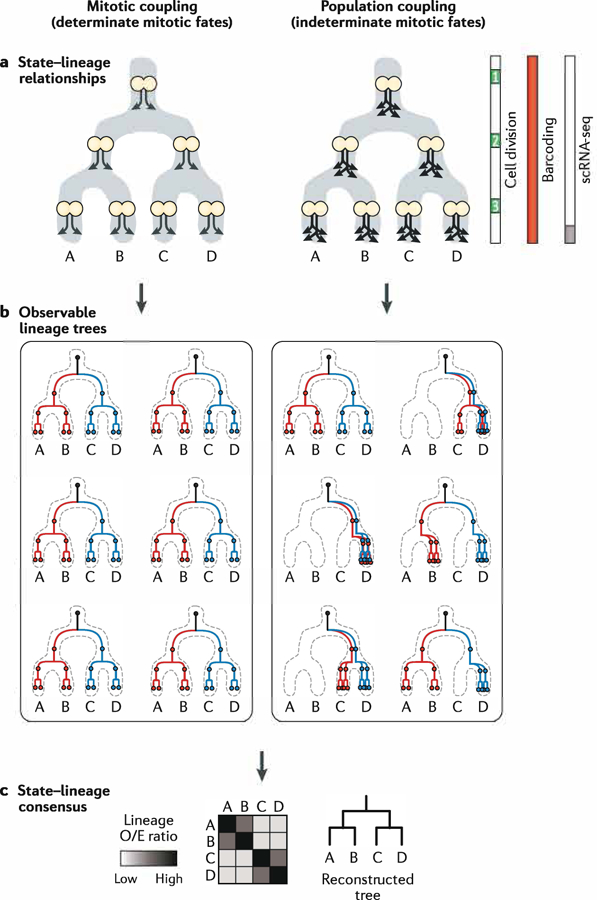
A fundamental goal of developmental and stem cell biology is to map the developmental history (ontogeny) of differentiated cell types. Recent advances in high-throughput single-cell sequencing technologies have enabled the construction of comprehensive transcriptional atlases of adult tissues and of developing embryos from measurements of up to millions of individual cells. Parallel advances in sequencing-based lineage-tracing methods now facilitate the mapping of clonal relationships onto these landscapes and enable detailed comparisons between molecular and mitotic histories. Here we review recent progress and challenges, as well as the opportunities that emerge when these two complementary representations of cellular history are synthesized into integrated models of cell differentiation.


Conflict of interest statement

Competing interests

A.M.K. is a founder of 1CellBio, Inc. D.E.W. declares no competing interests.

Figures

Fig. 1|
Fig. 1|. inferring cell histories from state manifoids.
A| Modern omics-based single-cell datasets, conceptuailzed as a measurement xcell count matrix or, alternatively, as cells plotted in a high-dimensional Euciidean space. B | Single-cell graphs, which link cells according to similarity (for example, Euclidean distance) in gene expression space, can be visualized to reveal underlying state manifolds that reflect gene expression dynamics. C| Graph-based tools for constructing and visualizing statement folds (part Ca), computational algorithms for predicting dynamics directly from a state manifold (part Cb) and tools for incorporating independently measured state dynamics into a manifold (part Cc) DPT, diffusion pseudotime: NASC seq, newt ranscriptome aikylation-dependent single-cell RNA sequencing: PAGA, partition-based graph abstraction: PBA. population balance analysis; PHATE, potential of heat diffusion for affinity-based trajectory embedding: scSLAM-seq, single-cell thiol-(SH)}-linked alkylation of RNA for metabolic labelling sequencing; SPRING. a force-layout embedding of single-cell data; STITCH, a method for combining time series of single-cell data; UMAP, uniform manifold state manifolds approximation and projection; URD. a simulated diffusion based computational approach named after the Norse mythological figure: Waddington-OT, Waddington optimal transport.
Fig. 2 |
Fig. 2 |. Limitations of cell state manifolds.
a | Clarification of depictions of cell state manifolds versus cell lineage trees. Trajectory relationships are indirectly inferred from gene expression similarities, whereas lineage relationships reflect measured mitotic histories. Below the boxes, a combined representation highlights a clonal hierarchy of related cells, directly revealing its trajectory along astate manifold. b-h| Hypothetical scenarios of restricted lineage trajectories unfolding ona state manifold. The behaviours of distinct clonal units are presented in simplified form by coloured arrows. Lineage and state congruent (part b): initially all clones share the same fate potential (black); restriction of the clones into distinct trajectories (blue/red) occurs only where the manifold bifurcates. Delayed state divergence (part c): cells become committed to distinct trajectories (blue/red) but continue to occupy similar states for some time. This causes the early state to appear seemingly multipotent despite the cells within each clone being fate-restricted. State convergence (part d): cells with distinct molecular histories converge into similar states, such that the molecular origin of later cells can no longer be inferred. Lineage heterochrony (part e): cells with different origins occupy a sequence of states that implies a false developmental trajectory (blue to red). False branch-point (part f): an extreme case of the situation in part c, in which an apparent branch-point does not represent a decision made by any cell. Instead, it appears artificially when fate-restricted clones overlap in their early state. Gaps in state manifold (part g): disconnected cell states appear when the states of transitional and early progenitors are not represented in the dataset. This occurs when transitional states are very rare or when sampling a developing tissue at a late stage. Hidden dynamics (part h): the extent of stochastic or structured fluctuations in clonal dynamics is not visible from snapshots of cell states.
Fig. 3 |
Fig. 3 |. Methods and logic for lineage barcoding experiments.
A | Three major paradigms for introducing unique DNA barcodes into cells: by integration of a high-diversity library of DNA barcodes using a transposase (part Aa), by randomrecombination of an array of recombinase target sites (part Ab) and by the accumulation ofrandom errors insertions and dele tions during CRISPR-Cas9 editing of genomic target sites (Part Ac).B | DNA barcoding can be applied in asingle, ins.antaneous pulse, enabling the paraflel tracking of many distinct cell clones (part Ba). When applied cont inuoudy. DNA barcades can repeatedly label a dividing cell clone at sequential levels ofits lineage hierarchy (part Bb) C | Challenges in lineage reconstruction from cumulative barcoding. The upper diagrams depict hypothetical barcode integration events ina cell ineage. Arrows denote the accumulation of novel barcodes, with each colour indicating aunique DNA barcode sequence. Hypothetical lineage correlation heat mapsand trees depict the anticipated results of lineage reconstruction. Lineage phylogenies can be accurately reconstructed from dngle-cell correlations of the detected barcode labels (part Ca), whereby earty versus late clones aredistinguished on the basis of the number of cells that contain theassodated barcode. Errarsin barcoding or barcode det ection can skew the accuracy of phylogenetic inferences (parts Cb and Cc). sgRNA, single-quide RNA.
Fig. 4 |
Fig. 4 |. Reading and writing transgenic DNA barcodes.
A | DNA barcodes can be encoded exclusively in genomic DNA (left) or expressed as mRNA, to allow detection concurrent with single-cell RNA sequencing. Reliable detection of barcode sequences requires amplification. For DNA barcodes this is achieved by P CR or in vitro transcription, whereas mRNA-based barcodes are endogenously amplified via RNA polymerase II (Pol II) transcription and can be detected as part of each single-cell transcriptome. B | Transgenic strategies for storing and transcribing DNA barcodes. The schematics show the diversity of DNA arrays used to store lineage information for each method. The arrays can be grouped according to whether they store lineage information at a single genomic locus using a tandem array (part Ba) or whether they store lineage information at multiple genomic loci using distributed arrays (part Bb). Right-angled black arrows indicate promoters used to drive barcode expression for detection by RNA sequencing in a subset of methods. The methods differ in whether they utilize recombination (PolyLox), barcode library integration using a lentivirus or transposase (TracerSeq, LARRY. CellTagging) or CRISP R-Cas9 targeting of single guide RNA (sgRNA) arrays (all remaining methods). GESTALT, genome editing of synthetic target arrays for lineage tracing; hgRNA, homing guide RNA; LARRY. lineage and RNA recovery; LINNAEUS, lineage tracing by nuclease-activated editing of ubiquitous sequences; MARCl, mouse for actively recording cells 1; scGESTALT, single-cell GESTALT.
Fig. 5 |
Fig. 5 |. Applications and pitfalls of lineage tracing on state manifolds.
A | Recent studies have highlighted three experimental designs for combining lineage and state measurements. For simplicity, the panels depict largely congruent state-lineage hierarchies. Prospective (part Aa): a bulk genetic label is applied to cells of a particular state; labelled cells are subsequently captured and sequenced to reveal the gene expression states and lineage barcodes for each cell. Phylogenetic (part Ab): gene expression states and lineage barcodes are measured at a defined end point with respect to a biological process. Prior lineage relationships can be reconstructed retrospectively from the lineage barcodes, whereas state information is limited to the final time point. Resampled (part Ac): gene expression states and lineage barcodes are repeatedly sub-sampled over time, enabling the mapping of lineage trends directly on the state manifold. B-G | Phylogenetic reconstruction of fate hierarchies from end-point state and lineage measurements. The results of hypothetical lineage-state reconstruction analyses are displayed for each scenario; they vary dramatically, depending on the timing of both cell division and lineage barcoding. Heat maps depict the number of shared barcodes observed between each pair of states, normalized by the expected number of barcodes under a null hypothesis in which barcodes are distributed at random (‘Lineage 0/E ratio’). For a thorough definition of this statistic, see Weinreb et al. (2020). Lineage relationships can only be inferred at the time points when marked clones are generated and expanded. Given constant cell division rates and identical state manifolds, different time windows of barcode induction will lead to different inferences about lineage relationships. B | Continuous lineage barcoding in an actively dividing cell population enables all major lineage restriction events to be well-represented in a lineage-state reconstruction analysis. C-E | Lineage relationships can only be inferred at time points when marked clones are generated and expanded. Given constant cell division rates and identical state manifolds, different time windows of barcode induction will lead to distinct inferences about lineage-state relationships. F | In postmitotic differentiation hierarchies, despite continuous DNA barcoding, an absence of cell division precludes the formation of marked clones containing> 1 cell. Barcodes are no longer enriched across the state manifold and cannot be used to reconstruct fate restriction hierarchies. G | Lineage inferences require well-sampled barcode data from marked clones. Variable rates of cell division on a state manifold skew clone sizes and, hence, the statistical power to detect lineage-barcode correlations. scRNA-seq, single-cell RNA sequencing.
Fig. 6 |
Fig. 6 |. Developmental paradigms that shape state-lineage relationships.
a | State manifold diagrams depicting the timing and fates of mitotic daughter cells. In cases of mitotic coupling (left), cells divide asymmetrically and give rise to distinct daughter states. In cases of population coupling (right), the average flux of cells down branches of the state manifold is maintained, but the fates of individual daughter cells are largely unpredictable. b | Examples of observable lineage trees that result from mitotic or population coupling. Mitotic coupling (left) leads to invariant, determinant lineage trees. Population coupling (right) permits a large number of observable lineage tree possibilities (six shown). c | Consensus relationships derived from a large number of individual tree observations. Despite the varied possibilities for the individual lineage trees in part b, the lineage relationships between states will be similar for both mitotic- and population-coupling scenarios. The heat map plots lineage observed/expected (0/E) ratios (see the FIG. 5 legend and Weinreb et al. (2020) for the definition). scRNA-seq, single-cell RNA sequencing.

References

    1. Whitman CO Memoirs: the embryology of clepsine. J. Cell Sci s2-18, 215–315 (1878).
    1. Waddington CH The strategy of the genes A discussion of some aspects of theoretical biology. (George Allen & Unwin, Ltd., London, 1957).
    1. Saelens W, Cannoodt R, Todorov H & Saeys Y A comparison of single-cell trajectory inference methods. Nat. Biotechnol 37, 547–554 (2019). - PubMed
    1. Tritschler S et al. Concepts and limitations for learning developmental trajectories from single cell genomics. Development 146, dev170506 (2019). - PubMed
    1. McKenna A & Gagnon JA Recording development with single cell dynamic lineage tracing. Development 146, dev169730 (2019). - PMC - PubMed

Publication types