. 2020 Apr 1;15(4):e0229662.
doi: 10.1371/journal.pone.0229662. eCollection 2020.

Long-term patterns of gender imbalance in an industry without ability or level of interest differences

Affiliations

Long-term patterns of gender imbalance in an industry without ability or level of interest differences

Luís A Nunes Amaral et al. PLoS One. .

Abstract

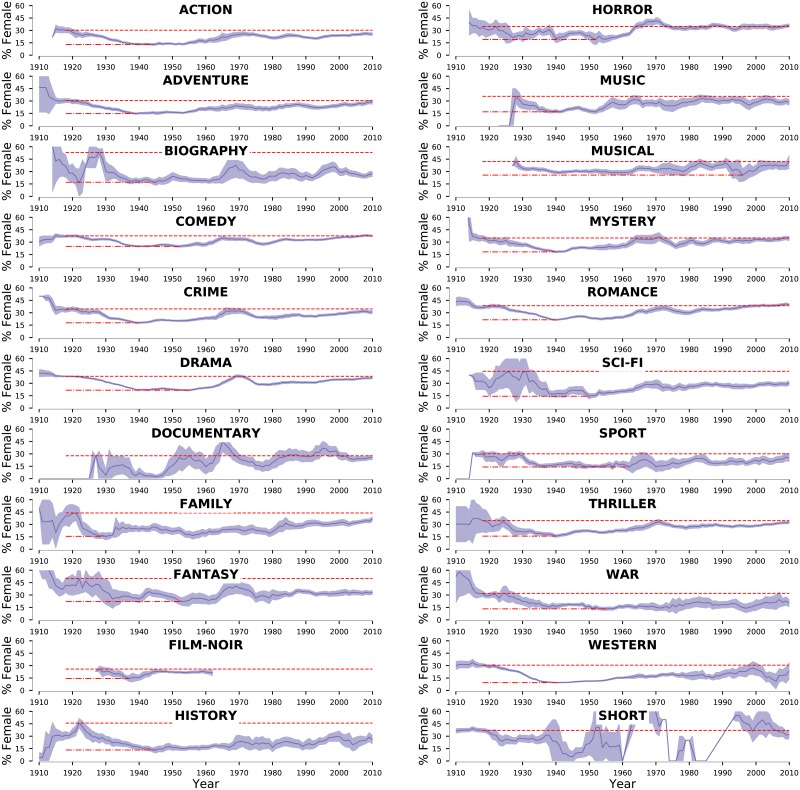
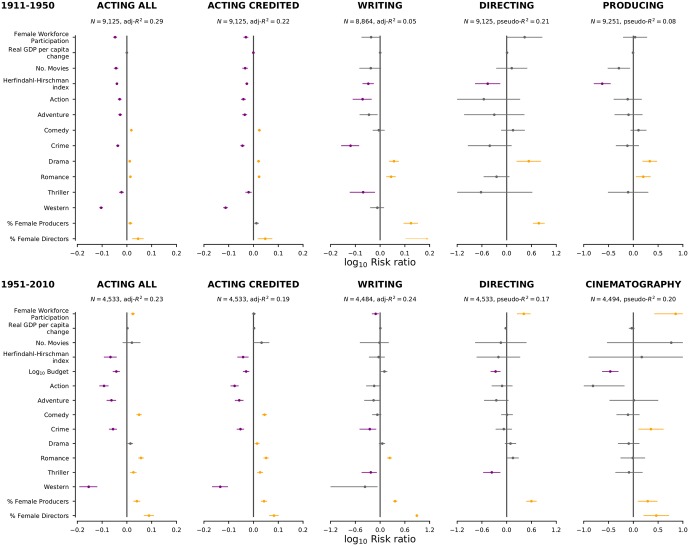
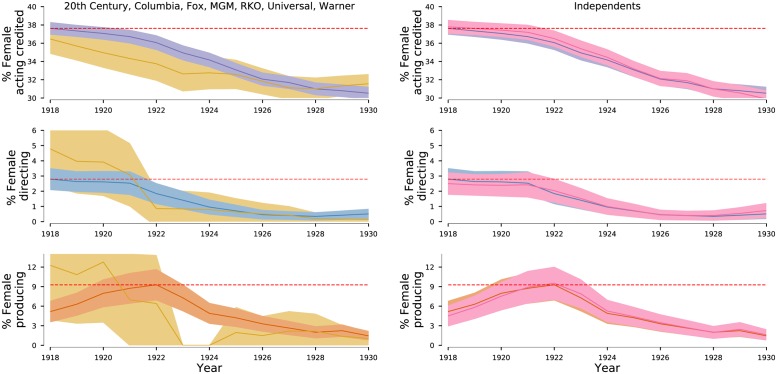
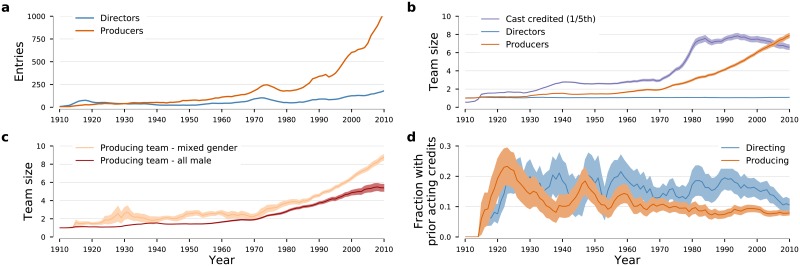
Female representation has been slowly but steadily increasing in many sectors of society. One sector where one would expect to see gender parity is the movie industry, yet the representation of females in most functions within the U.S. movie industry remain surprisingly low. Here, we study the historical patterns of female representation among actors, directors, and producers in an attempt to gain insights into the possible causes of the lack of gender parity in the industry. Our analyses reveals a remarkable temporal coincidence between the collapse in female representation across all functions and the advent of the Studio System, a period when the major Hollywood studios controlled all aspects of the industry. Female representation among actors, directors, producers and writers dropped to extraordinarily low values during the emergence and consolidation of the Studio System that in some cases have not yet recovered to pre-Studio System levels. In order to explore some possible mechanisms behind these patterns, we investigate the association between the gender balance of actors, writers, directors, and producers and a number of economic indicators, movie industry indicators, and movie characteristics. We find robust, strong, and significant associations which are consistent with an important role for the gender of decision makers on the gender balance of other industry functions. While in no way demonstrating causality, our findings add new perspectives to the discussions of the reasons for female under-representation in fields such as computer science and medicine, that have also experienced dramatic changes in female representation.


Conflict of interest statement

The authors have declared that no competing interests exist.

Figures

Fig 1
Fig 1. Historical trends of gender imbalance in the U.S. movie industry.
(a) Timeline of 20th century events relevant to the evolution of the U.S. movie industry. Red bars identify major wars with U.S. involvement (chronologically, World War I, World War II, Korean war, and Vietnam war). Light peach bars show the peak of the feminism waves in the U.S. Orange shadings indicate the rates of TV adoption in U.S. households (from unsaturated to saturated: <30%, <60%, <90%). [47] Light blue shadings identify, from less to more saturated, MPPC control, [48] consolidation of the Hollywood Studio System, and Studio System’s heyday. [20] The de Havilland vs. Warner Bros’ 1944 decision freed major stars from life long contracts with as single studio. The U.S. vs. Paramount’s 1948 decision unravelled the vertical integration of the U.S. movie industry. These legal defeats enabled greater negotiating power for movie stars and the ability of independent producing companies to have their movies distributed in a more equitable manner. (b) Number of U.S.-produced movies considered in our study released annually. See S1 Fig for breakdown by movie genre. (c) Concentration of the industry’s output by producing company/studio as measured by the Herfindhal-Hirschman index. Larger values indicate that a large fraction of movies are produced by a small number of studios. We observe an increase of the degree of concentration during the period of control of the industry by MPPC. The degree of concentration reaches a minimum in 1922 but then it grows until 1944. These trends are consistent with current understanding of the consolidation and golden age of the Hollywood Studio System. [20, 48] (d) Temporal dependence of the percentage of females according to movie-making function. The olive solid line in the top panel shows female participation in the U.S workforce in order to provide a comparison to the overall economy. Solid lines indicate average values and the color bands show 95% confidence intervals. The red dotted lines show the highest value of female representation attained prior to 1940, and the red dashed lines show the lowest value attained after 1930, if different from zero. For all movie-making functions there is a similar “U-shape” pattern with an early maximum achieved prior to 1922, a minimum reached by the mid-1940s, and an increase after.
Fig 2
Fig 2. Historical trends of gender imbalance in the casts of U.S.-produced movies.
Temporal dependence of the percentage of females actors according to movie genre. Solid lines indicate average values and the color bands show 95% confidence intervals. The red dotted lines highlight the highest value of female representation attained prior to 1940, whereas the red dashed lines highlight the lowest value attained after 1930. For all genres with sufficient number of movies, we find a clear “U-shape” pattern.
Fig 3
Fig 3. Multivariate logistic (for director, cinematographer, and producers) and OLS (for actors and writers) regressions models of female representation reveal associations with percentage female producers and genre.
We do not include time dummies in the models for which we show regression results here (see S2–S5 Figs for other time periods and for models including time dummies). We plot the base 10 logarithm of the risk ratio for each factor. The risk factor for female workforce participation was calculated for an increase of 10%. The risk factor for change in real GPD per capita was calculated for an increase of 1%. The risk factor for number of movies was calculated for an increase of 300. The risk factor for industry concentration was calculate for a change of 0.03. The risk factor for budget was calculated for an increase by 100 fold. The risk ratio for percentage female producers was calculated for an increase of 50%. This value is one of the four typical values observed, the other three being 0%, 25% and 100%. The risk factor for percentage female directors was calculated for an increase of 100% since typically there is a single director. Risk ratios for which we are not able to reject the null hypothesis at the 0.01 level are shown in grey. Risk ratios significantly larger than 1 are shown in yellow and those significantly smaller than 1 are shown in purple.
Fig 4
Fig 4. Gender balance for four movie-making functions produced by the “Big Seven”—we drop disney from the “Big Eight” because during this period they focused on animation movies—and by the so-called Independents.
We compare female representation for all movies and for movies produced by each group of studios. Values for all movies use the same colors as in Fig 1. Values for movies produced by the “Big Seven” are shown in light yellow, and produced by the Independents in pink. Strikingly, during the first half of the 1920s, the “Big Seven” released movies with lower representation levels of females in both acting and producing.
Fig 5
Fig 5. Entry of new producers and directors into the U.S. movie industry.
(a) Number of new producers and new directors entering the industry annually. Except for the 1910s, the number of new producers has systematically exceeded the number of new director entering the industry. (b) Temporal evolution of producing team size, directing team size, and cast size. U.S.-produced movies have maintained the tradition of having a single director. In contrast, producing teams have grown steadily in size, from a mean size of one until the mid-1940s to a mean of eight. Interestingly, cast size has grown in a more discontinuous manner, with three step changes occurring around 1915, 1935, and 1975. (c) Time dependence of the average size of the team of producers for all male and mixed-gender teams. Color bands show 95% confidence intervals. It is visually apparent, that teams that include females are typically larger and have grown faster. (d) Fraction of new producers (directors) who had at least 4 years of prior acting experience at the time of their first producer (director) credit. For directors, that fraction remained approximately constant during the entire period. In contrast, for producers, there are three well-defined peaks centered at 1922, 1948, and 1959. The presence and location of these peaks does not differ if we change the requirement on the duration of the prior acting experience to 6 or 8 years, or if we require a minimum of 5 or 10 prior acting credits.

References

    1. Woolley AW, Chabris CF, Pentland A, Hashmi N, and Malone TW. Evidence for a collective intelligence factor in the performance of human groups. Science, 330(6004):686–688, 2010. 10.1126/science.1193147 - DOI - PubMed
    1. Bar C and McQueen G. Why women make better directors. Int. J. Bus. Gov. Ethics, 8(1):93–99, 2013. 10.1504/IJBGE.2013.052743 - DOI
    1. Duch J, Zeng XHT, Sales-Pardo M, Radicchi F, Otis S, Woodruff TK, et al. The possible role of resource requirements and academic career-choice risk on gender differences in publication rate and impact. PLoS One, 7(12):e51332, 2012. 10.1371/journal.pone.0051332 - DOI - PMC - PubMed
    1. Zaichkowsky JL. Women in the board room: One can make a difference. Int. J. Bus. Gov. Ethics, 9(1):91–113, 2014. 10.1504/IJBGE.2014.062774 - DOI
    1. Jalalzai F. Shattered, Cracked, or Firmly Intact? Women and the Executive Glass Ceiling Worldwide. Oxford University Press, 2013.

Publication types