. 2020 Apr 1;143(4):1261-1277.
doi: 10.1093/brain/awaa035.

Impaired theta phase coupling underlies frontotemporal dysconnectivity in schizophrenia

Affiliations

Impaired theta phase coupling underlies frontotemporal dysconnectivity in schizophrenia

Rick A Adams et al. Brain. .

Abstract

Frontotemporal dysconnectivity is a key pathology in schizophrenia. The specific nature of this dysconnectivity is unknown, but animal models imply dysfunctional theta phase coupling between hippocampus and medial prefrontal cortex (mPFC). We tested this hypothesis by examining neural dynamics in 18 participants with a schizophrenia diagnosis, both medicated and unmedicated; and 26 age, sex and IQ matched control subjects. All participants completed two tasks known to elicit hippocampal-prefrontal theta coupling: a spatial memory task (during magnetoencephalography) and a memory integration task. In addition, an overlapping group of 33 schizophrenia and 29 control subjects underwent PET to measure the availability of GABAARs expressing the α5 subunit (concentrated on hippocampal somatostatin interneurons). We demonstrate-in the spatial memory task, during memory recall-that theta power increases in left medial temporal lobe (mTL) are impaired in schizophrenia, as is theta phase coupling between mPFC and mTL. Importantly, the latter cannot be explained by theta power changes, head movement, antipsychotics, cannabis use, or IQ, and is not found in other frequency bands. Moreover, mPFC-mTL theta coupling correlated strongly with performance in controls, but not in subjects with schizophrenia, who were mildly impaired at the spatial memory task and no better than chance on the memory integration task. Finally, mTL regions showing reduced phase coupling in schizophrenia magnetoencephalography participants overlapped substantially with areas of diminished α5-GABAAR availability in the wider schizophrenia PET sample. These results indicate that mPFC-mTL dysconnectivity in schizophrenia is due to a loss of theta phase coupling, and imply α5-GABAARs (and the cells that express them) have a role in this process.

Keywords: hippocampus; prefrontal cortex; schizophrenia; spatial memory; theta.


Figures

Figure 1
Figure 1
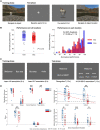
Task structure and behavioural findings. (A) The spatial memory task. In the training phase, participants navigate around the environment using a keypad and must remember the locations of four objects, only one of which is visible in each trial. In the test phase, the subject fixates a grey screen before being shown an image of one object (the cue period). They must then navigate to the remembered location of that object, starting from a random point, and press a button, at which point the object appears in its actual location to provide feedback on their performance. During their navigation to the location, the object is displayed at the top left corner of the screen, to ensure participants don’t forget what they are trying to locate. The next test trial starts when they ‘run over’ the visible object. (B) Left: Individual schizophrenia (Scz) participants’ average performance across all objects was numerically but not significantly worse than controls’ (Con). Right: A histogram showing the (normalized) frequency of average performance centiles for each object location (averaged across three sessions) for subjects with schizophrenia and controls, using translucent bars. Achievement of near ceiling performance is more common in controls than schizophrenia subjects—the proportion of subjects with schizophrenia above the 90th centile of performance was significantly lower than the proportion of controls (χ2 = 7.6, P =0.006): this comparison was also significant at other high performance thresholds (e.g. 80th or 85th centiles). (C) The memory integration task. During the training phase, participants were first asked to passively view successive pairs of stimuli displayed as text on screen and imagine those stimuli interacting as vividly as possible. Unknown to participants, they viewed two overlapping pairs (e.g. A-B, B-C) on non-consecutive trials that were drawn from a series of 12 events comprising a famous person, location and object. In the test phase, participants were first asked if each stimulus (randomly interleaved with an equal number of novel stimuli) had been presented earlier (testing recognition memory), and if it had been, which other stimulus it had been associated with. Importantly, some associations had been directly experienced (e.g. A-B, B-C) and some had to be inferred (e.g. A-C). (D) Performance on the memory integration task. Top left: Hits, misses, correct rejections and false alarms in the recognition memory test. Bottom left: d’ (or sensitivity) and response bias. Top right: Accuracy on direct and indirect associations, with best fit lines across conditions. Bottom right: Accuracy on indirect associations split by the number of direct associations from that event that the subject answered correctly (i.e. if a subject correctly recalled the direct association ‘Madonna-Bus stop’ but not ‘Bus stop-Knife’, their performance on indirect association ‘Madonna-Knife’ would contribute to the ‘1’ bar). The schizophrenia group are impaired (relative to controls) at indirect associations even when both direct associations have been recalled correctly. This indicates their reduction in indirect accuracy does not simply result from schizophrenia subjects remembering fewer direct associations. *P < 0.05; **P < 0.005.
Figure 2
Figure 2
Analysis of sensor-level power in the spatial memory task. (A) Power changes, averaged across all sensors, between the first 1.5 s of the cue and the final 1.5 s of the baseline periods. Differences between groups were apparent at P <0.0125 (Bonferroni correction for four frequency bands) in the theta band (1–8 Hz, indicated with a box). (B) Scalp plot showing differences in the 1–8 Hz theta band between groups during the same period. Highlighted sensors show significant differences at P <0.001 (uncorrected). (C) Left: Time frequency plots showing power changes across the sensors highlighted in (B) during the same period following removal of cue period eye movement variance and the average event-related field across all trials. This illustrates the loss of 1–8 Hz theta power (black square) in schizophrenia (Scz) subjects during the cue period. Right: Average 1–8 Hz theta band power changes during the same period across participants following removal of the event-related field and eye movement regression.
Figure 3
Figure 3
Analysis of source localized power in the spatial memory task. All results are overlaid on a canonical Montreal Neurological Institute T1 image. (A) Source localized 1–8 Hz theta power increases during the first 1.5 s of the cue period, compared to an immediately preceding 1.5 s baseline period, for controls and schizophrenia subjects (after regression of eye movement variance). Both groups exhibit significant increases centred on mPFC [controls: peak (14 54  −4), Z =7.18, PFWE < 0.001; schizophrenia subjects: peak (22 58 12), Z =4.73, PFWE = 0.003]. The crosshairs in each plot are at (8 52 8), the group peak and seed chosen for subsequent phase coupling analysis. Images are thresholded at PFWE < 0.05. (B) The dilated bilateral hippocampal-parahippocampal gyrus (HC + PHG) mask (Maldjian et al., 2003) used for all mTL small volume correction analyses. (C) Source localized 1–8 Hz theta power increases during the cue period within the HC + PHG mask. Controls showed a large increase in anterior mTL theta power bilaterally (following eye movement regression), particularly on the left [left peak at (−12 0  −12), Z =5.15, PFWE(SVC) < 0.001, right peak (20 18  −34), Z =5.42, PFWE(SVC) < 0.001]. Image is thresholded at PFWE < 0.05. Subjects with schizophrenia showed a much smaller increase on the right side (not shown); and control subjects showed a significantly greater increase than schizophrenia subjects on the left [peak (−14 8 −18), Z =3.21, PFWE(SVC) = 0.019]. The image is thresholded at Punc < 0.005 for display purposes. (D) Relationship between frontal lobe cue-related 1–8 Hz power increase and performance on the more demanding (backward) condition of the Digit Span across participants.
Figure 4
Figure 4
MPFC theta phase coupling analysis. All images are thresholded at Punc < 0.005 for display purposes unless otherwise stated. (A) Controls showed significant increases in 1–8 Hz theta phase coupling (analysed using the PLV) during the cue period in two regions—one in posterior hippocampus [peak (−36  −42  −2), Z =3.51, PFWE(SVC) = 0.018] and one in anterior mTL [peak (−26 10  −24), Z =4.07, PFWE(SVC) = 0.003]. Subjects with schizophrenia did not show a significant theta increase in either mTL region. (B) Controls showed greater 1–8 Hz theta PLV than schizophrenia subjects in left anterior mTL, after correcting for trial-by-trial variance in both theta power and head movement and use of antipsychotic medication [peak (−26 10  −22), Z =3.37, PFWE(SVC) = 0.024]. (C) Eigenvariates (similar to the average) of cue-related PLV increases in the significant region shown in (B) (after theta power regression). The schizophrenia group are divided according to antipsychotic medication use. It is clear that antipsychotics cannot be causing the schizophrenia group’s reduction in PLV as only the schizophrenia group OFF medication show a significant difference in PLV from control subjects (Hedges' g =1.3, 95% CI 0.4–2.2). The comparison between schizophrenia subjects ON and OFF medication was underpowered and not significant (Hedges' g =0.8, 95% CI −0.2–1.8). (D) Cue-related theta PLV increase in controls correlated positively with performance in right anterior mTL [peak (32 4  −24), Z =3.1, PFWE(SVC) = 0.057, Punc = 0.001]. Note: The colour bar scale corresponds to t-statistics in the SPM: here, of beta coefficients resulting from a linear regression of trial-wise performance on PLV on in each voxel.
Figure 5
Figure 5
Exploratory whole-brain analyses revealed theta power and phase coupling effects in a mid-cingulate region in schizophrenia subjects. (A) In a whole-brain analysis, schizophrenia subjects’ (Scz) performance correlated with 1–8 Hz theta power in cingulate cortex only [peak (−6 22 24), Z =2.90, Punc = 0.002]. The image is thresholded at Punc = 0.005 for display purposes. (B) A whole-brain PLV analysis of the schizophrenia group found the most significant increase in a mid-cingulate area [peak (8  −12 30), Z =3.87, Punc < 0.001], close to the cingulate area showing a theta power correlation to performance in subjects with schizophrenia. (C) In schizophrenia subjects, PLV increase and performance also correlated in mid-cingulate cortex [peak (6 2 38), Z =2.82, Punc = 0.002]; the PLV-performance relationship here was stronger in schizophrenia subjects than in controls [peak (2 4 36), Z =2.81, Punc = 0.002]. Subjects with schizophrenia may thus be using this node of the frontoparietal control network to compensate for their hippocampal-mPFC circuit dysfunction in this task.
Figure 6
Figure 6
PET analysis. (A) A reanalysis of PET data presented by Marques et al. (2020), who found reduced α5-GABAAR availability in hippocampus in subjects with schizophrenia (Scz). We performed a voxel-wise analysis of these data to look for any overlap between areas of α5-GABAAR reduction and cue-related PLV decrease. At reduced threshold [Punc < 0.05], the schizophrenia group had four areas of reduced α5-GABAAR availability >100 voxels in size: two in right anterior mTL [peak (32  −12  −20), Z =3.30, Punc < 0.001; peak (28 18 −34), Z =2.75, Punc = 0.003], one in left anterior mTL [peak (−20 4 −26), Z =2.40, Punc = 0.008] and one in posterior hippocampus [peak (−20  −34  −12), Z =2.15, Punc = 0.016]. The third (anterior mTL) area overlapped with the areas of reduced theta power (Fig. 3C, right) and PLV (Fig. 4B) in schizophrenia subjects: the crosshairs are placed at the peak contrast voxel from Fig. 4B. (B) The probabilities of the overlaps between the Ro-15 PET controls > schizophrenia contrast in (A) and the theta power and PLV controls > schizophrenia contrasts in Figs 3C and 4B were assessed using permutation testing (10 000 permutations). This histogram plots the number of overlapping voxels expected by chance: the theta PLV effect overlap is unlikely to be due to chance (P =0.013).

References

    1. Abbas AI, Sundiang MJM, Henoch B, Morton MP, Bolkan SS, Park AJ, et al.Somatostatin interneurons facilitate hippocampal-prefrontal synchrony and prefrontal spatial encoding. Neuron 2018; 100: 926–39.e3. - PMC - PubMed
    1. Anderson KL, Rajagovindan R, Ghacibeh GA, Meador KJ, Ding M.. Theta oscillations mediate interaction between prefrontal cortex and medial temporal lobe in human memory. Cereb Cortex 2010; 20: 1604–12. - PubMed
    1. Andreou C, Leicht G, Nolte G, Polomac N, Moritz S, Karow A, et al.Resting-state theta-band connectivity and verbal memory in schizophrenia and in the high-risk state. Schizophr Res 2015; 161: 299–307. - PubMed
    1. Armstrong K, Avery S, Blackford JU, Woodward N, Heckers S.. Impaired associative inference in the early stage of psychosis. Schizophr Res 2018; 202: 86–90. - PMC - PubMed
    1. Armstrong K, Kose S, Williams L, Woolard A, Heckers S.. Impaired associative inference in patients with schizophrenia. Schizophr Bull 2012a; 38: 622–9. - PMC - PubMed

Publication types

Substances