. 2020 Jun;45(6):1697-1710.
doi: 10.3892/ijmm.2020.4550. Epub 2020 Mar 24.

EMT related circular RNA expression profiles identify circSCYL2 as a novel molecule in breast tumor metastasis

Affiliations

EMT related circular RNA expression profiles identify circSCYL2 as a novel molecule in breast tumor metastasis

Chunlei Yuan et al. Int J Mol Med. 2020 Jun.

Abstract

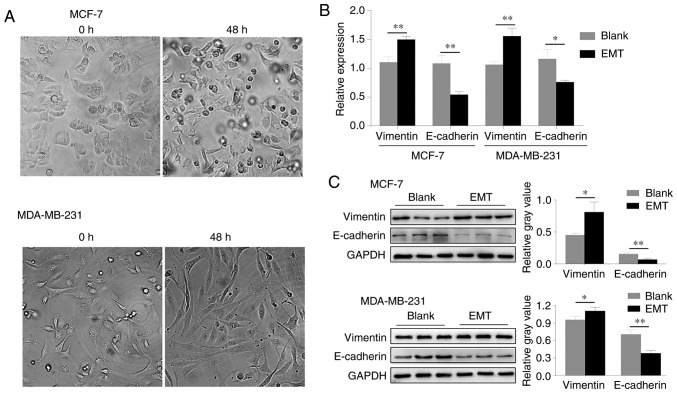
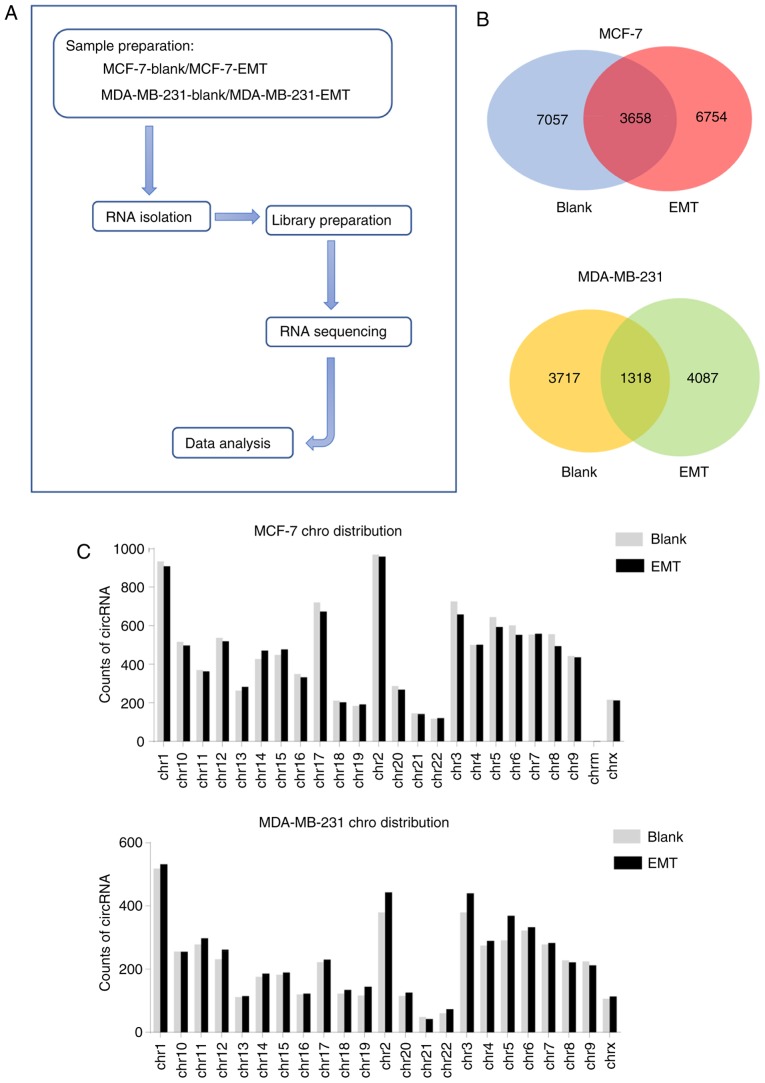
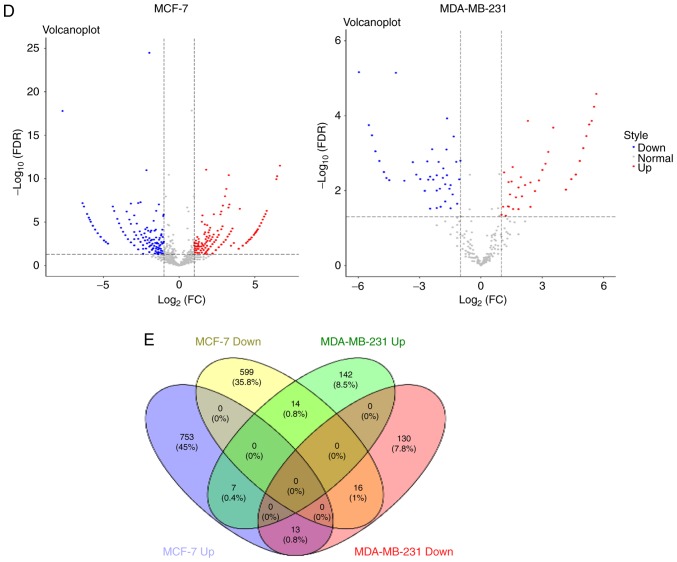
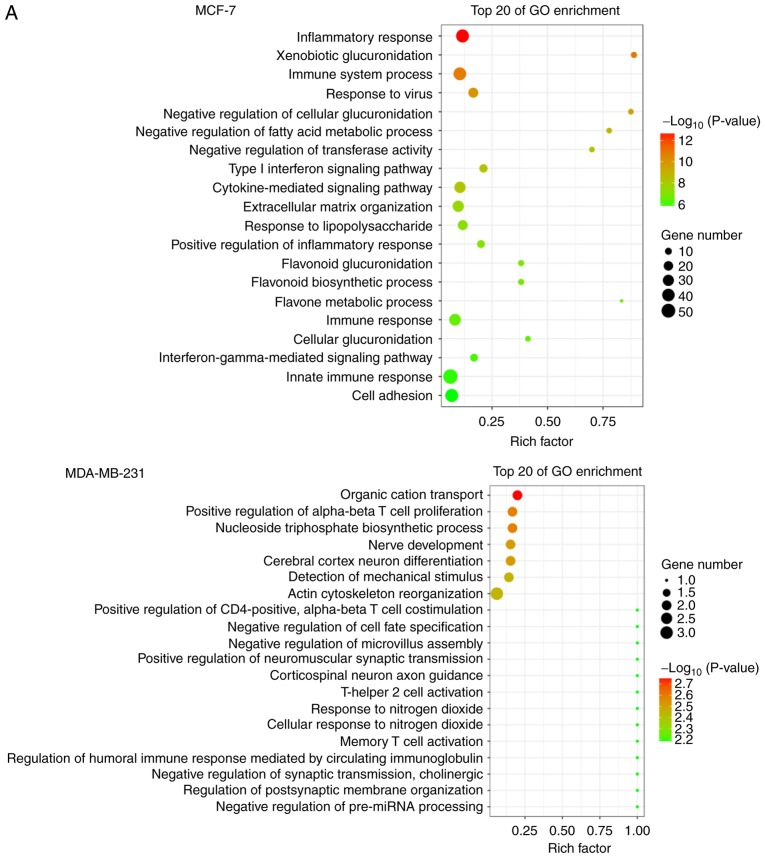
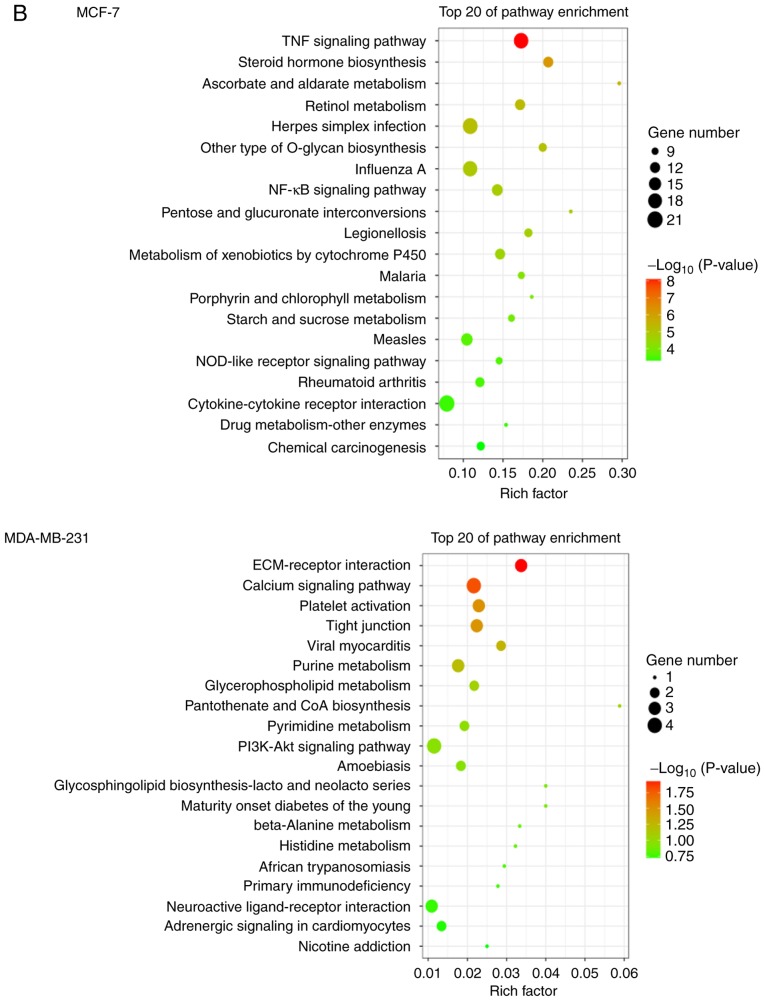
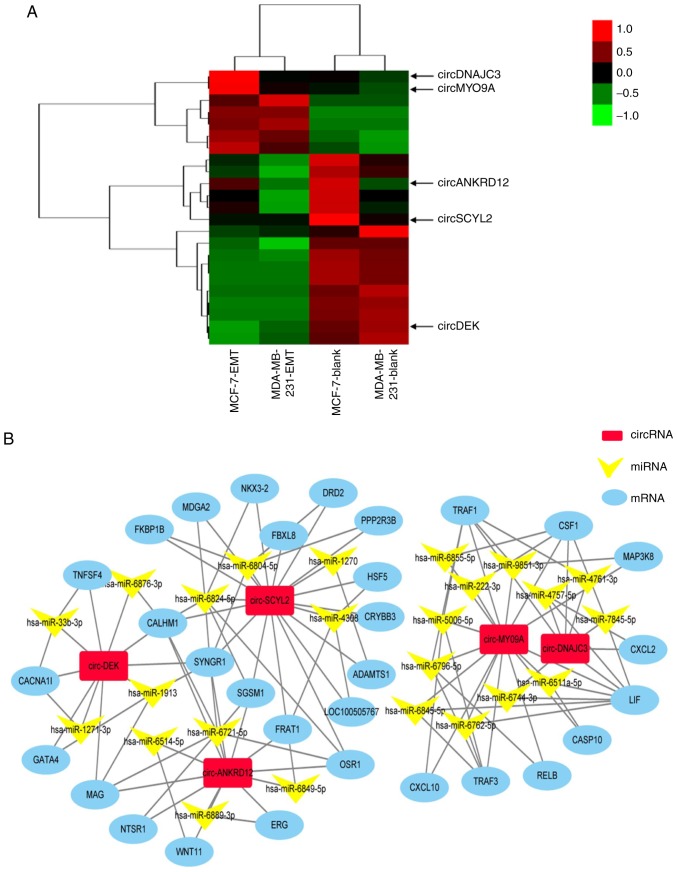
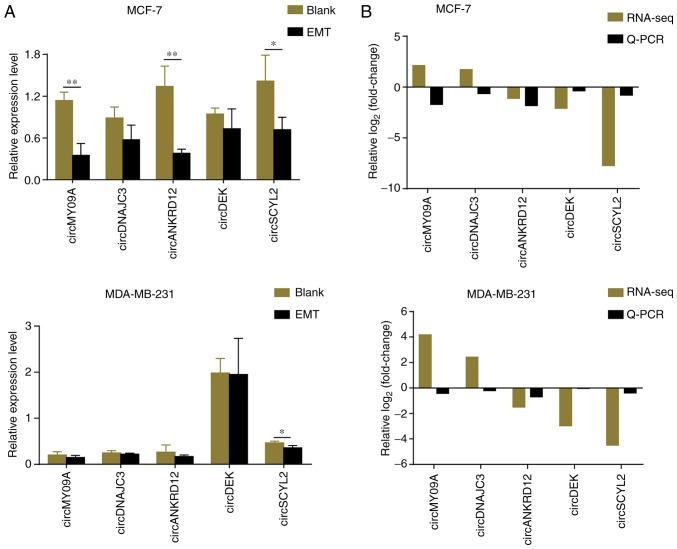
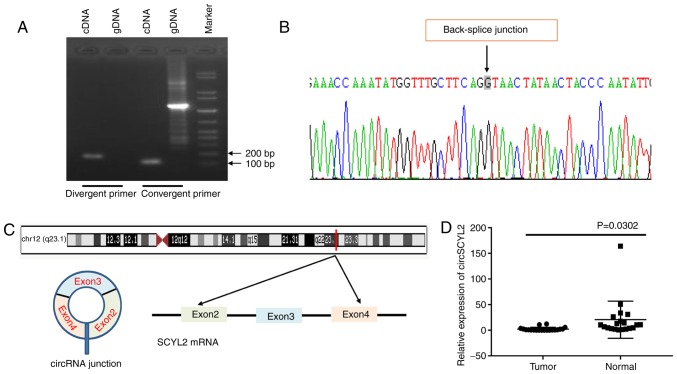
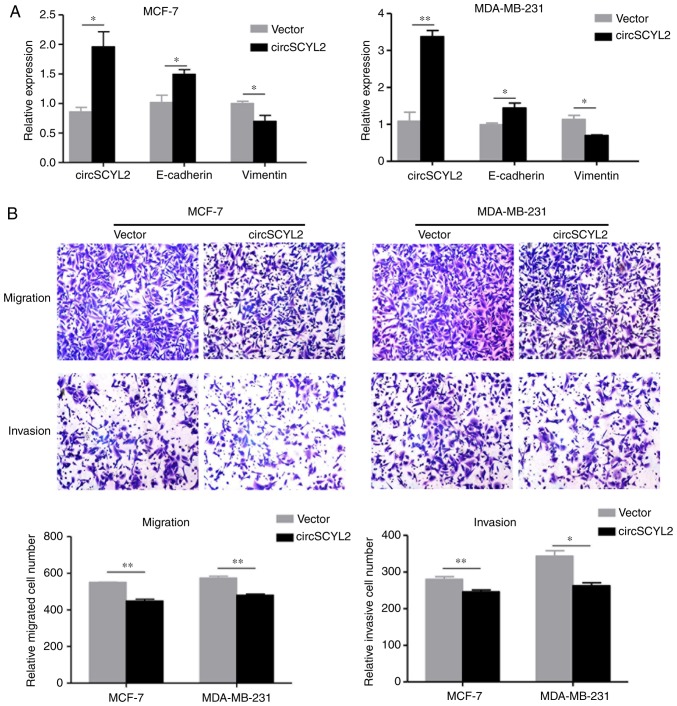
Substantial evidence indicates that circular RNAs (circRNAs) play vital roles in several diseases, especially in cancer development. However, the functions of circRNAs in breast cancer metastasis remain to be investigated. This study aimed to identify the key circRNAs involved in epithelial mesenchymal transition (EMT) of breast cancer and evaluated their molecular function and roles in pathways that may be associated with tumor metastasis. An EMT model was constructed by treating breast cancer cells MCF‑7 and MDA‑MB‑231 with transforming growth factor‑β1. High‑throughput RNA sequencing was used to identify the differentially expressed circRNAs in EMT and blank groups of two cells, and reverse transcription‑quantitative PCR was used to validate the expression of circSCYL2 in human breast cancer tissues and cells. The effects of circSCYL2 on breast cancer cells were explored by transfecting with plasmids and the biological roles were assessed using transwell assays. EMT groups of breast cancer cells exhibited the characteristics of mesenchymal cells. Furthermore, the present study found that 7 circRNAs were significantly upregulated in both the MCF‑7 EMT and MDA‑MB‑231 EMT groups, while 16 circRNAs were significantly downregulated. The current study identified that circSCYL2 was downregulated in breast cancer tissues and cell lines, and that circSCYL2 overexpression inhibited cell migration and invasion. This study provides expression profiles of circRNAs in EMT groups of breast cancer cells. circSCYL2, which is downregulated in breast cancer tissues and cells, may play an important role in breast cancer EMT progression.


Figures

Figure 1
Figure 1
Establishment of EMT model in breast cancer cells. (A) Representative micrographs (magnification, ×100) of tumor cells after 0 and 48 h trans-forming growth factor-β1 induction. (B) Reverse transcription-quantitative PCR validated the expression levels of E-cadherin and Vimentin in EMT and blank groups of two cells. Experiments were performed in quadruplicate. The value of 2-ΔΔCq was used to show the expressional level of RNAs. Data are expressed as mean ± SD. (C) Protein levels of E-cadherin and Vimentin were measured by western blot analysis. GAPDH was used as an internal control. *P<0.05 and **P<0.01. EMT, epithelial mesenchymal transition; circ, circular; E, epithelial.
Figure 2
Figure 2
Analysis of circRNA transcript data and differentially expressed circRNAs. (A) The flowchart of RNA-sequencing. (B) Venn diagram shows circRNAs distributions between blank and EMT of two cells. The blue and red circles represent the number of circRNAs in MCF-7 blank and EMT cells, respectively. The yellow and green circles represent the number of circRNAs in MDA-MB-231 blank and EMT cells, respectively. (C) Chromosomal location of circRNAs between blank and EMT lines of MCF-7 and MDA-MB-231 individually. (D) Volcano plot visualizing the differential expression of circRNAs between blank and EMT group. X-axis: Log2 (fold-change) of circRNA expression levels between EMT and blank groups of two breast cells. Y-axis: The FDR value (-log10 transformed) of circRNAs. The blue dot indicates >2-fold decreased and red dot indicates >2-fold increased expression of the dysregulated circRNAs. (FDR<0.05). (E) Venn diagram comparison of significantly dysregulated circRNAs in two tumor cells. The purple and yellow circles represent up- and downregulated circRNAs respectively in MCF-7 EMT cells. The green and red circle represent up- and downregulated circRNAs, respectively in MDA-MB-231 EMT cells. EMT, epithelial mesenchymal transition; circ, circular; FDR, false discovery rate.
Figure 2
Figure 2
Analysis of circRNA transcript data and differentially expressed circRNAs. (A) The flowchart of RNA-sequencing. (B) Venn diagram shows circRNAs distributions between blank and EMT of two cells. The blue and red circles represent the number of circRNAs in MCF-7 blank and EMT cells, respectively. The yellow and green circles represent the number of circRNAs in MDA-MB-231 blank and EMT cells, respectively. (C) Chromosomal location of circRNAs between blank and EMT lines of MCF-7 and MDA-MB-231 individually. (D) Volcano plot visualizing the differential expression of circRNAs between blank and EMT group. X-axis: Log2 (fold-change) of circRNA expression levels between EMT and blank groups of two breast cells. Y-axis: The FDR value (-log10 transformed) of circRNAs. The blue dot indicates >2-fold decreased and red dot indicates >2-fold increased expression of the dysregulated circRNAs. (FDR<0.05). (E) Venn diagram comparison of significantly dysregulated circRNAs in two tumor cells. The purple and yellow circles represent up- and downregulated circRNAs respectively in MCF-7 EMT cells. The green and red circle represent up- and downregulated circRNAs, respectively in MDA-MB-231 EMT cells. EMT, epithelial mesenchymal transition; circ, circular; FDR, false discovery rate.
Figure 3
Figure 3
Scatterplot of top 20 distinguishable enriched GO and KEGG terms of differentially expressed circRNAs. (A) The top 20 enriched GO terms of the differentially expressed circRNAs. The Y-axis represents GO name and the X-axis represents the Rich factor. The size of each bubble represents the number of differentially expressed genes enriched in GO terms, and color represents -log10 (P-value). (B) The top 20 enriched KEGG pathways of the differentially expressed circRNAs. The Y-axis represents pathway name and the X-axis represents the Rich factor. The size and color of each bubble represents the number of differentially expressed genes enriched in the pathway and -log10 (P-value), respectively. circ, circular; GO, gene ontology; KEGG, Kyoto Encyclopedia of Genes and Genomes.
Figure 3
Figure 3
Scatterplot of top 20 distinguishable enriched GO and KEGG terms of differentially expressed circRNAs. (A) The top 20 enriched GO terms of the differentially expressed circRNAs. The Y-axis represents GO name and the X-axis represents the Rich factor. The size of each bubble represents the number of differentially expressed genes enriched in GO terms, and color represents -log10 (P-value). (B) The top 20 enriched KEGG pathways of the differentially expressed circRNAs. The Y-axis represents pathway name and the X-axis represents the Rich factor. The size and color of each bubble represents the number of differentially expressed genes enriched in the pathway and -log10 (P-value), respectively. circ, circular; GO, gene ontology; KEGG, Kyoto Encyclopedia of Genes and Genomes.
Figure 4
Figure 4
Construction of the circRNA-miRNA-mRNA interaction network. (A) Hierarchical cluster of the simultaneously dysregulated circRNAs expression profiles in the EMT and blank groups of two cells. The heatmap colors represent relative circRNA abundance in each sample. The color scale runs from green (low intensity) to red (strong intensity). (B) The circRNA-miRNA-mRNA network for the 5 circRNAs. chr15_72046634_72007826_-38808- MYO9A (circMY09A), chr13_95763953_95757644_+6309-DNAJC3 (circDNAJC3), chr18_9221999_9208657_+13342-ANKRD12 (circANKRD12), chr 6_18258405_18236452_-21953-DEK (circDEK), chr12_100298175_100282943_+15232-SCYL2 (circSCYL2). circ, circular; miRNA, microRNA; EMT, epithelial-mesenchymal transition.
Figure 5
Figure 5
Verification of candidate circRNAs by RT-qPCR. (A) The relative expression levels of the selected significantly differentially expressed circRNAs were validated by RT-qPCR. The value of 2-ΔΔCq was used to show the expression level of circRNAs. Data are expressed as mean ± SD. *P<0.05 and **P<0.01 (B) Relative log2 (fold-change) of circRNAs expression between RNA-sequencing and RT-qPCR results. GAPDH was used as the internal control. RT-q, reverse transcription-quantitative; circ, circular; EMT, epithelial-mesenchymal transition.
Figure 6
Figure 6
circSCYL2 is significantly downregulated in breast cancer. (A) PCR analysis with divergent primers and convergent primers for circSCYL2 and its linear isoform SCYL2 in cDNA and gDNA. Convergent primers were used to amplify mRNA. gDNA was used as control. (B) RT-qPCR products were used to verify the existence of circSCYL2 and its back-splice junction by Sanger sequencing. (C) Schematic illustration showing the circularization of SCYL2 (NM_001317784.1) exon 2-4 form circSCYL2. (D) RT-qPCR assay confirmed the low expression of circSCYL2 in 20 pairs of human breast cancer tissues compared with their adjacent normal tissues. The relative levels of circSCYL2 were expressed as the value of 2−ΔΔCq. Data are mean ± SD, n=3. GAPDH was used as control. RT-q, reverse transcription-quantitative; circ, circular; gDNA, genomic DNA.
Figure 7
Figure 7
Over-expression of circSCYL2 inhibits the migration and invasion of breast cancer cells. (A) The expression levels of circSCYL2, E-cadherin and Vimentin in MCF-7 and MDA-MB-231 cells after transfection with circSCYL2 or control vector plasmids were detected by RT-qPCR. The value of 2−ΔΔCq was used to show the expressional level of RNAs. Data are expressed as mean ± SD. *P<0.05 and **P<0.01. (B) Cell migration and invasion abilities of MCF-7 and MDA-MB-231 cells transfected with circSCYL2 or the control vector were evaluated by transwell migration and matrigel invasion assays (magnification, ×100). Data are mean ± SD, n=3. *P<0.05 and **P<0.01. RT-q, reverse transcription-quantitative; circ, circular; E, epithelial.

Similar articles

Cited by

References

    1. Siegel RL, Miller KD, Jemal A. Cancer statistics, 2017. CA Cancer J Clin. 2017;67:7–30. doi: 10.3322/caac.21387. - DOI - PubMed
    1. Zhou J, Zhang WW, Peng F, Sun JY, He ZY, Wu SG. Downregulation of hsa_circ_0011946 suppresses the migration and invasion of the breast cancer cell line MCF-7 by targeting RFC3. Cancer Manag Res. 2018;10:535–544. doi: 10.2147/CMAR.S155923. - DOI - PMC - PubMed
    1. Rodgers RJ, Reid GD, Koch J, Deans R, Ledger WL, Friedlander M, Gilchrist RB, Walters KA, Abbott JA. The safety and efficacy of controlled ovarian hyperstimulation for fertility preservation in women with early breast cancer: A systematic review. Hum Reprod. 2017;32:1033–1045. doi: 10.1093/humrep/dex027. - DOI - PubMed
    1. Zhou SY, Chen W, Yang SJ, Xu ZH, Hu JH, Zhang HD, Zhong SL, Tang JH. The emerging role of circular RNAs in breast cancer. Biosci Rep. 2019;39:BSR20190621. doi: 10.1042/BSR20190621. - DOI - PMC - PubMed
    1. Hattori M, Iwata H. Advances in treatment and care in meta-static breast cancer (MBC): Are there MBC patients who are curable? Chin Clin Oncol. 2018;7:23. doi: 10.21037/cco.2018.05.01. - DOI - PubMed

MeSH terms