. 2020 Jun;43(6):1964-1974.
doi: 10.3892/or.2020.7565. Epub 2020 Mar 26.

Ubiquitin specific peptidase 19 is a prognostic biomarker and affect the proliferation and migration of clear cell renal cell carcinoma

Affiliations

Ubiquitin specific peptidase 19 is a prognostic biomarker and affect the proliferation and migration of clear cell renal cell carcinoma

Wenbing Hu et al. Oncol Rep. 2020 Jun.

Abstract

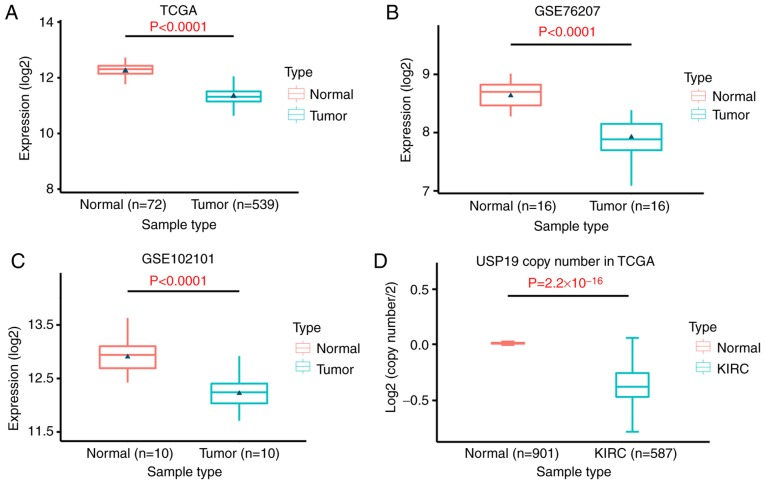
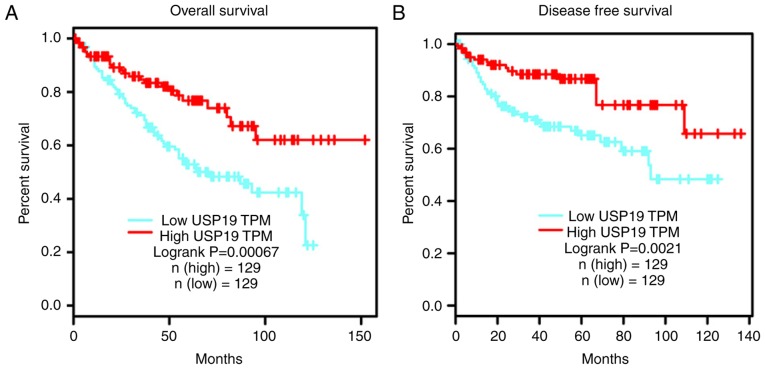
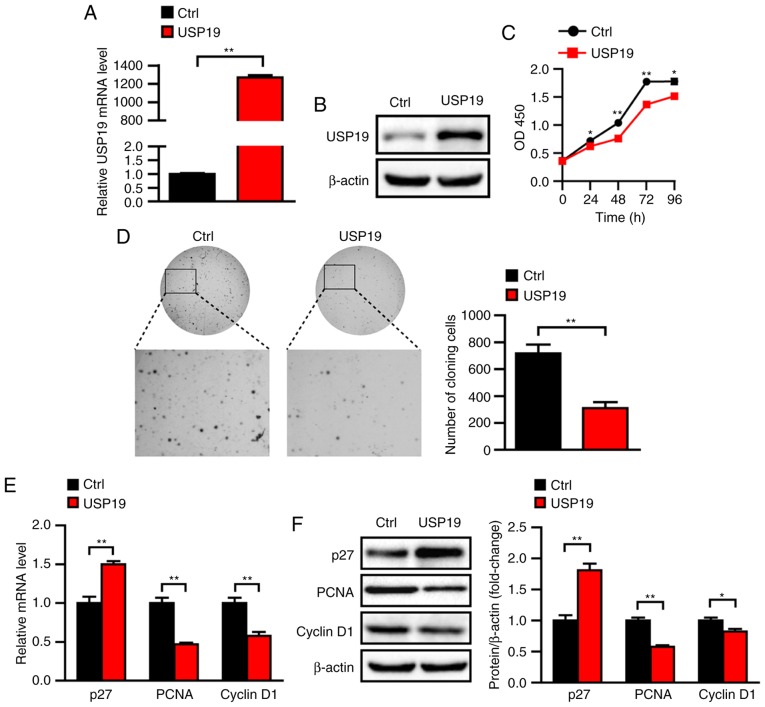
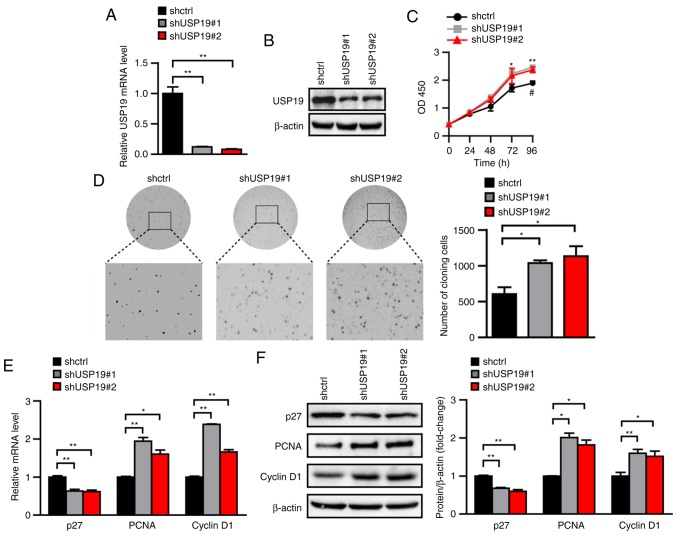
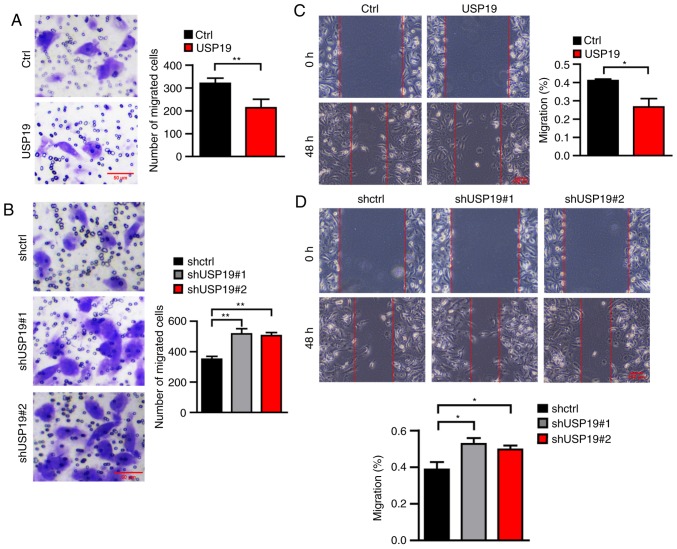
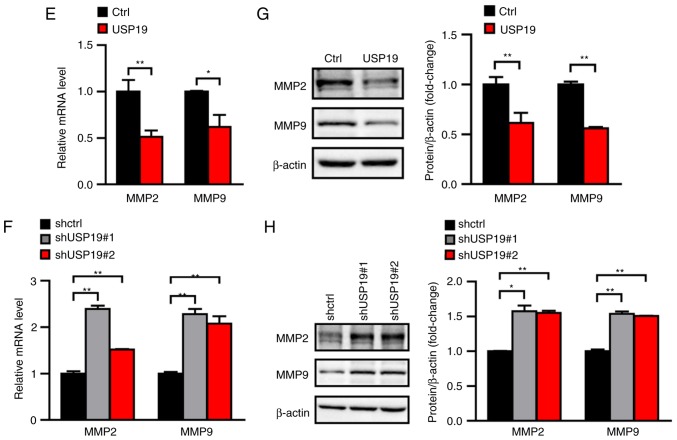
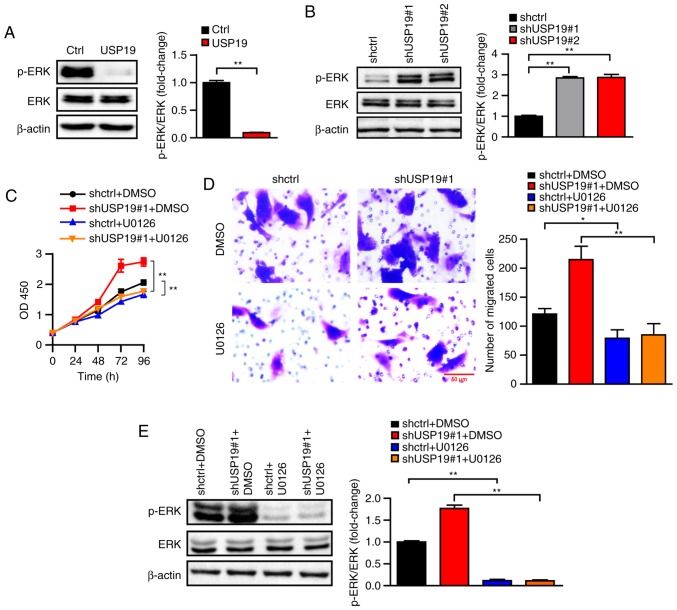
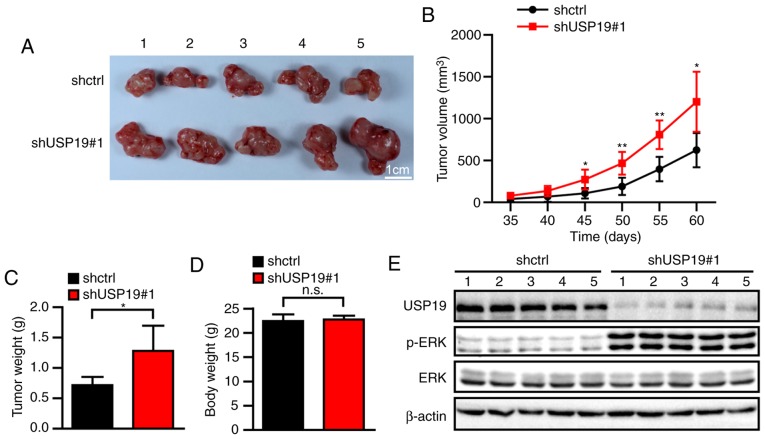
Ubiquitin specific peptidase 19 (USP19) is a member of the USP family and exhibits diverse roles in various biological processes, such as cell differentiation, cell cycle progression and apoptosis. There is limited knowledge regarding the role and impact of USP19 in cancer, particularly clear cell renal cell carcinoma (ccRCC). To examine the function of USP19 in ccRCC, The Cancer Genome Atlas (TCGA) and Gene Expression Omnibus databases were examined to determine USP19 mRNA expression levels. USP19 mRNA levels were significantly lower in ccRCC tissues than in normal tissues. USP19 downregulation was associated with ccRCC progression and poor prognostic outcomes in TCGA cohort. Furthermore, the functional involvement of USP19 in ccRCC was examined using Cell Counting Kit‑8, soft agar, Transwell and wound healing assays in vitro following overexpression or knockdown of USP19 in the Caki‑1 cell line. USP19 overexpression inhibited ccRCC proliferation and migration, whereas USP19 knockdown promoted ccRCC proliferation and migration in vitro. Consistent with these results, it was further demonstrated that USP19 downregulation promoted tumor growth in vivo in a xenograft model. Mechanistically, it was found that USP19 exerted its inhibitory effect on ccRCC proliferation and migration by suppressing the activation of ERK. Collectively, the present findings identified a role for USP19 as a tumor suppressor in ccRCC and demonstrated that USP19 is a potential prognostic biomarker that could be applied in ccRCC therapy.

Keywords: ubiquitin specific peptidase 19; clear cell renal cell carcinoma; suppressor; proliferation; migration.


Figures

Figure 1.
Figure 1.
USP19 is downregulated in clear cell renal cell carcinoma tissue. USP19 expression was downregulated in renal cancer tissues compared with in normal renal tissues in (A) TCGA, (B) GSE76207 and (C) GSE102101 datasets. (D) USP19 copy number was significantly lower in KIRC tissues than in normal tissues. TCGA, The Cancer Genome Atlas; KIRC, kidney renal clear cell carcinoma; USP, ubiquitin specific peptidase.
Figure 2.
Figure 2.
Low USP19 expression is associated with clear cell renal cell carcinoma prognosis. Gene Expression Profiling Interactive Analysis revealed associations between USP19 expression and (A) OS and (B) DFS rates according to The Cancer Genome Atlas kidney renal clear cell carcinoma data. OS, overall survival; DFS, disease-free survival; USP, ubiquitin specific peptidase; TPM, transcript per million.
Figure 3.
Figure 3.
USP19 overexpression inhibits clear cell renal cell carcinoma cell proliferation in vitro. Expression of USP19 was evaluated by (A) RT-qPCR and (B) western blotting in USP19-overexpressing or control Caki-1 cells. (C) Cell Counting Kit-8 assays and (D) and soft agar assays were performed to detect cell proliferation in USP19-overexpressing or control Caki-1 cells. (E) RT-qPCR analysis of PCNA, cyclin D1 and p27 mRNA levels in USP19-overexpressing or control Caki-1 cells. (F) Western blot analysis of PCNA, cyclin D1 and p27 protein levels in USP19-overexpressing or control Caki-1 cells. β-actin was used as the loading control, and 3 replicates of the indicated proteins were quantified by Image Lab software. Data are presented as the mean ± SD of three independent experiments. *P<0.05, **P<0.01 vs. ctrl. USP, ubiquitin specific peptidase; RT-qPCR, reverse transcription-quantitative PCR; PCNA, proliferating cell nuclear antigen; OD, optical density.
Figure 4.
Figure 4.
Knockdown of USP19 expression promotes clear cell renal cell carcinoma cell proliferation in vitro. Expression of USP19 was evaluated by (A) RT-qPCR and (B) western blotting in USP19 knockdown or control Caki-1 cells. (C) Cell Counting Kit-8 assays and (D) and soft agar assays were performed to detect cell proliferation in USP19 knockdown or control Caki-1 cells. (E) RT-qPCR analysis of PCNA, cyclin D1 and p27 mRNA levels in USP19 knockdown or control Caki-1 cells. (F) Western blot analysis of PCNA, cyclin D1 and p27 protein levels in USP19 knockdown or control Caki-1 cells. β-actin was used as the loading control, and 3 replicates of the indicated proteins were quantified by Image Lab software. Data are presented as the mean ± SD of three independent experiments. *P<0.05, **P<0.01 vs. shctrl; #P<0.05 vs. shUSP19#2. USP, ubiquitin specific peptidase; RT-qPCR, reverse transcription-quantitative PCR; PCNA, proliferating cell nuclear antigen; sh, short hairpin RNA; OD, optical density.
Figure 5.
Figure 5.
USP19 inhibits clear cell renal cell carcinoma cell migration in vitro. Migration abilities of (A) USP19-overexpressing and (B) knockdown Caki-1 cells were determined via Transwell assays; scale bar=100 µm, n=4. Migration abilities of (C) USP19-overexpressing and (D) knockdown Caki-1 cells were determined via wound healing assays; scale bar=300 µm, n=4. Reverse transcription-quantitative PCR analysis of MMP2 and MMP9 mRNA levels in (E) USP19-overexpressing or (F) knockdown Caki-1 cells; n=3. Protein expression of MMP2 and MMP9 in (G) USP19-overexpressing or (H) knockdown Caki-1 cells; n=3. Data are presented as the mean ± SD. *P<0.05, **P<0.01. USP, ubiquitin specific peptidase; RT-qPCR, reverse transcription-quantitative PCR; MMP, matrix metalloproteinase; sh, short hairpin RNA.
Figure 5.
Figure 5.
USP19 inhibits clear cell renal cell carcinoma cell migration in vitro. Migration abilities of (A) USP19-overexpressing and (B) knockdown Caki-1 cells were determined via Transwell assays; scale bar=100 µm, n=4. Migration abilities of (C) USP19-overexpressing and (D) knockdown Caki-1 cells were determined via wound healing assays; scale bar=300 µm, n=4. Reverse transcription-quantitative PCR analysis of MMP2 and MMP9 mRNA levels in (E) USP19-overexpressing or (F) knockdown Caki-1 cells; n=3. Protein expression of MMP2 and MMP9 in (G) USP19-overexpressing or (H) knockdown Caki-1 cells; n=3. Data are presented as the mean ± SD. *P<0.05, **P<0.01. USP, ubiquitin specific peptidase; RT-qPCR, reverse transcription-quantitative PCR; MMP, matrix metalloproteinase; sh, short hairpin RNA.
Figure 6.
Figure 6.
USP19 regulates clear cell renal cell carcinoma cell proliferation and migration by activating the ERK signaling pathway. (A) Levels of p-ERK and total ERK were measured by western blotting in USP19-overexpressing or control Caki-1 cells; n=3. (B) Levels of p-ERK and total ERK measured by western blotting in USP19 knockdown or control Caki-1 cells; n=3. (C) Cell Counting Kit-8 assays were performed to detect cell proliferation in USP19 knockdown or control Caki-1 cells treated with DMSO or U0126; n=3. (D) Transwell assays performed to detect cell migration in USP19 knockdown or control Caki-1 cells treated with DMSO or U0126; scale bar=100 µm, n=4. (E) Levels of p-ERK and total ERK in USP19 knockdown or control Caki-1 cells treated with DMSO or U0126; n=3. Data are presented as the mean ± SD. *P<0.05, **P<0.01. USP, ubiquitin specific peptidase; p, phosphorylated; sh, short hairpin RNA.
Figure 7.
Figure 7.
USP19 inhibits the tumorigenesis of clear cell renal cell carcinoma cells in vivo. (A) Photographs of mouse xenografts generated by subcutaneous injection of Caki-1 cells; n=5/group. (B) Tumor volumes were evaluated after injection every 5 days for 60 days. (C) Weights of the xenografts were measured 60 days after injection. (D) Body weights of the mice were measured 60 days after injection. (E) Protein levels of USP19, p-ERK and total ERK in tumor tissue were analyzed via western blotting. Data are presented as the mean ± SD. *P<0.05, **P<0.01 vs. shctrl. USP, ubiquitin specific peptidase; p, phosphorylated; sh, short hairpin RNA; n.s., not significant.

Similar articles

Cited by

References

    1. Bray F, Ferlay J, Soerjomataram I, Siegel RL, Torre LA, Jemal A. Global cancer statistics 2018: GLOBOCAN estimates of incidence and mortality worldwide for 36 cancers in 185 countries. CA Cancer J Clin. 2018;68:394–424. doi: 10.3322/caac.21492. - DOI - PubMed
    1. Rini BI, Campbell SC, Escudier B. Renal cell carcinoma. Lancet. 2009;373:1119–1132. doi: 10.1016/S0140-6736(09)60229-4. - DOI - PubMed
    1. Delahunt B, Bethwaite PB, Nacey JN. Outcome prediction for renal cell carcinoma: Evaluation of prognostic factors for tumors divided according to histological subtype. Pathology. 2007;39:459–465. doi: 10.1080/00313020701570061. - DOI - PubMed
    1. Lin YF, Chou JL, Chang JS, Chiu IJ, Chiu HW, Lin YF. Dysregulation of the miR-25-IMPA2 axis promotes metastatic progression in clear cell renal cell carcinoma. EBioMedicine. 2019;45:220–230. doi: 10.1016/j.ebiom.2019.06.006. - DOI - PMC - PubMed
    1. Afriansyah A, Hamid AR, Mochtar CA, Umbas R. Targeted therapy for metastatic renal cell carcinoma. Acta Med Indones. 2016;48:335–347. - PubMed

MeSH terms