. 2020 Nov;24(11):3923-3937.
doi: 10.1007/s00784-020-03259-8. Epub 2020 Mar 31.

Role of hyaluronan in regulating self-renewal and osteogenic differentiation of mesenchymal stromal cells and pre-osteoblasts

Affiliations

Role of hyaluronan in regulating self-renewal and osteogenic differentiation of mesenchymal stromal cells and pre-osteoblasts

Maria B Asparuhova et al. Clin Oral Investig. 2020 Nov.

Abstract

Objectives: The aim of the study was to investigate the impact of two hyaluronan (HA) formulations on the osteogenic potential of osteoblast precursors.

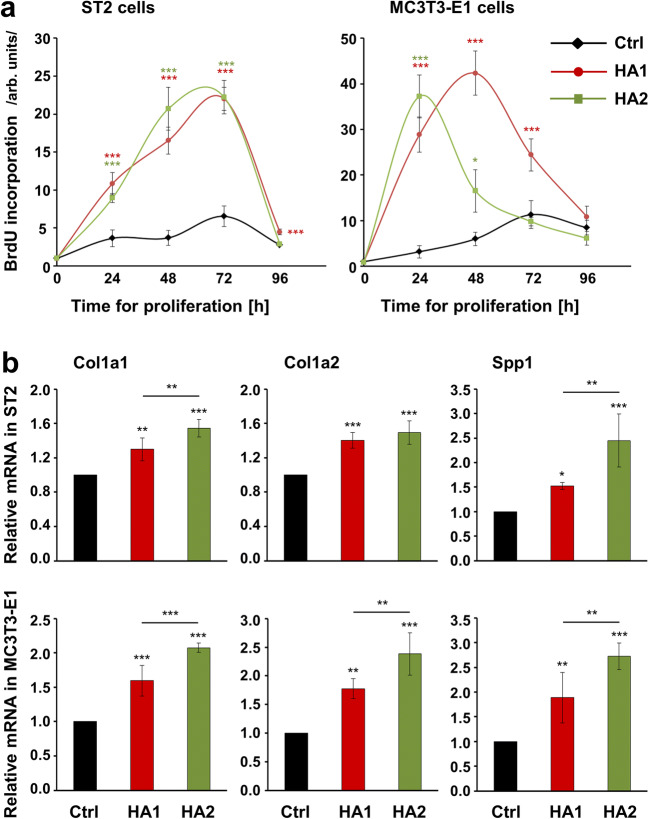
Materials and methods: Proliferation rates of HA-treated mesenchymal stromal ST2 and pre-osteoblastic MC3T3-E1 cells were determined by 5-bromo-20-deoxyuridine (BrdU) assay. Expression of genes encoding osteogenic differentiation markers, critical growth, and stemness factors as well as activation of downstream signaling pathways in the HA-treated cells were analyzed by quantitative reverse transcription-polymerase chain reaction (qRT-PCR) and immunoblot techniques.

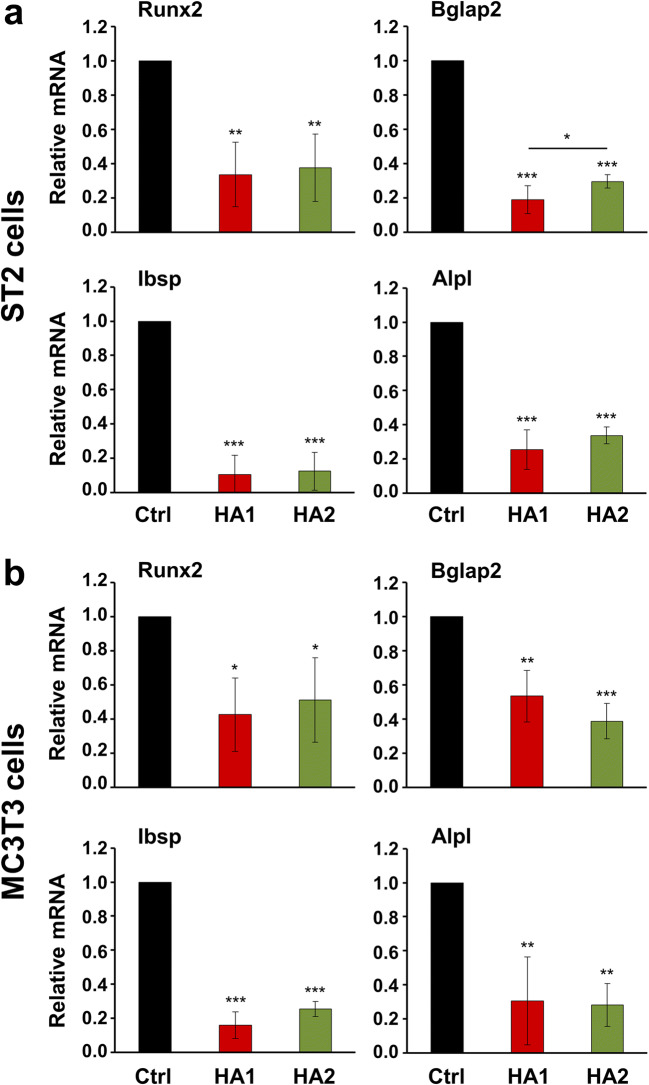
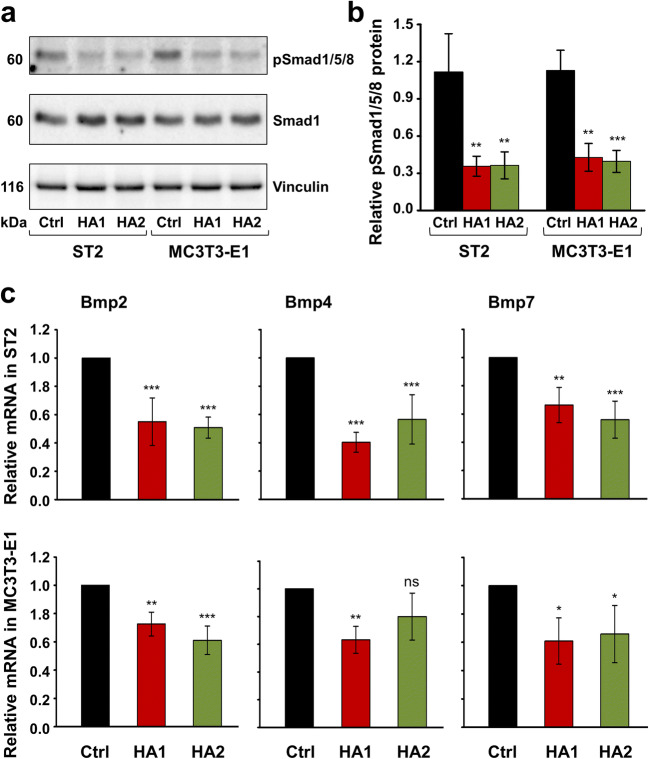
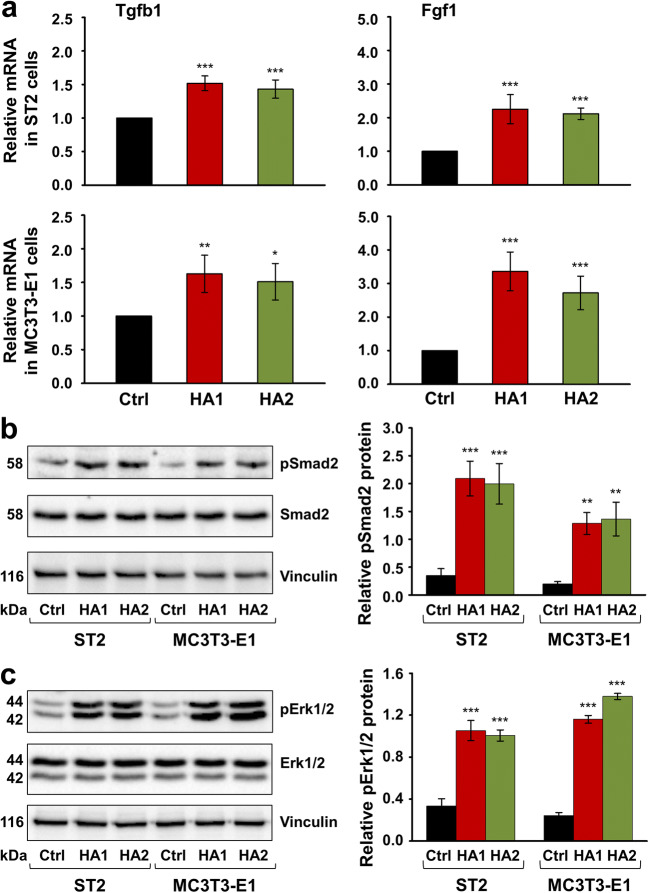
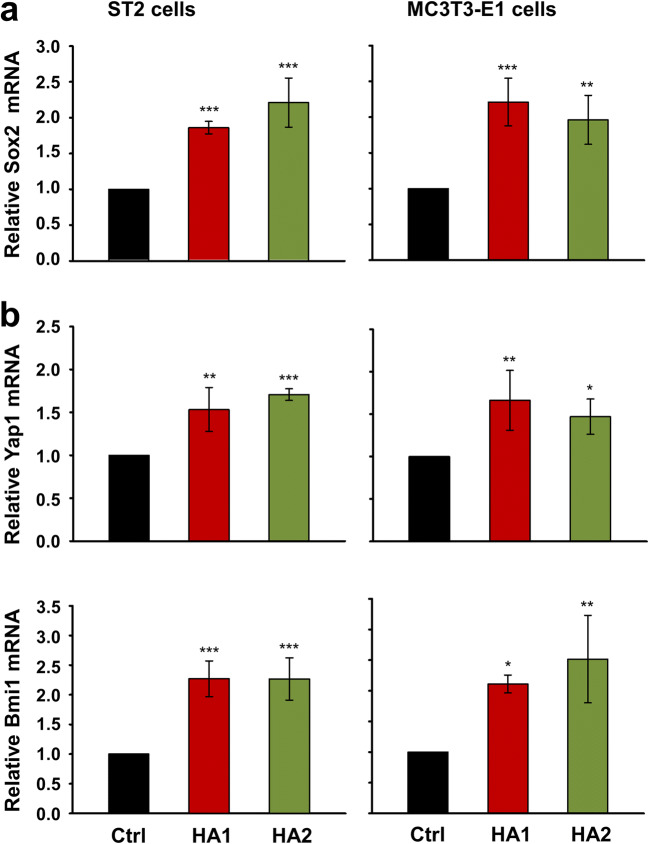
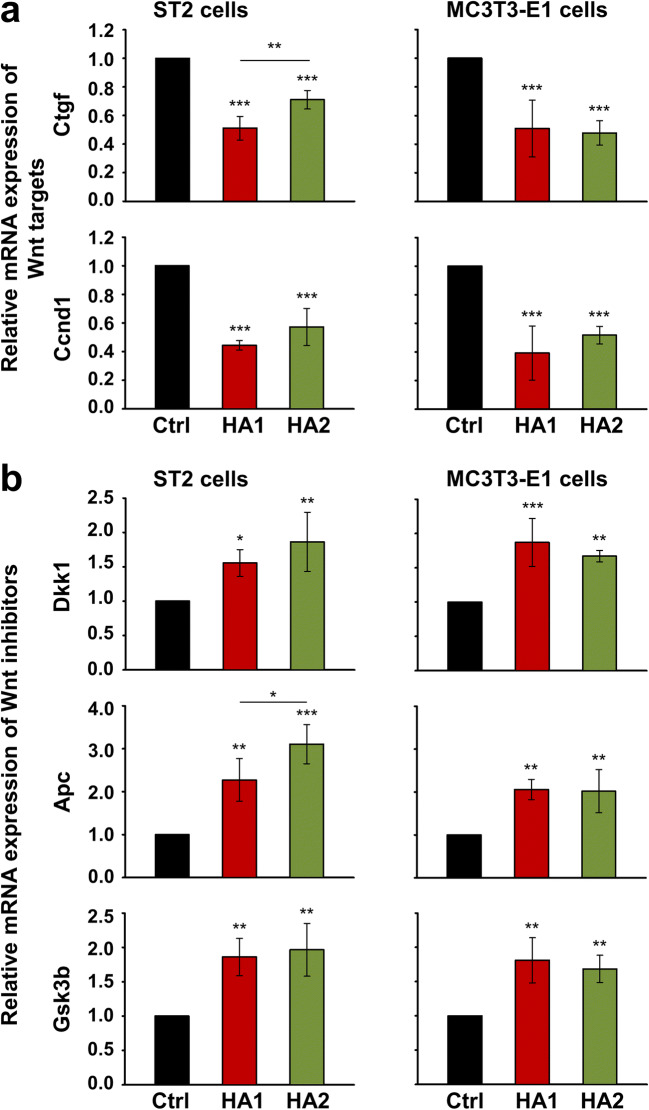
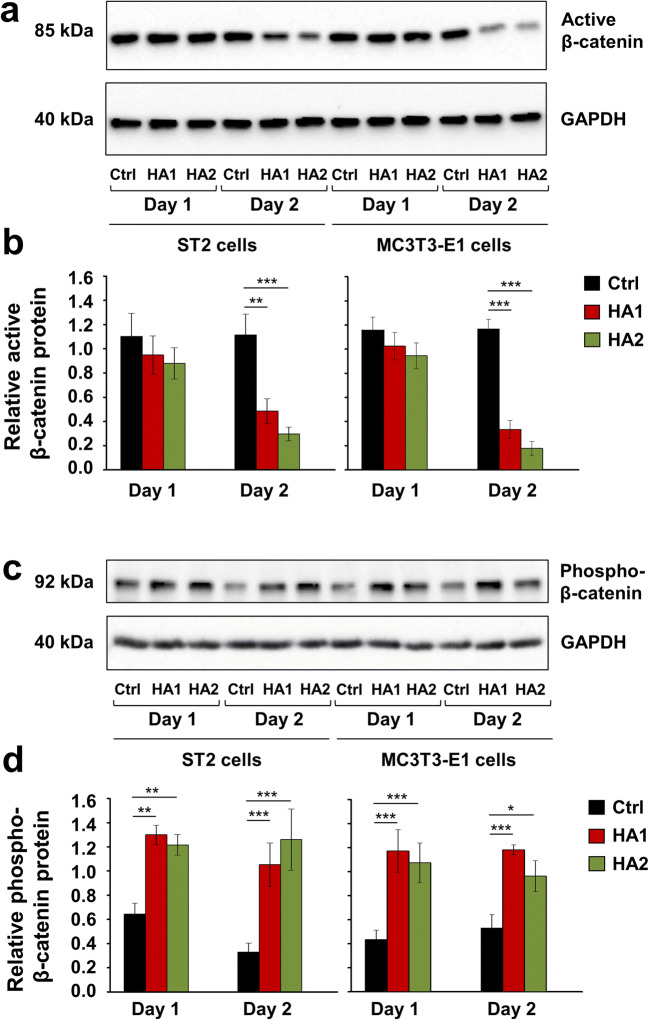
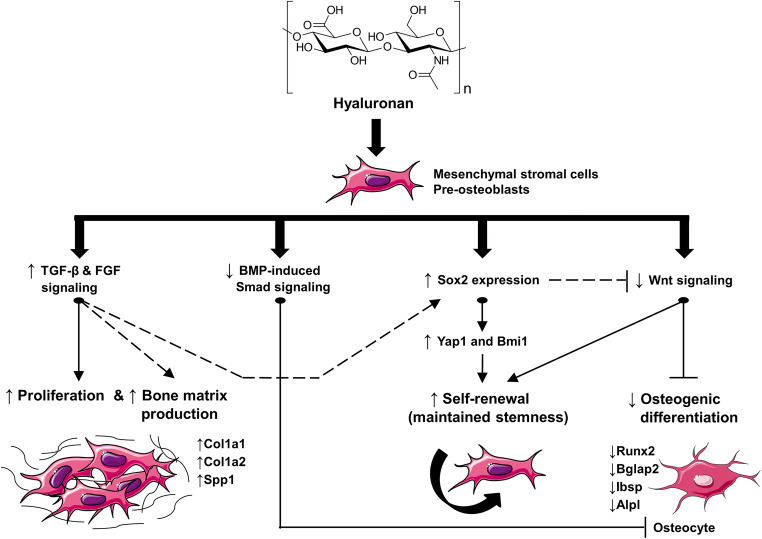
Results: The investigated HAs strongly stimulated the growth of the osteoprogenitor lines and enhanced the expression of genes encoding bone matrix proteins. However, expression of late osteogenic differentiation markers was significantly inhibited, accompanied by decreased bone morphogenetic protein (BMP) signaling. The expression of genes encoding transforming growth factor-β1 (TGF-β1) and fibroblast growth factor-1 (FGF-1) as well as the phosphorylation of the downstream signaling molecules Smad2 and Erk1/2 were enhanced upon HA treatment. We observed significant upregulation of the transcription factor Sox2 and its direct transcription targets and critical stemness genes, Yap1 and Bmi1, in HA-treated cells. Moreover, prominent targets of the canonical Wnt signaling pathway showed reduced expression, whereas inhibitors of the pathway were considerably upregulated. We detected decrease of active β-catenin levels in HA-treated cells due to β-catenin being phosphorylated and, thus, targeted for degradation.

Conclusions: HA strongly induces the growth of osteoprogenitors and maintains their stemness, thus potentially regulating the balance between self-renewal and differentiation during bone regeneration following reconstructive oral surgeries.

Clinical relevance: Addition of HA to deficient bone or bony defects during implant or reconstructive periodontal surgeries may be a viable approach for expanding adult stem cells without losing their replicative and differentiation capabilities.

Keywords: Bone and soft tissue regeneration; Extracellular matrix; Gene expression; Growth factors; Hyaluronic acid; Stemness.


Conflict of interest statement

The authors declare that they have no conflict of interest.

Figures

Fig. 1
Fig. 1
The two HA preparations strongly stimulate the growth of ST2 and MC3T3-E1 cells and enhance the expression of genes encoding bone matrix proteins. a Proliferation rates of HA-treated ST2 and MC3T3-E1 cells were assessed by BrdU incorporation into newly synthesized DNA immediately after plating (0 h) as well as at 24, 48, 72, and 96 h. Means ± SD from three independent experiments and significant differences to untreated control (Ctrl) cells at the time point 0; ***P < 0.001 and *P < 0.05 are shown. b Effect of HA1 and HA2 on Col1a1, Col1a2, and Spp1 mRNA levels in ST2 and MC3T3-E1 cells. Cells were treated with each of the two HA preparations for 24 h before total RNA was extracted and analyzed by qRT-PCR. Values normalized to Gapdh are expressed relative to the values of control (Ctrl) cells. Data represent means ± SD from three independent experiments. Significant differences to the respective control unless otherwise indicated, ***P < 0.001, **P < 0.01, *P < 0.05
Fig. 2
Fig. 2
The two HA preparations inhibit the expression of intermediate and late osteogenic differentiation markers as well as BMP-induced Smad signaling in ST2 and MC3T3-E1 cells. a, b Effect of HA1 and HA2 on Runx2, Bglap2, Ibsp, and Alpl mRNA levels in ST2 (a) and MC3T3-E1 (b) cells. Each of the two cell lines was treated with HA1 or HA2 preparations for 24 h before total RNA was extracted and analyzed by qRT-PCR. Values normalized to Gapdh are expressed relative to the values of untreated control (Ctrl) cells. Data represent means ± SD from three independent experiments. Significant differences to the respective control unless otherwise indicated, ***P < 0.001, **P < 0.01, *P < 0.05
Fig. 3
Fig. 3
The two HA preparations inhibit BMP-activated Smad signaling in ST2 and MC3T3-E1 cells. a, b Immunoblot analysis of phospho-Smad1/5/8 (pSmad1/5/8) protein (a) in whole-cell extracts from ST2 and MC3T3-E1 cells treated with each of the two HA preparations. Blots for total Smad1 protein as well as the vinculin loading control are also shown a. The bar chart (b) represents densitometric quantification of the immunoblots. pSmad1/5/8 levels are normalized to the total Smad1 protein used as internal control. Data represent means ± SD from three independent experiments. Significant differences to the respective control (Ctrl) cells of each of the two cell lines, ***P < 0.001, **P < 0.01. c Effect of HA1 and HA2 on Bmp2, Bmp4, and Bmp7 mRNA levels in ST2 and MC3T3-E1 cells. Cells were treated with each of the two HA preparations for 24 h before total RNA was extracted and analyzed by qRT-PCR. Values normalized to Gapdh are expressed relative to the values of control (Ctrl) cells. Data represent means ± SD from three independent experiments. Significant differences to the respective control, ***P < 0.001, **P < 0.01, *P < 0.05, ns = not significant
Fig. 4
Fig. 4
The two HA preparations significantly enhance the expression of genes encoding TGF-β1 and FGF-1 growth factors as well as the phosphorylation of Smad2 and Erk1/2 signaling molecules in ST2 and MC3T3-E1 cells. a Effect of HA1 and HA2 on Tgfb1 and Fgf1 mRNA levels in ST2 and MC3T3-E1 cells. Cells of each of the two lines were treated with each of the two HA preparations for 24 h before total RNA was extracted and analyzed by qRT-PCR. Values normalized to Gapdh are expressed relative to the values of control (Ctrl) cells. Data represent means ± SD from three independent experiments. Significant differences to the respective control, ***P < 0.001, **P < 0.01, *P < 0.05. b, c Immunoblot analyses of phospho-Smad2 (pSmad2) (b) and phospho-Erk1/2 (pErk1/2) (c) proteins in whole-cell extracts from HA-treated ST2 and MC3T3-E1 cells. Blots for total Smad2 and Erk1/2 proteins as well as the vinculin loading control are also shown. The bar charts represent densitometric quantifications of the immunoblots. pSmad2 and pErk1/2 levels are normalized to the respective total proteins used as internal controls. Data represent means ± SD from three independent experiments. Significant differences to the respective control (Ctrl) cells of each of the two cell lines, ***P < 0.001, **P < 0.01
Fig. 5
Fig. 5
The two HA preparations induce expression of the transcription factor Sox2 and its direct targets Yap1 and Bmi1 in ST2 and MC3T3-E1 cells. a, b Effect of HA1 and HA2 on Sox2 (a), Yap1, and Bmi1 (b) mRNA levels in ST2 and MC3T3-E1 cells. Cells were treated with each of the two HA preparations for 24 h before total RNA was extracted and analyzed by qRT-PCR. Values normalized to Gapdh are expressed relative to the values of control (Ctrl) cells. Data represent means ± SD from three independent experiments. Significant differences to the respective control, ***P < 0.001, **P < 0.01, *P < 0.05
Fig. 6
Fig. 6
The two HA preparations influence the expression of genes involved in the Wnt signaling pathway in ST2 and MC3T3-E1 cells. a HA downregulates the mRNA expression levels of two Wnt target genes, Ctgf and Ccnd1, encoding connective tissue growth factor and cyclin D1 protein, respectively. ST2 and MC3T3-E1 cells were treated with each of the two HA preparations for 24 h before total RNA was extracted and analyzed by qRT-PCR. Values normalized to Gapdh are expressed relative to the values of control (Ctrl) cells. Data represent means ± SD from three independent experiments. Significant differences to the respective control unless otherwise indicated, ***P < 0.001, **P < 0.01. b HA upregulates the mRNA expression levels of three Wnt inhibitors, Dkk1, Apc, and Gsk3b, encoding the dickkopf-related protein 1, adenomatous polyposis coli, and glycogen synthase kinase 3 beta protein, respectively. Cells were treated as in a before mRNA levels of the respective genes were analyzed by qRT-PCR. Values normalized to Gapdh are expressed relative to the values of control (Ctrl) cells. Data represent means ± SD from three independent experiments. Significant differences to the respective control unless otherwise indicated, ***P < 0.001, **P < 0.01, *P < 0.05
Fig. 7
Fig. 7
The two HA preparations inhibit Wnt signaling in ST2 and MC3T3-E1 cells. ad Immunoblots of active β-catenin (a, b) and phospho-β-catenin (c, d) proteins in whole-cell extracts of ST2 and MC3T3-E1 cells treated with each of the two HA preparations. Cell lysates were collected on two consecutive days after the treatment. Anti-GAPDH served as loading control. Densitometric analyses (b, d) of the immunoblots shown in a and c. Active β-catenin (a, b) and phospho-β-catenin (c, d) protein levels are normalized to the GAPDH loading controls. Means ± SD from three independent experiments and significant differences to the respective control (Ctrl) cells, ***P < 0.001, **P < 0.01, *P < 0.05 are shown. No statistically significant differences between identically treated cells on days 1 and 2 after the stimulation were detected
Fig. 8
Fig. 8
Model for the effects of the two investigated HA formulations on the behavior and functionality of mesenchymal stromal ST2 and pre-osteoblastic MC3T3-E1 cells. Treatment of each of the two cell lines, used as a progenitor source of osteoblasts, with HA (a structural formula is presented) results in induced cellular proliferation and bone matrix production, as suggested by the upregulated expression of Col1a1, Col1a2, and Spp1 genes encoding bone matrix proteins. These effects are accompanied and likely influenced by induced TGF-β and FGF signaling in the HA-treated cells. Signaling through both BMP-induced Smad and Wnt pathways is strongly downregulated upon HA treatment, which results in inhibited progression of the osteogenic differentiation as evidenced by decreased expression of intermediate and late osteogenic differentiation marker genes such as Runx2, Bglap2, Ibsp, and Alpl. Finally, HA maintains the stemness of osteoprogenitors by inducing the expression of the transcription factor Sox2 and its direct targets Yap1 and Bmi1. Inhibited Wnt signaling and induced TGF-β/FGF signaling may contribute to the self-renewal capability of HA-treated osteoprogenitors. Taken together, our results suggest a prominent role of HA in inducing the growth, and maintaining the stemness and differentiation potential of mesenchymal stromal and pre-osteoblastic cells. Solid lines in the model represent direct evidence and common knowledge; dashed lines display links that are solidly supported by literature reports. For more details on the displayed links between the HA-induced functionalities, please refer to the text

References

    1. Neuman MG, Nanau RM, Oruna-Sanchez L, Coto G. Hyaluronic acid and wound healing. J Pharm Pharm Sci. 2015;18(1):53–60. doi: 10.18433/J3K89D. - DOI - PubMed
    1. Laurent UBG, Tengblad A. Determination of hyaluronate in biological samples by a specific radioassay technique. Anal Biochem. 1980;109(2):386–394. doi: 10.1016/0003-2697(80)90665-X. - DOI - PubMed
    1. Cowman MK, Lee H-G, Schwertfeger KL, McCarthy JB, Turley EA. The content and size of hyaluronan in biological fluids and tissues. Front Immunol. 2015;6:261. doi: 10.3389/fimmu.2015.00261. - DOI - PMC - PubMed
    1. Bartold PM, Wiebkin OW, Thonard JC. Glycosaminoglycans of human gingival epithelium and connective tissue. Connect Tissue Res. 1981;9(2):99–106. doi: 10.3109/03008208109160247. - DOI - PubMed
    1. Bartold PM, Miki Y, McAllister B, Narayanan AS, Page RG. Glycosaminoglycans of human cementum. J Periodontal Res. 1988;23(1):13–17. doi: 10.1111/j.1600-0765.1988.tb01020.x. - DOI - PubMed

Substances