. 2020 Jul;140(1):7-24.
doi: 10.1007/s00401-020-02151-9. Epub 2020 Mar 31.

PTEN activation contributes to neuronal and synaptic engulfment by microglia in tauopathy

Affiliations

PTEN activation contributes to neuronal and synaptic engulfment by microglia in tauopathy

Joseph Benetatos et al. Acta Neuropathol. 2020 Jul.

Abstract

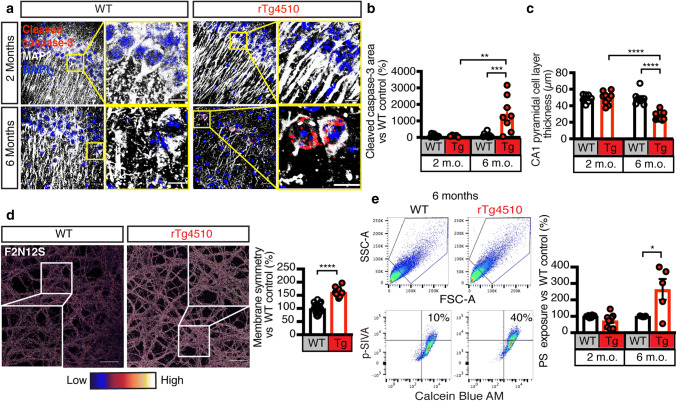
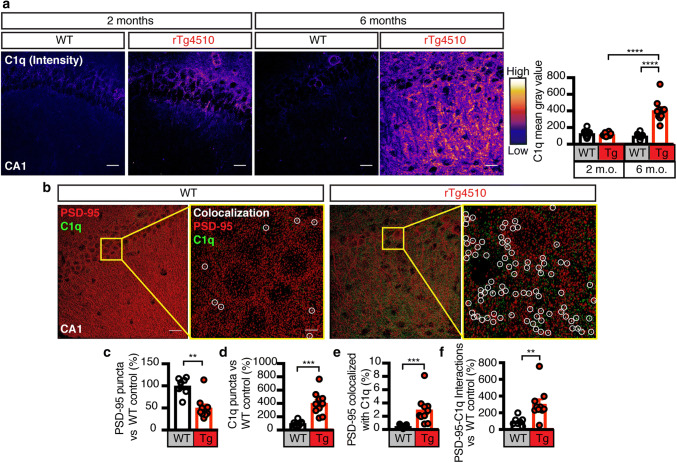
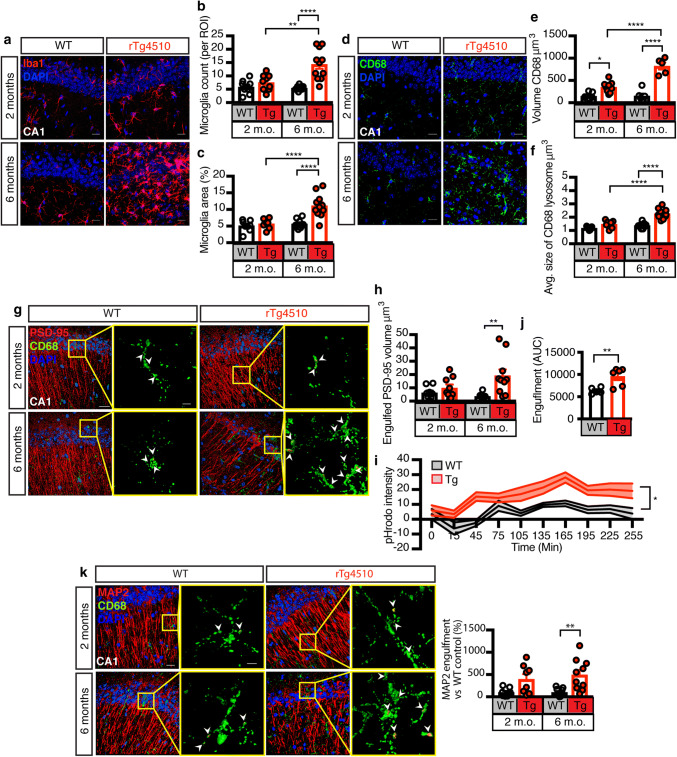
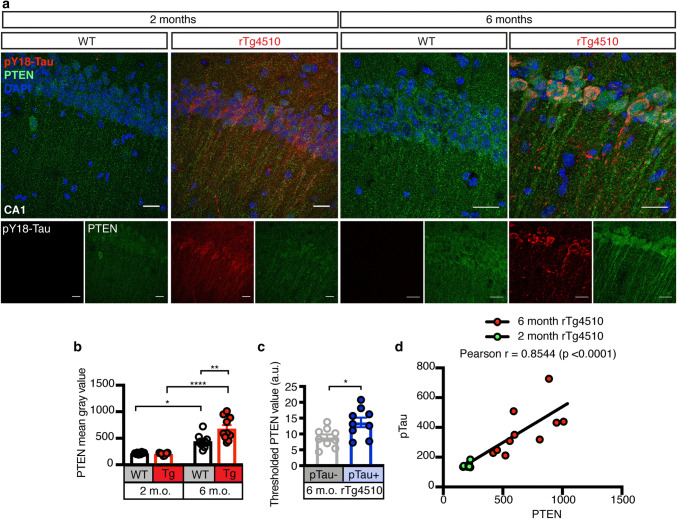
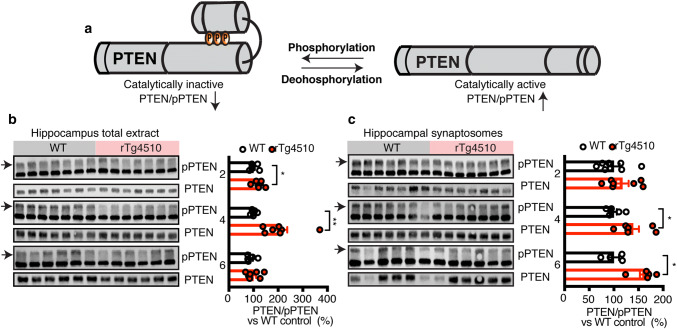
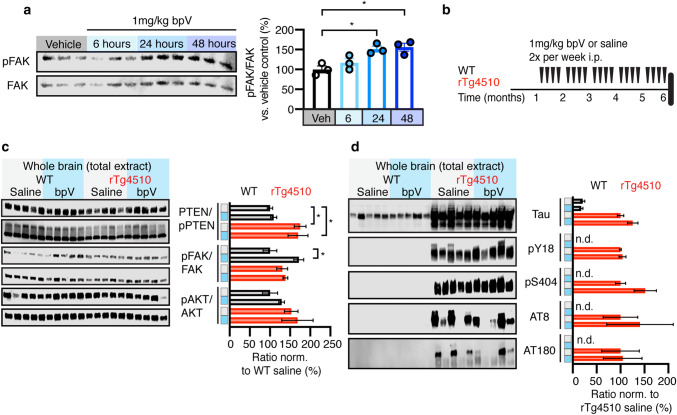
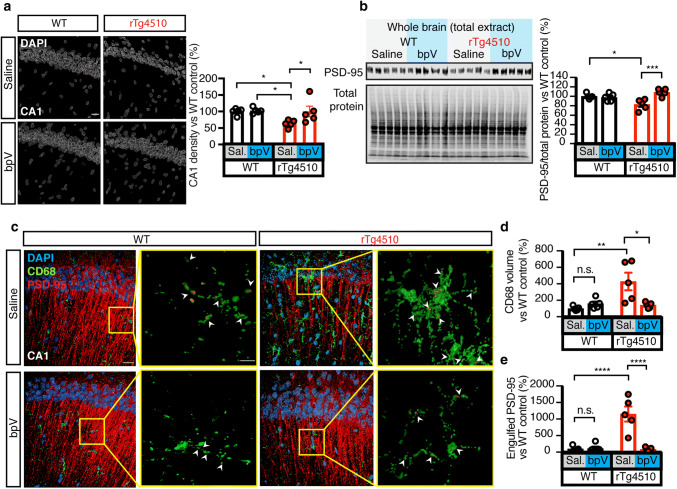
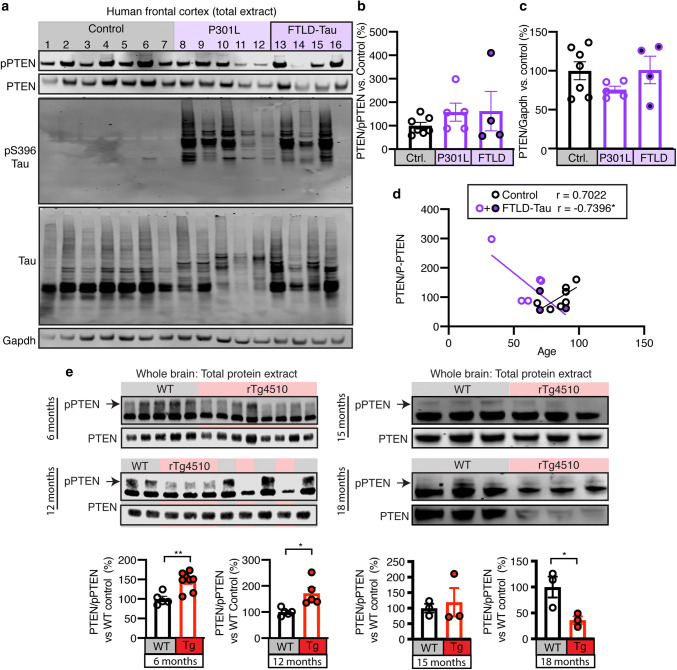
Phosphatase and tensin homolog (PTEN) regulates synaptic density in development; however, whether PTEN also regulates synapse loss in a neurodegenerative disorder such as frontotemporal lobar degeneration with Tau deposition (FTLD-Tau) has not been explored. Here, we found that pathological Tau promotes early activation of PTEN, which precedes apoptotic caspase-3 cleavage in the rTg4510 mouse model of FTLD-Tau. We further demonstrate increased synaptic and neuronal exposure of the apoptotic signal phosphatidylserine that tags neuronal structures for microglial uptake, thereby linking PTEN activation to synaptic and neuronal structure elimination. By applying pharmacological inhibition of PTEN's protein phosphatase activity, we observed that microglial uptake can be decreased in Tau transgenic mice. Finally, we reveal a dichotomous relationship between PTEN activation and age in FTLD-Tau patients and healthy controls. Together, our findings suggest that in tauopathy, PTEN has a role in the synaptotoxicity of pathological Tau and promotes microglial removal of affected neuronal structures.

Keywords: Microglia; Neurodegeneration; PTEN; Phagocytosis; Synapse; Tau.


Conflict of interest statement

The authors declare no competing interests.

Figures

Fig. 1
Fig. 1
Increased apoptotic hallmarks cleaved caspase-3 and phosphatidylserine exposure in rTg4510 mice. a–c Maximum intensity z-projection images of the hippocampus of 2 and 6 month-old rTg4510 and WT mice probed with the apoptosis marker Cleaved caspase-3 (red), the neuronal marker MAP2 (white) and the nuclear marker DAPI (blue). Quantification of the images reveals a massive increase in neuronal apoptosis and cell loss in rTg4510 mice at 6 months. Scale bars: 20 μm. d Representative images and quantification of WT and rTg4510 primary neurons labeled with the membrane asymmetry probe F2N12S. A higher ratio (pseudo-colored as low-blue to high-white) indicates more membrane symmetry and correlates with the exposure of negatively charged phospholipids including PS on the surface. This provides evidence that there is more PS exposure in rTg4510 neurons. Inset is zoomed-in image of white framed region. Scale bars: 10 μm. e Representative plots and quantification of the flow cytometry analysis of apoptotic PS exposure (p-SIVA+) on viable (Calcein Blue AM+) synaptosomes obtained from 2 and 6 month-old WT and rTg4510 mice. This analysis indicates that when comparing equal fractions of viable synaptosomes, there is a greater proportion of apoptotic synaptosomes in rTg4510 than WT mice. Unpaired t test within the same age group. Data are presented as mean ± SEM, *p < 0.05, **p < 0.01, ***p < 0.001, ****p < 0.0001; b, c two-way ANOVA with Tukey’s multiple comparison test, e, f unpaired t test
Fig. 2
Fig. 2
Increase of complement factor C1q and its association with PSD-95 in rTg4510 mice. a Representative fluorescence images and analysis for C1q (pseudo-colored from low-blue to high-white) from the CA1 region of 2 and 6-month-old rTg4510 and WT mice. The analysis reveals an increase in C1q intensity between 2 and 6 months in rTg4510 mice and an increase between rTg4510 and WT mice at 6 months. b 3D spots rendering of PSD-95 (red), and C1q (green) from (C) following deconvolution. Zoomed-in images with yellow border display colocalization of PSD-95 and C1q in white (circled). Scale bar: 20 μm; zoomed-in image: 5 μm. c Quantification of the number of PSD-95 puncta in the WT and rTg4510 hippocampus, showing a significant loss in PSD-95 occurring in rTg4510 mice at 6 months of age. d Quantification of C1q puncta between WT and rTg4510 mice, indicating a large increase in the total number of C1q puncta in rTg4510 mice. e Quantification of the fraction of total PSD-95 tagged with C1q, indicating that despite a loss of PSD-95, there is a greater fraction of PSD-95 that is associated with C1q. f Analysis of the number of colocalized PSD-95/C1q puncta demonstrating that in rTg4510 mice more PSD-95 is tagged with the “eat-me” signal C1q. Data presented as mean ± SEM, *p < 0.05, **p < 0.01, ***p < 0.001, ****p < 0.0001; a two-way ANOVA with Tukey’s multiple comparison test, c, d, e, f unpaired t test
Fig. 3
Fig. 3
Microglia increasingly engulf neurons and synapses in rTg4150 mice. a Representative fluorescence maximum intensity z-projections for the microglial marker Iba1 (red) and the nuclear marker DAPI (blue) in the CA1 region of 2 and 6 month-old WT and rTg4510 mice. Scale bar: 20 μm. b Quantification of microglia per ROI from a, counting DAPI- and Iba1-positive cells. This analysis provides evidence of microgliosis in rTg4510 mice. c Quantification of microglia area per ROI from a, analyzed by thresholding the Iba1 signal. Together with b this analysis provides evidence of microgliosis in rTg4510 mice. d Representative fluorescence maximum intensity z-projections of the microglial lysosomal marker CD68 (green) and DAPI (blue) in the CA1 region of 2 and 6 month-old WT and rTg4510 mice. Scale bar: 20 μm. e Quantification of the volume of CD68 from (D), measured by surface rendering in Imaris. This analysis demonstrates that microglial lysosome production, a proxy for phagocytic activity, is increased in rTg4510 mice. f Quantification of the average volume of individual CD68 lysosomes from (D), measured by surface rendering in Imaris. g 3D rendering of the postsynaptic marker PSD-95 (red), CD68 (green) and DAPI (blue), with arrowheads indicating engulfment. h Quantification of the volume of PSD-95 engulfed by microglia in the hippocampus of 2 and 6 month-old rTg4510 and WT mice. This analysis provides evidence of microglia engulfment of synaptic structures in rTg4510 mice. Scale bar in composite image: 20 μm; scale bar in zoomed-in images: 5 μm. i Time course quantification of synaptosomal engulfment by microglia using the acidification sensor pHrodo-AM red. Data points at each time segment represent individual animals analyzed in triplicates. This analysis demonstrates that synaptosomes from rTg4510 mice are primed for engulfment by microglia. j Quantification of the area under the curve from i, representative of total engulfment. k 3D rendering of the neuronal marker MAP2 (red), CD68 (green) and DAPI (blue), with arrowheads indicating engulfment. Quantification of MAP2 engulfment by microglia in the hippocampus of 2 and 6 month-old rTg4510 and WT mice. This analysis provides evidence of microglia engulfment of neuronal structures in rTg4510 mice. Scale bar in composite image: 20 μm; scale bar in zoomed-in images: 5 μm. Data presented as mean ± SEM, *p < 0.05, **p < 0.01, ****p < 0.0001; b, c, e, f, h, i and k two-way ANOVA with Tukey’s multiple comparison test, j unpaired t test
Fig. 4
Fig. 4
PTEN levels increase and correlate with pTau in the hippocampus of rTg4510 mice. a Representative fluorescence images for Tau phosphorylated at Tyr18 (pY18 Tau, red), PTEN (green), and DAPI (blue) obtained from 10 μm thick maximum intensity z-projections of the hippocampus (CA1 region) of 2 and 6 month-old Tau P301L transgenic rTg4510 and WT mice. Scale bar: 20 μm. b Quantification of the PTEN mean gray value in the hippocampus of 2 and 6 month-old rTg4510 and WT mice, demonstrating that PTEN levels increase with age in rTg4510 mice. c Quantification of the PTEN mean gray value in pTau- and pTau + areas of 6 month-old rTg4510 mice, indicating enrichment of PTEN in neurons that are accumulating pTau. d Pearson correlation between the PTEN and pY18 Tau mean gray values revealing age-dependency. Data presented as mean ± SEM, *p < 0.05, **p < 0.01, ****p < 0.0001; b two-way ANOVA with Tukey’s multiple comparison test, c unpaired t test, d Pearson correlation
Fig. 5
Fig. 5
Increased PTEN activation in rTg4510 mice, preceding caspase-3 cleavage. a Schematic depicting negative regulation of PTEN activity by phosphorylation. b Representative western blots and quantification of pPTEN (inactive) and total PTEN using extracts from the hippocampus of 2, 4, and 6 month-old WT and rTg4510 mice reveal an increase in total PTEN levels relative to the inactive form at 2 and 4 months. c Representative western blots and quantification of pPTEN (inactive) and total PTEN of synaptosomal lysates from the hippocampus of 2, 4, and 6 month-old WT and rTg4510 mice, revealing an increase in total PTEN relative to the inactive form at 4 and 6 months. Data presented as mean ± SEM, *p < 0.05, **p < 0.01, b, c unpaired t test performed between WT and rTg4510 at each age group independently
Fig. 6
Fig. 6
PTEN inhibition with bpV alters protein phosphatase pathway without reducing Tau levels or phosphorylation. a Representative western blots and quantification of pY397 FAK and total FAK in 6 month-old WT mice 6, 24, and 48 h after injection with bpV or saline control. b Study design of PTEN inhibition with bpV, injected intraperitoneally (i.p.) twice weekly for 5 months (starting at 1 month of age). c Representative western blots and quantification of pPTEN relative to PTEN, pY397 FAK relative to total FAK, and pS473 AKT relative to total AKT in brain lysates from saline- or bpV-treated rTg4510 and WT mice. The quantified ratio is expressed as a percent normalized to the saline-treated WT group. c Representative western blots and quantification of total Tau relative to total protein and pY18, pS404, pS202/T205 and pT231 each relative to total Tau in brain lysates from saline- or bpV-treated rTg4510 and WT mice. The quantified ratio is expressed as a percent normalized to the saline-treated rTg4510 group. Data presented as mean ± SEM, *p < 0.05, a one-way ANOVA with Tukey’s multiple comparison test, b, c two-way ANOVA with Tukey’s multiple comparison test
Fig. 7
Fig. 7
PTEN inhibition prevents microglia mediated cell and synapse loss in rTg4510 mice. a Surface rendering of DAPI from all groups, showing a rescue in cellular density of the cellular layer of the CA1 region of the hippocampus following chronic PTEN inhibition. b Representative western blots and quantification for PSD-95 and total protein in brain lysates from saline- or bpV-treated rTg4510 and WT mice.), revealing increased PSD-95 levels in bpV- compared to saline-treated rTg4510 mice. c 3D renderings of PSD-95 (red), CD68 (green) and DAPI (blue) in the hippocampus of saline- or bpV-treated rTg4510 and WT mice; arrowheads indicate engulfment. Scale bar in composite images: 20 μm; in zoomed-in images: 5 μm. d Quantification of CD68 volume, indicating that there is significantly less CD68 in rTg4510 mice treated with the PTEN inhibitor bpV. e Quantification of PSD-95 engulfed by microglia indicates that the rescue of PSD-95 loss in the bpV-treated group is due to a decrease in microglial engulfment. Data presented as mean ± SEM, *p < 0.05, **p < 0.01, ***p < 0.001, ****p < 0.0001; a, b, d, and e two-way ANOVA with Tukey’s multiple comparison test
Fig. 8
Fig. 8
PTEN activation negatively correlates with age in human FTLD-Tau patients. a Representative western blots of total protein extracts from the frontal cortex of human P301L mutation carriers, sporadic FTLD-Tau patients and healthy controls for pPTEN, PTEN, pS396 Tau, total Tau and Gapdh. b Quantification of PTEN activation (PTEN/pPTEN) from a. c Quantification of PTEN levels relative to Gapdh from a. d Correlation between PTEN/pPTEN and age in healthy control and combined familial and sporadic FTLD-Tau patients, showing a negative relationship between age and PTEN activation in disease patients (r = − 0.7396, *p = 0.0360) and a positive correlation in healthy controls (r = 0.7022, p = 0.0786). One outlier was identified in the FTLD-Tau group and removed from the analysis. e Representative western blots and quantification of inactive pPTEN and total PTEN in total protein lysates from whole brains of 6, 12, 15, and 18 month-old WT and rTg4510 mice, showing that PTEN activation begins at 6 months of age, peaks between 12 and 15 months and is decreased at 18 months relative to WT controls. Data presented as mean ± SEM, *p < 0.05, **p < 0.01; b, c one-way ANOVA with Tukey’s multiple comparison test, d Pearson correlation, e unpaired t tests

References

    1. Arendt KL, Royo M, Fernandez-Monreal M, Knafo S, Petrok CN, Martens JR, et al. PIP3 controls synaptic function by maintaining AMPA receptor clustering at the postsynaptic membrane. Nat Neurosci. 2010;13:36–44. doi: 10.1038/nn.2462. - DOI - PMC - PubMed
    1. Bhaskar K, Hobbs GA, Yen S-H, Lee G. Tyrosine phosphorylation of tau accompanies disease progression in transgenic mouse models of tauopathy. Neuropathol Appl Neurobiol. 2010;36:462–477. doi: 10.1111/j.1365-2990.2010.01103.x. - DOI - PMC - PubMed
    1. Bhaskar K, Yen S-H, Lee G. Disease-related modifications in tau affect the interaction between Fyn and Tau. J Biol Chem. 2005;280:35119–35125. doi: 10.1074/jbc.M505895200. - DOI - PubMed
    1. Bolduc D, Rahdar M, Tu-Sekine B, Sivakumaren SC, Raben D, Amzel LM, et al. Phosphorylation-mediated PTEN conformational closure and deactivation revealed with protein semisynthesis. Elife. 2013;2:e00691. doi: 10.7554/eLife.00691. - DOI - PMC - PubMed
    1. Brelstaff J, Tolkovsky AM, Ghetti B, Goedert M, Spillantini MG. Living neurons with tau filaments aberrantly expose phosphatidylserine and are phagocytosed by microglia. Cell Rep. 2018 doi: 10.1016/j.celrep.2018.07.072. - DOI - PMC - PubMed

Publication types

Substances

LinkOut - more resources