

Incidence and predictors of neonatal mortality among neonates admitted in Amhara regional state referral hospitals, Ethiopia: prospective follow up study
- PMID: 32238144
- PMCID: PMC7110778
- DOI: 10.1186/s12887-020-02031-x
Incidence and predictors of neonatal mortality among neonates admitted in Amhara regional state referral hospitals, Ethiopia: prospective follow up study
Abstract
Background: Globally, about 2.7 million neonates die annually and more than 99% of these deaths happened in developing countries. Although most neonatal deaths are preventable and attempts had been taken to tackle these deaths, an aggregate of 30 neonatal deaths per 1000 live births had been reported in Ethiopia. In this regard, identifying the predictors could be an important step. However, evidence on the incidence and predictors of neonatal mortality has been limited in Ethiopia, in the study area in particular. Even the available studies were limited in scope and were retrospective or cross section in nature. Thus, this study is aimed at assessing the incidence and predictors of neonatal mortality among neonates admitted in Amhara regional state referral hospitals, Ethiopia..
Method: A multi center prospective follow up study was conducted on 612 neonates admitted in Amhara region referral hospitals from July 01 to August 30, 2018. A simple random sampling technique was used to select three of all referral hospitals in the study settings and all neonates admitted in the selected hospitals were included. Data were entered into Epi info version 7.0 and exported to STATA 14.0 for analysis. Cox proportional hazard regression model was fitted to identify predictors of neonatal mortality. Crude and Adjusted hazard ratio with 95% confidence interval was computed and variables' statistical significance was declared based on its AHR with 95% CI and p-value ≤0.05.
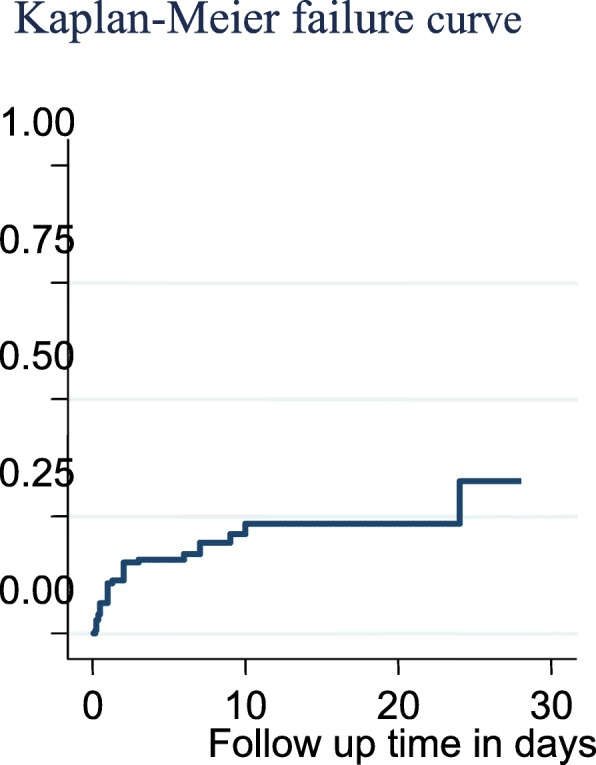
Result: Overall, 144 (18.6%) neonates died with a total person-time of 4177.803 neonate-days which is equivalent to the neonatal mortality rate of 186 per 1000 admitted neonates with 95% CI (157,219). The incidence rate of neonatal mortality was 27 per 1000 admitted neonates with 95%CI (23, 33). Maternal age ≥ 35 years (AHR = 2.60; 95%CI: 1.44, 4.72), mothers unable to read and write (AHR = 1.40; 95%CI: 1.23, 2.44), multiple pregnancy (AHR = 3.96; 95%CI: 2.10, 7.43) and positive maternal HIV status (AHR = 6.57; 95%CI: 2.53, 17.06) were predictors of neonatal mortality.
Conclusion: In this study, the neonatal mortality rate was higher than the national figure. Its most predictors were found to be modifiable. Thus, the stakeholders would better consider the aforementioned predictors to decrease this higher burden.
Keywords: Amhara region; Neonatal death; Neonatal intensive care unit; Neonatal mortality incidence rate; Predictors; Survival of neonates.
Conflict of interest statement
The authors declare that they have no competing interests.
Figures


References
-
- UNICEF, <SOWC-Statistical-Tables-2017.pdf>. http://www.unicef.org/sowc. 2018.
-
- ICF, et al., Ethiopia Demographic and Health Survey.http://www.DHSprogram.com. 2016.
-
- Trana HT, et al. A systematic review of the burden of neonatal mortality and morbidity in the ASEAN region. WHO South-East Asia J Public Health. 2012;1(3):239–248. - PubMed
Publication types
MeSH terms
LinkOut - more resources
Full Text Sources
