Comment
. 2020 Aug 1;80(15):3101-3115.
doi: 10.1158/0008-5472.CAN-19-2959. Epub 2020 Apr 1.

Long-Term Gemcitabine Treatment Reshapes the Pancreatic Tumor Microenvironment and Sensitizes Murine Carcinoma to Combination Immunotherapy

Affiliations
Comment

Long-Term Gemcitabine Treatment Reshapes the Pancreatic Tumor Microenvironment and Sensitizes Murine Carcinoma to Combination Immunotherapy

Daniel R Principe et al. Cancer Res. .

Abstract

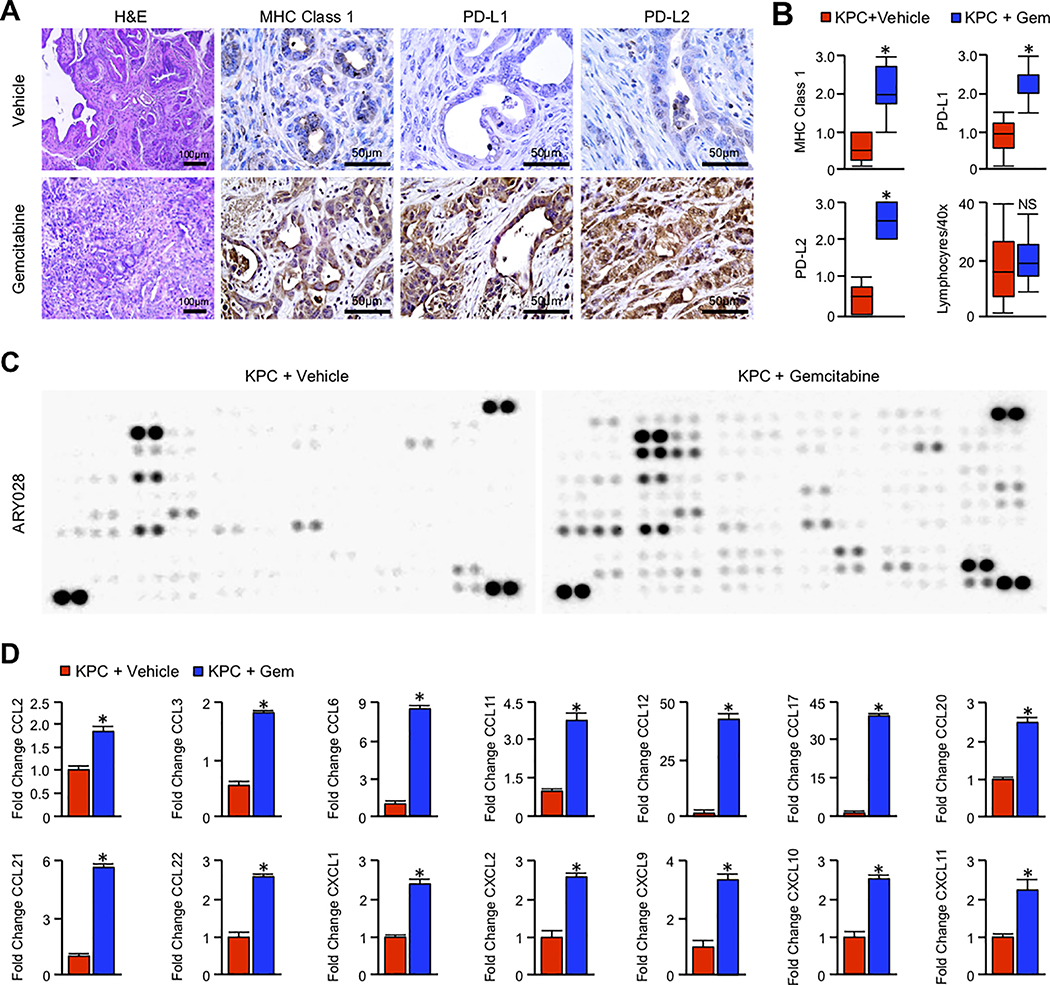
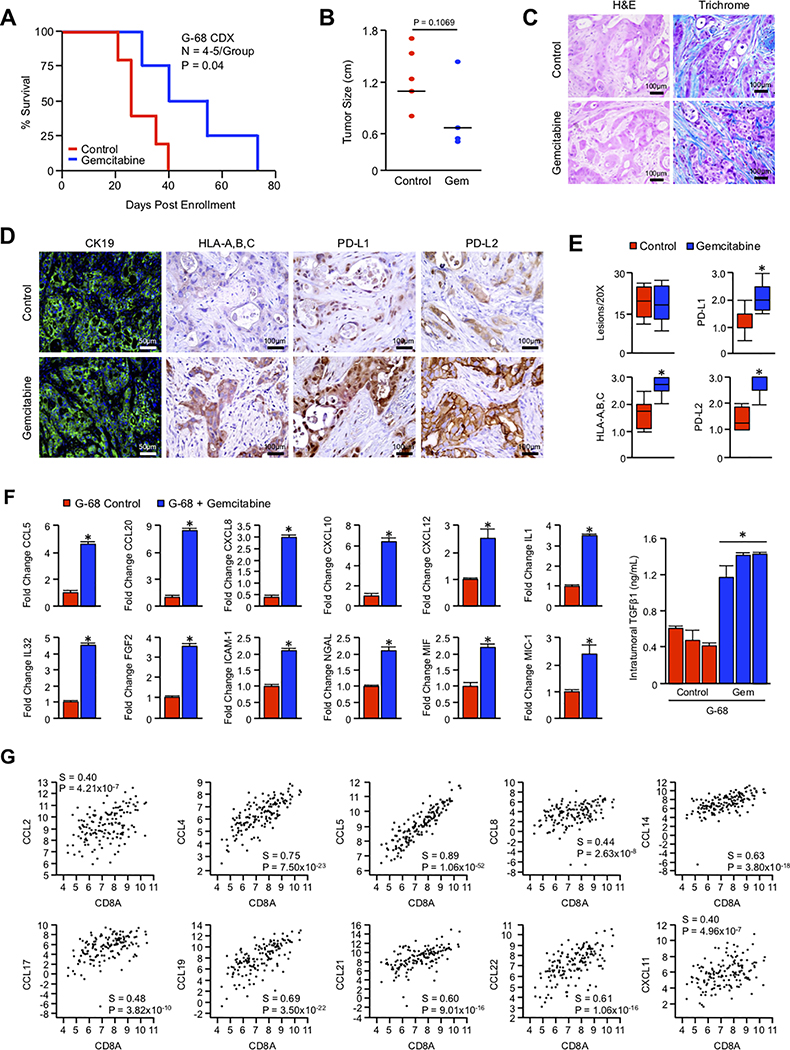
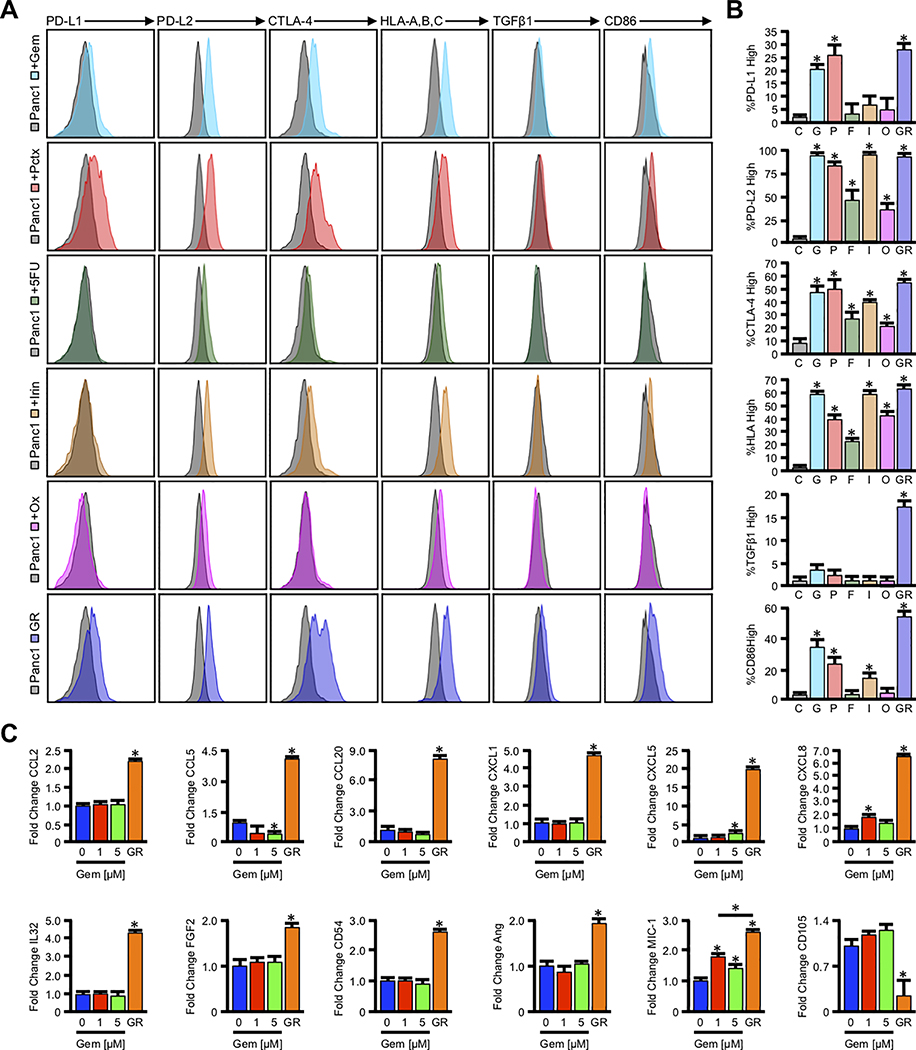
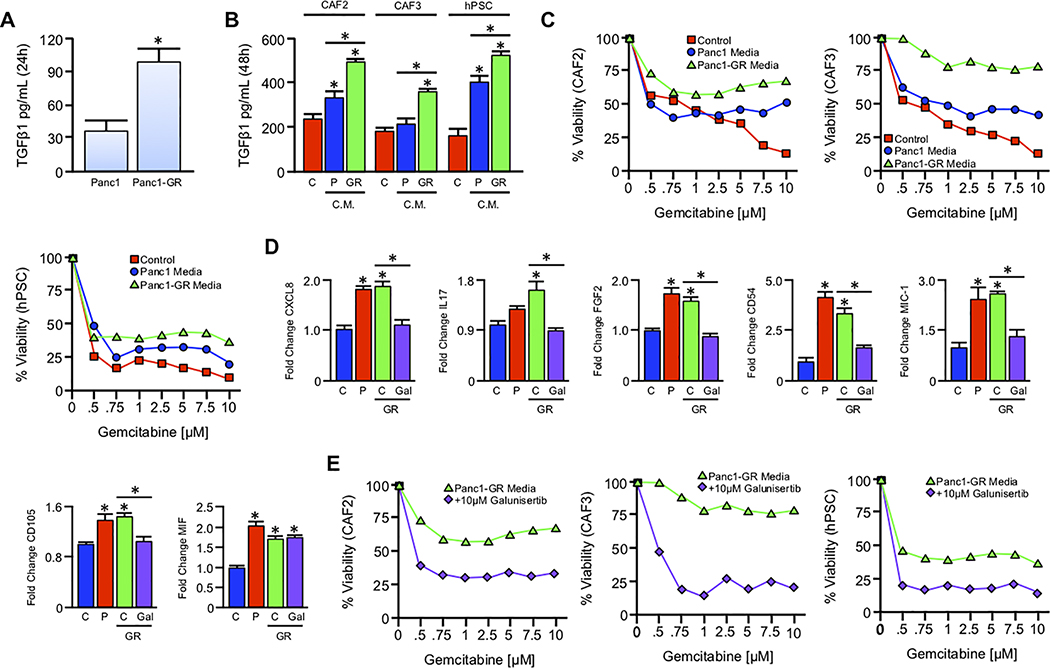
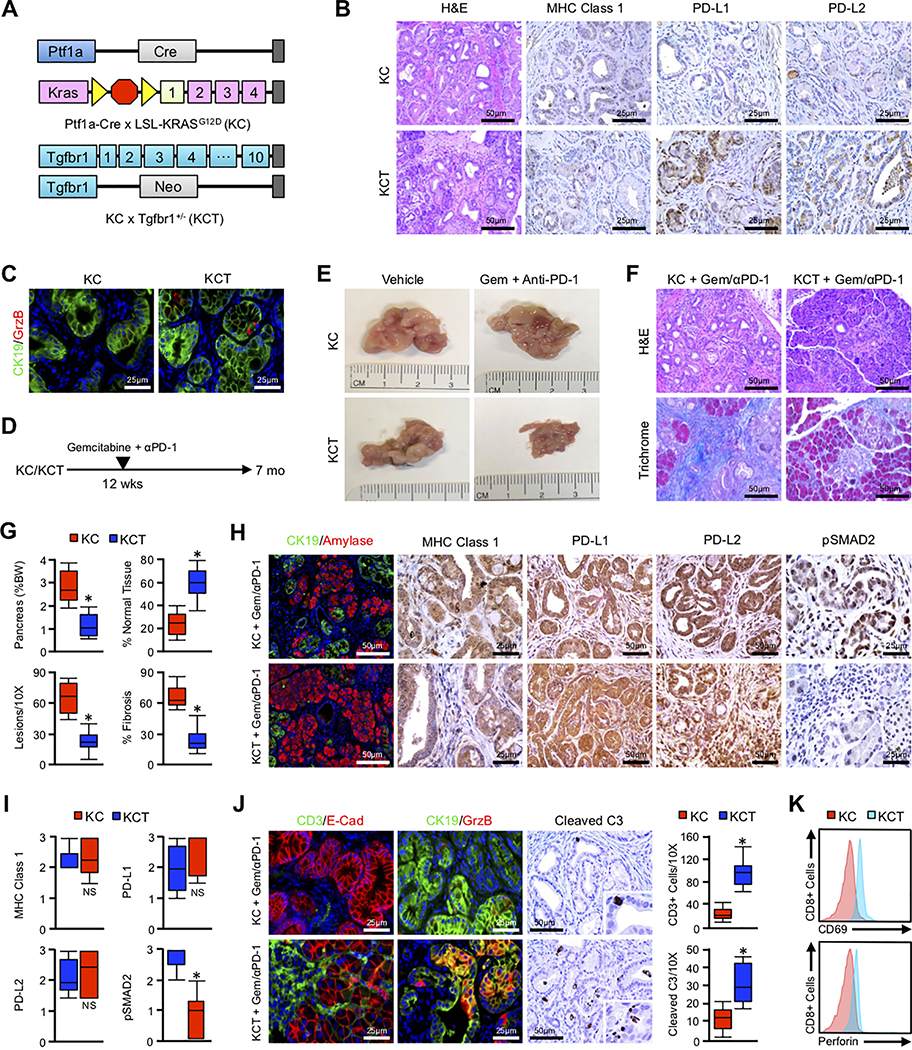
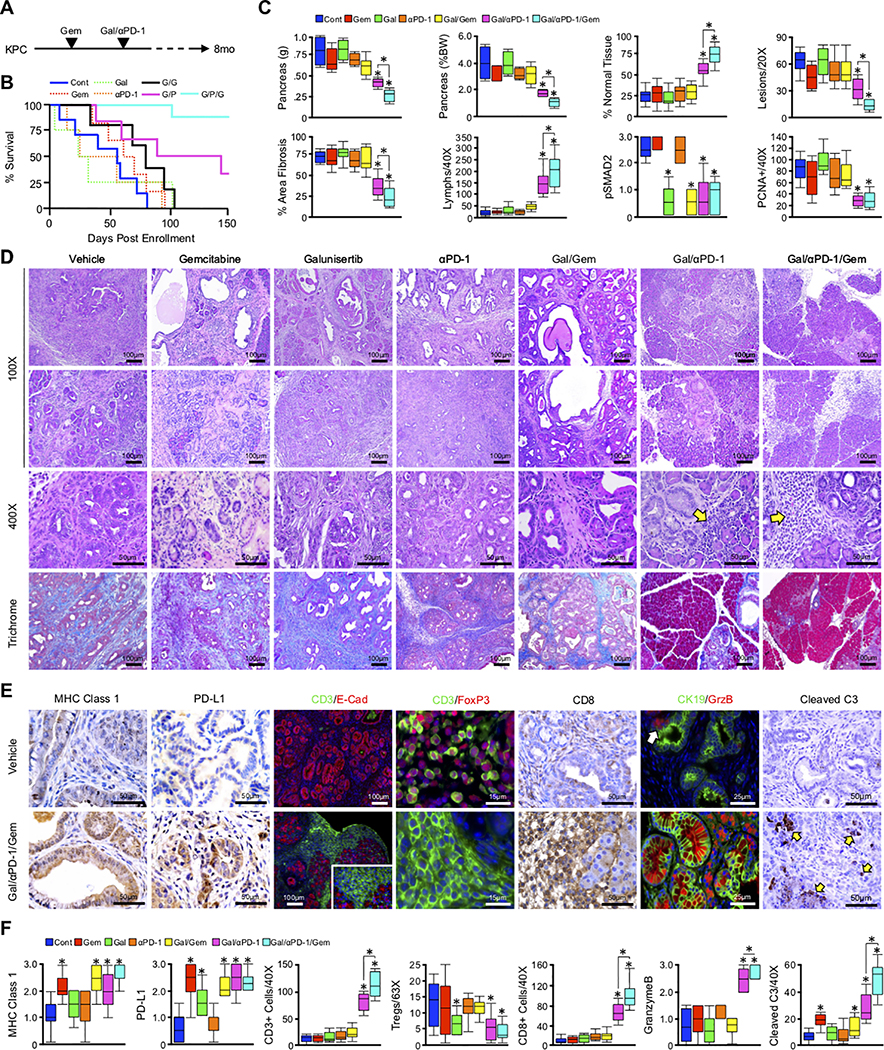
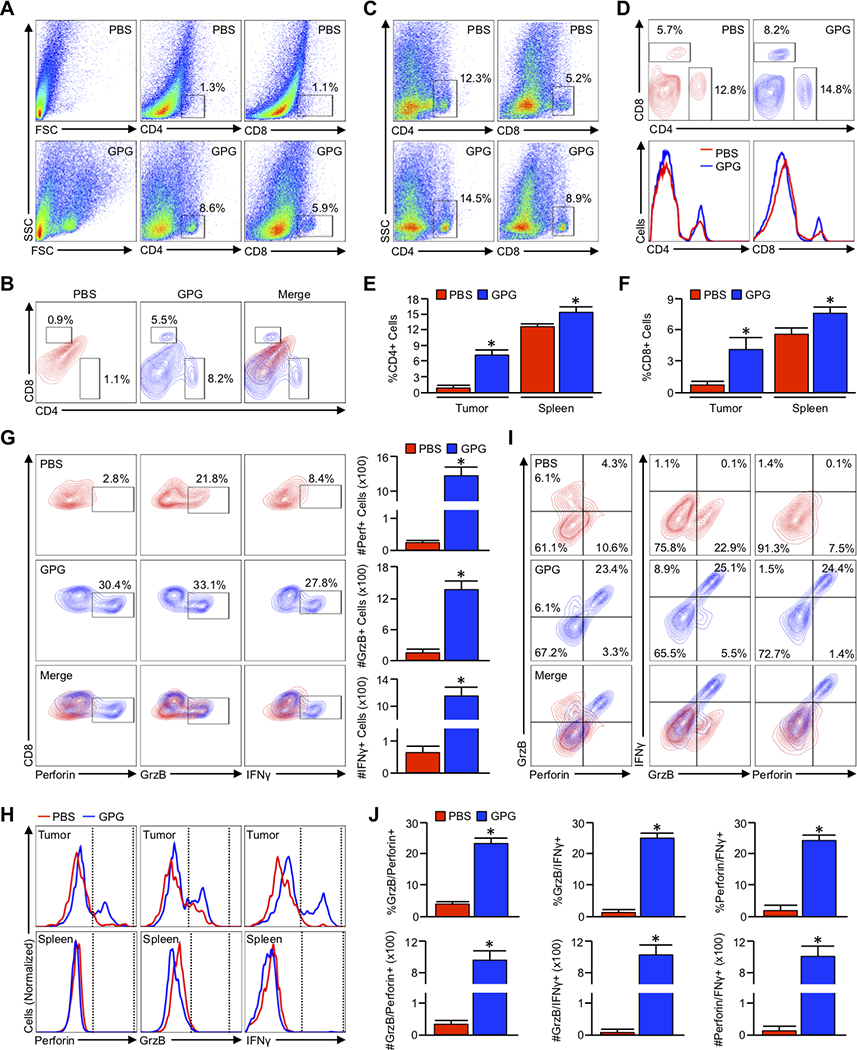
Pancreatic ductal adenocarcinoma (PDAC) is a leading cause of cancer-related death with a median survival time of 6-12 months. Most patients present with disseminated disease and the majority are offered palliative chemotherapy. With no approved treatment modalities for patients who progress on chemotherapy, we explored the effects of long-term gemcitabine administration on the tumor microenvironment to identify potential therapeutic options for chemorefractory PDAC. Using a combination of mouse models, primary cell line-derived xenografts, and established tumor cell lines, we first evaluated chemotherapy-induced alterations in the tumor secretome and immune surface proteins by high throughput proteomic arrays. In addition to enhancing antigen presentation and immune checkpoint expression, gemcitabine consistently increased the synthesis of CCL/CXCL chemokines and TGFβ-associated signals. These secreted factors altered the composition of the tumor stroma, conferring gemcitabine resistance to cancer-associated fibroblasts in vitro and further enhancing TGFβ1 biosynthesis. Combined gemcitabine and anti-PD-1 treatment in transgenic models of murine PDAC failed to alter disease course unless mice also underwent genetic or pharmacologic ablation of TGFβ signaling. In the setting of TGFβ signaling deficiency, gemcitabine and anti-PD-1 led to a robust CD8+ T-cell response and decrease in tumor burden, markedly enhancing overall survival. These results suggest that gemcitabine successfully primes PDAC tumors for immune checkpoint inhibition by enhancing antigen presentation only following disruption of the immunosuppressive cytokine barrier. Given the current lack of third-line treatment options, this approach warrants consideration in the clinical management of gemcitabine-refractory PDAC. SIGNIFICANCE: These data suggest that long-term treatment with gemcitabine leads to extensive reprogramming of the pancreatic tumor microenvironment and that patients who progress on gemcitabine-based regimens may benefit from multidrug immunotherapy.See related commentary by Carpenter et al., p. 3070 GRAPHICAL ABSTRACT: http://cancerres.aacrjournals.org/content/canres/80/15/3101/F1.large.jpg.


Conflict of interest statement

Conflict of Interest Disclosure: The authors have no conflicts to disclose.

Figures

Figure 1.
Figure 1.. Long-term Gemcitabine treatment alters the immune landscape of murine PDAC
(A) Pdx1-Cre x LSL-KrasG12D x LSL-TP53R172H (KPC) mice were generated as a model of advanced PDAC. Starting at 90 days (~13 weeks) of age, mice were administered twice-weekly intraperitoneal injections of either PBS vehicle or 100mg/kg Gemcitabine. Pancreas tissues were collected when the animals were moribund. Tissues from vehicle and Gemcitabine treated mice were then stained with H&E or by immunohistochemistry for MHC Class 1, PD-L1, or PD-L2. (B) Tissue sections were evaluated by three blinded investigators. For IHC images, slides were assigned a score by each investigator from 0–3+ based on staining intensity, and composite values displayed as a box plot. For tumor infiltrating lymphocytes, each investigator quantified four H&E stained 40X fields per animal. These values were averaged and represented by box plot (*p < 0.05, N=4/group). (C) Tissues were homogenized and 200μg of tumor lysate evaluated by a high throughput proteome profiler array (ARY028). Representative blots from each group are displayed above. (D) Pixel density was evaluated using ImageJ, and samples normalized to the mean intensity of the reference spots for each blot minus the background density. Composite normalized values for Gemcitabine treated mice were divided by those for vehicle treated mice, and are presented as fold change (*p < 0.05).
Figure 2.
Figure 2.. Long-term Gemcitabine treatment similarly alters the immune profile of primary cell line-derived xenografts
(A-B) G-68 human cells were injected subcutaneously into NSG mice, and once tumors reached 100–200mm3, animals were treated with either a saline vehicle or 40mg/kg Gemcitabine. Animals were sacrificed when moribund or when tumors ulcerated. Survival in days post enrollment is displayed via the Kaplan-Meier method, and tumor size in diameter (N=4–5/group). (C,D) Tissues from vehicle and Gemcitabine treated mice were then stained with either H&E or by immunohistochemistry for CK19, HLA-A,B,C, PD-L1, or PD-L2. (E) Tissue sections were evaluated by three blinded investigators. For IHC images, CK19+ lesions were quantified per 20X field, or slides were assigned a score by each investigator from 0–3+ based on staining intensity, and composite values displayed as a box plot. (F) Tissues from control and Gemcitabine treated tumors were lysed, and 200μg of total protein was evaluated by a high throughput proteome profiler array (ARY022B). Pixel density was evaluated using ImageJ, and samples normalized to the mean intensity of the reference spots for each blot minus the background density. Composite normalized values for all treated tumors were divided by those for control tumors, and are presented as fold change plus standard deviation (*p < 0.05). Using the same lysates, 20μg of total protein from control and Gemcitabine treated mice was also subjected to TGFβ1 ELISA and are similarly presented as fold change plus standard deviation (*p < 0.05). (G) Using the TCGA genomic databases of pancreatic cancer patients (N=186), the relationship between mRNA expression of individual genes was plotted with that of the cytotoxic surrogate CD8A. All mRNA expression values are plotted in log scale and are displayed with the associated P and Spearmen (S) coefficient values.
Figure 3.
Figure 3.. Cytotoxic chemotherapy alters tumor cell immunogenicity in vitro
(A) Panc1 cells were incubated with the known IC50 of the first line chemotherapy agents Gemcitabine (Gem, 1μM), Paclitaxel (Pct, IC50 = 100nM), 5-Fluorouracil (5-FU, 2.5μM), Irinotecan (Irin, 2.5μM), and Oxaliplatin (Ox, 2.5μM), after which the expression of both surface and intracellular immmunomodulatory proteins was evaluated by flow cytometry. (B) Using unstained Panc1 cells, we identified the number of cells positive for each antigen in vehicle treated control (C) cells. We then determined the percent of the parent population for Gemcitabine (G), Paclitaxel (P), 5-Fluorouracil (F), Irinotecan (I), and Oxaliplatin (O) treated Panc1 cells, or Panc1-GR (GR) cells with expression above the geometric mean for control cells (*p < 0.05). (C) Panc1 cells were incubated with 0, 1, or 5μM Gemcitabine over a 48-hour period, and Panc1-GR cells were grown in 10μM Gemcitabine for several passages. Cells were incubated with a protein transport inhibitor for one hour, lysed, and 200μg of total cell lysate was evaluated by a high throughput proteome profiler array (ARY022B). Pixel density was evaluated using ImageJ, and samples normalized to the mean intensity of the reference spots for each blot minus the background density. Composite normalized values for all experimental groups were divided by those for untreated Panc1 cells, and are presented as fold change plus standard deviation (*p < 0.05).
Figure 4.
Figure 4.. Gemcitabine-resistant tumor cells confer drug resistance to stromal cells via paracrine TGFβ signaling
(A) An equal number of Panc1 cells and Panc1-GR cells were seeded into 6-well plates and grown in serum free media. After 24 hours, culture media was collected, filtered, and subjected to TGFβ1 ELISA (*p < 0.05). (B) Serum free media was conditioned in either Panc1 or Panc1-GR cells for 24 hours as described and sterile filtered. Media was supplemented with 10% FBS, and transferred to an equal number of CAF2, CAF3, or hPSC stromal cell lines. After 48 hours, control (C), Panc1 conditioned (P), and Panc1-GR (GR) conditioned media was collected and re-evaluated for TGFβ by ELISA (*p < 0.05). (C) CAF2, CAF3, and hPSC cells were incubated with increasing concentrations of Gemcitabine delivered in either control media (red), Panc1 conditioned media (blue), or Panc1-GR conditioned media (GR, green). After 72 hours cell viability was evaluated by MTT assay. (D) hPSC cells were grown in either control (C), Panc1 conditioned (P), Panc1-GR (GR) conditioned media, or GR media with 10μM of the TGFBR1-inhbitor Galunisertib. After 48 hours, cells were incubated with a protein transport inhibitor for one hour, lysed, and 200μg of total cell lysate was evaluated by a high throughput proteome profiler array (ARY022B). Pixel density was evaluated using ImageJ, and samples normalized to the mean intensity of the reference spots for each blot minus the background density. Mean normalized values for experimental groups were divided by those for untreated hPSC cells, and are presented as fold change plus standard deviation (*p < 0.05). (E) CAF2, CAF3, and hPSC cells were again incubated with increasing concentrations of Gemcitabine delivered in either Panc1-GR conditioned media (green) or Panc1-GR conditioned media supplemented with 10μM of the TGFBR1-inhbitor Galunisertib (purple). After 72 hours cell viability was evaluated by MTT assay.
Figure 5.
Figure 5.. TGFβ functions as a cytokine barrier impeding the efficacy of combined Gemcitabine and anti-PD-1
(A-C) Ptf1a-Cre x LSL-KrasG12D (KC) mice were bred to generate a model of conditional expression of oncogenic KRASG12D. KC mice were also crossed to the Tgfbr1 haplo-insufficient animals to generate KC/Tgfbr1+/− (KCT). Tissues were collected at six months and stained with H&E, or via immunohistochemistry for MHC Class 1, PD-L1, or PD-L2 (N=6/group). (C) The anti-tumor immune response of KC and KCT mice was evaluated by dual staining for the duct cell marker CK19 (green) and the cytotoxic surrogate GranzymeB (GrzB, red). (D) KC and KCT mice were allowed to reach 12 weeks of age, and randomized at a 50:50 male to female ratio into one of two groups. Mice were either administered intraperitoneal injection every other day of either a vehicle control (Vehicle, N=3/group) or 200μg of an anti-PD-1 neutralizing antibody (Anti-PD-1) with twice-weekly doses of 100mg/kg Gemcitabine (Gem + Anti-PD-1, N=3–7/group). (E) The pancreas was collected at the conclusion of the study (100 days post enrollment), and gross changes in pancreas gland structure evaluated. Representative images from each group are displayed. (F,G) The pancreas from control and drug treated mice was stained with either H&E or Masson’s Trichrome allowing for evaluation of changes in histopathology and fibrosis respectively. Tissue sections were quantified by three blinded investigators, averaged, and displayed as box plot. Additionally, the pancreas was weighed at the time of tissue collection, normalized to bodyweight, and displayed accordingly. (H,I) Tissue sections were also stained via immunohistochemistry for the duct marker CK19 and amylase, MHC Class 1, PD-L1, PD-L2, and the TGFβ surrogate pSMAD2 (N=3–7/group). Tissue sections were quantified as described and displayed as box plot (*p < 0.05, NS = non-significant where p > 0.05). (J) The pancreas from control and drug-treated mice were dual-stained for the T-cell marker CD3 and the epithelial surrogate E-Cadherin (E-Cad), for the duct cell marker CK19 and the cytotoxic surrogate GranzymeB (GrzB), or for the apoptotic surrogate Cleaved Caspase 3 (Cleaved C3). Tissue sections were quantified as described and displayed as box plot (p < 0.05). (K) Mesenteric lymph nodes from drug treated mice were collected, and evaluated for CD8+CD69+ or CD8+Perforin+ cells.
Figure 6.
Figure 6.. Gemcitabine potentiates dual-agent immunotherapy in advanced PDAC
(A) Pdx1-Cre x LSL-KrasG12D x LSL-TP53R172H (KPC) mice were used as a model of aggressive PDAC. At 90 days (~13 weeks) of age, animals were randomized at a 50:50 male to female ratio into one of seven groups. Mice were administered an intraperitoneal injection of either a saline vehicle every other day (N=7), 100mg/kg Gemcitabine twice per week (N=7), 75mg/kg of the TGFβ signaling inhibitor Galunisertib every other day (N=4), staggered doses of Gemcitabine and Galunisertib (N=5), a fixed 200μg dose of anti-PD-1 twice-weekly (N=4), staggered doses of Galunisertib and anti-PD-1, or twice-weekly Gemcitabine starting at 90 days (N=6), with the addition of Galunisertib and anti-PD-1 two weeks later (N=8). The pancreata were then collected either when the animals were moribund or at the conclusion of the study (8 months). (B) Kaplan-Meier curve indicating survival for mice across all six groups in days post enrollment (N=4–8/group). (C,D) After tissue collection, gross changes in pancreas gland structure were evaluated, including gland weight, which was also normalized to each animal’s body weight, and results displayed as box plot. Tissues were also stained with H&E or Masson’s Trichrome, and the relative percentage of normal tissue, number of lesions per high power field, percent area fibrosis, and number of tumor-infiltrating lymphocytes quantified by three blinded investigators and displayed as box plot. Sections were also stained via immunohistochemistry for the TGFβ effector pSMAD2 or the proliferation surrogate PCNA and quantified/displayed as described (*p < 0.05). (E,F) The pancreas from control and drug-treated mice were stained by immunohistochemistry for MHC Class 1, PD-L1, the T-cell marker CD3 and the epithelial surrogate E-Cadherin (E-Cad), CD3 and regulatory T-cell (Treg) marker FoxP3, the duct cell marker CK19 and the cytotoxic surrogate GranzymeB (GrzB), or for the apoptotic surrogate Cleaved Caspase 3 (Cleaved C3). Tissue sections were quantified and displayed as described (*p < 0.05).
Figure 7.
Figure 7.. Combining Gemcitabine, Galunisertib, and anti-PD-1 leads to intratumoral accumulation and activation of cytotoxic T lymphocytes
(A,B) Pdx1-Cre x LSL-KrasG12D x LSL-TP53R172H (KPC) mice were again used as a model of aggressive PDAC. At 90 days (~13 weeks) of age, mice were administered an intraperitoneal injection every other day of either saline (PBS) or twice-weekly Gemcitabine starting at 90 days with the addition of Galunisertib and anti-PD-1 two weeks later (G/P/G). The pancreas was then collected either when the animals were moribund or at the conclusion of the study (150 days post enrollment) and analyzed by flow cytometry for tumor infiltrating CD4+ and CD8+ T-cells, respectively (N=3/group). (C,D) The spleens from both PBS and GPG-treated mice were collected and analyzed as described for CD4+ and CD8+ T-cells. (E,F) The relative percent of total cells positive for CD4 and CD8 from both the tumor and spleen of PBS and GPG treated mice (*p < 0.05). (G) Tumor infiltrating cells were gated based on the CD8 and CD4 staining shown above, and CD8+ events isolated and analyzed for expression of cytotoxic T-cell activation markers Perforin (Perf), GranzymeB (GrzB), and Interferon γ (IFNγ). The percent of CD8+ cells positive for each activation marker was normalized to the total number of CD8+ T-cells per 100,000 events, and displayed to the right of the flow cytometry plots (*p < 0.05). (H) The modal expression of Perforin, GranzymeB, and IFNγ within both intratumoral and splenic CD8+ T-cells are displayed as a histogram plot. (I) CD8+ cells were gated as previously, and analyzed for the simultaneous expression of the aforementioned T-cell activation markers including GranzymeB and Perforin, GranzymeB, and IFNγ, as well as Perforin and IFNγ. (J) Using the described gating, the relative percent of GranzymeB+Perforin+, and GranzymeB+IFNγ+, and Perforin+IFNγ+ are plotted, as are the absolute number of each per 100,000 events (*p < 0.05).

Comment in

Comment on

References

    1. McGuigan A, et al. (2018) Pancreatic cancer: A review of clinical diagnosis, epidemiology, treatment and outcomes. World J Gastroenterol 24(43):4846–4861. - PMC - PubMed
    1. Wang Z, et al. (2011) Pancreatic cancer: understanding and overcoming chemoresistance. Nat Rev Gastroenterol Hepatol 8(1):27–33. - PubMed
    1. Moore M (1996) Activity of gemcitabine in patients with advanced pancreatic carcinoma. A review. Cancer 78(3 Suppl):633–638. - PubMed
    1. Carmichael J, et al. (1996) Phase II study of gemcitabine in patients with advanced pancreatic cancer. Br J Cancer 73(1):101–105. - PMC - PubMed
    1. Casper ES, et al. (1994) Phase II trial of gemcitabine (2,2’-difluorodeoxycytidine) in patients with adenocarcinoma of the pancreas. Invest New Drugs 12(1):29–34. - PubMed

Publication types