. 2020 Jul;10(7):942-963.
doi: 10.1158/2159-8290.CD-19-1030. Epub 2020 Apr 1.

Infant High-Grade Gliomas Comprise Multiple Subgroups Characterized by Novel Targetable Gene Fusions and Favorable Outcomes

Matthew Clarke #  1 Alan Mackay #  1 Britta Ismer #  2   3   4 Jessica C Pickles  5 Ruth G Tatevossian  6 Scott Newman  7 Tejus A Bale  8 Iris Stoler  9 Elisa Izquierdo  1 Sara Temelso  1 Diana M Carvalho  1 Valeria Molinari  1 Anna Burford  1 Louise Howell  1 Alex Virasami  5 Amy R Fairchild  5 Aimee Avery  5 Jane Chalker  5 Mark Kristiansen  5 Kelly Haupfear  6 James D Dalton  6 Wilda Orisme  6 Ji Wen  6 Michael Hubank  10 Kathreena M Kurian  11 Catherine Rowe  11 Mellissa Maybury  12   13   14 Stephen Crosier  15 Jeffrey Knipstein  16 Ulrich Schüller  17   18 Uwe Kordes  18 David E Kram  19 Matija Snuderl  20 Leslie Bridges  21 Andrew J Martin  22 Lawrence J Doey  23 Safa Al-Sarraj  23 Christopher Chandler  24 Bassel Zebian  24 Claire Cairns  24 Rachael Natrajan  25 Jessica K R Boult  26 Simon P Robinson  26 Martin Sill  2 Ira J Dunkel  27 Stephen W Gilheeney  27 Marc K Rosenblum  8 Debbie Hughes  10 Paula Z Proszek  10 Tobey J Macdonald  28 Matthias Preusser  29 Christine Haberler  29   30 Irene Slavc  31 Roger Packer  32 Ho-Keung Ng  33 Shani Caspi  34 Mara Popović  35 Barbara Faganel Kotnik  36 Matthew D Wood  37 Lissa Baird  38 Monika Ashok Davare  39 David A Solomon  40   41 Thale Kristin Olsen  42 Petter Brandal  43 Michael Farrell  44 Jane B Cryan  44 Michael Capra  45 Michael Karremann  46 Jens Schittenhelm  47 Martin U Schuhmann  48 Martin Ebinger  49 Winand N M Dinjens  50 Kornelius Kerl  51 Simone Hettmer  52 Torsten Pietsch  53 Felipe Andreiuolo  53 Pablo Hernáiz Driever  54 Andrey Korshunov  55 Lotte Hiddingh  2 Barbara C Worst  2   4   56 Dominik Sturm  2   4   56 Marc Zuckermann  2   4 Olaf Witt  2   4   56 Tabitha Bloom  57 Clare Mitchell  57 Evelina Miele  58 Giovanna Stefania Colafati  59 Francesca Diomedi-Camassei  60 Simon Bailey  15 Andrew S Moore  12   13   14 Timothy E G Hassall  13   61   62 Stephen P Lowis  11 Maria Tsoli  63   64 Mark J Cowley  63   64 David S Ziegler  63   64 Matthias A Karajannis  27 Kristian Aquilina  65 Darren R Hargrave  66 Fernando Carceller  67   68 Lynley V Marshall  67   68 Andreas von Deimling  55   69 Christof M Kramm  70 Stefan M Pfister  2   4   56 Felix Sahm  54   69 Suzanne J Baker  71 Angela Mastronuzzi  72 Andrea Carai  73 Maria Vinci  58 David Capper  9   74 Sergey Popov  1   75 David W Ellison  76 Thomas S Jacques  77 David T W Jones  78   4 Chris Jones  79
Affiliations

Infant High-Grade Gliomas Comprise Multiple Subgroups Characterized by Novel Targetable Gene Fusions and Favorable Outcomes

Matthew Clarke et al. Cancer Discov. 2020 Jul.

Abstract

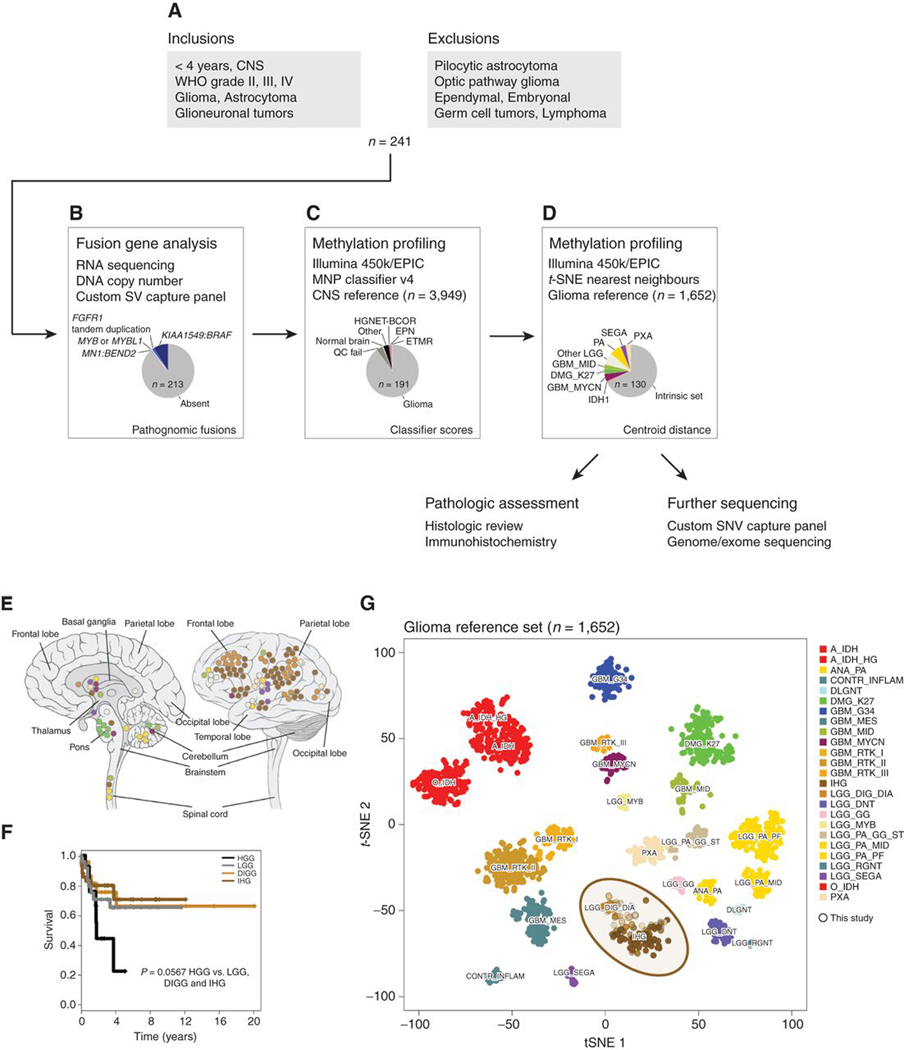
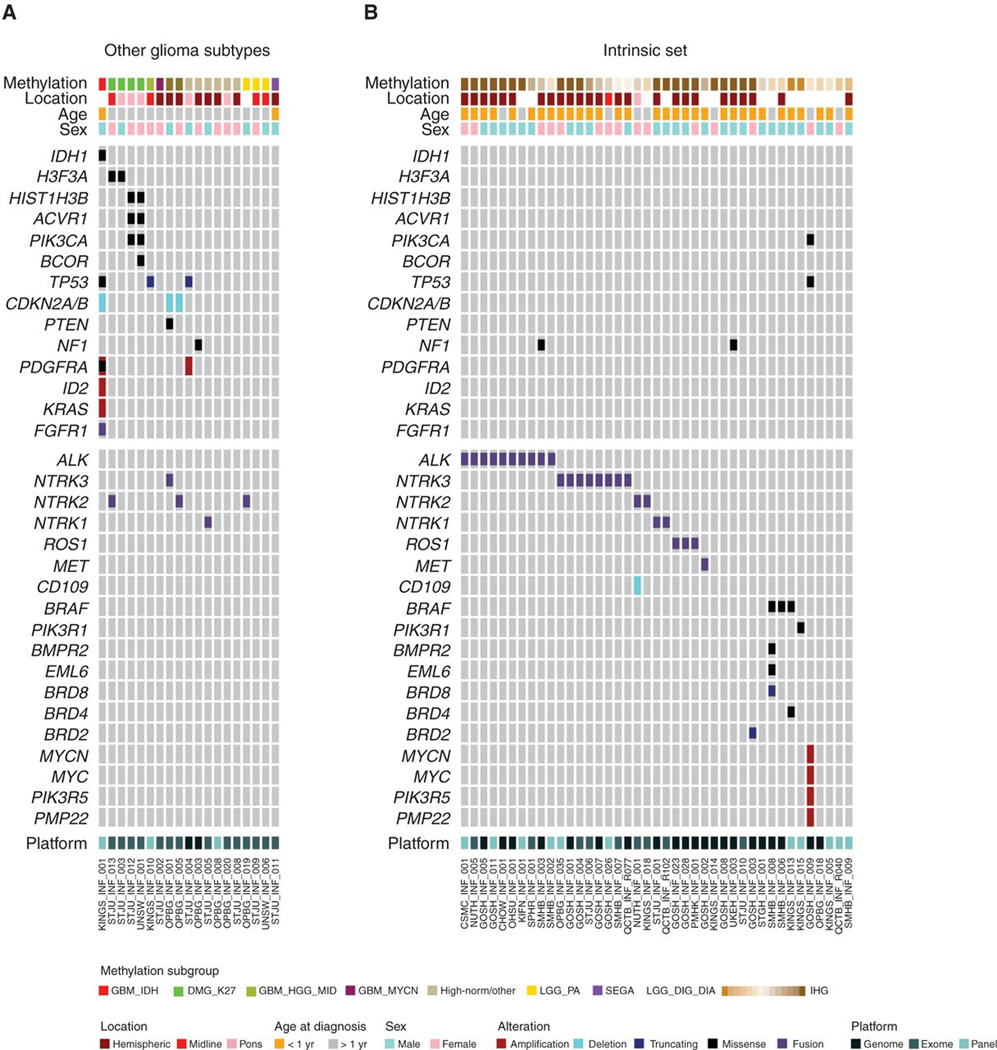
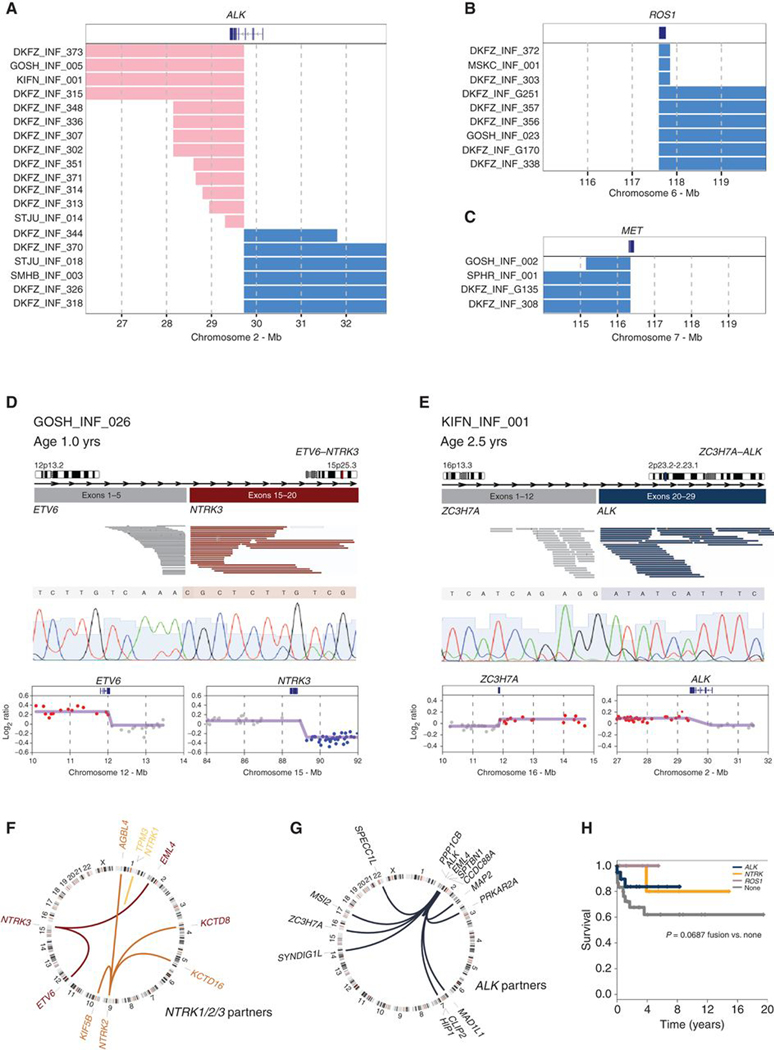
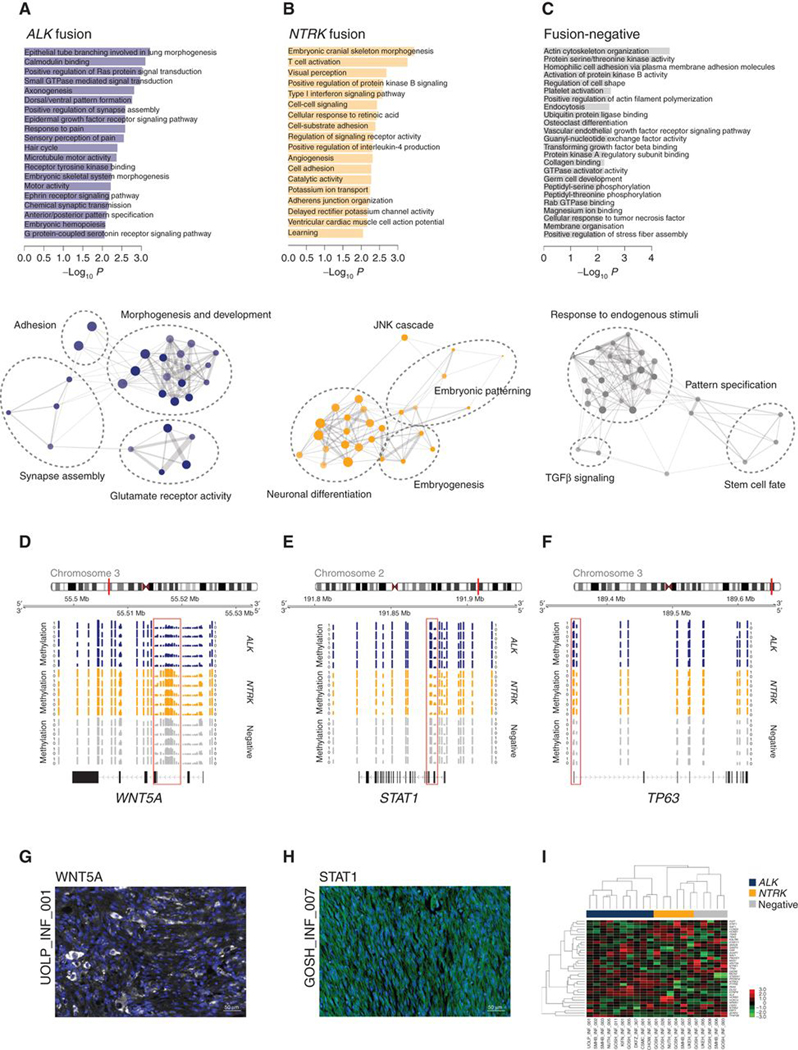
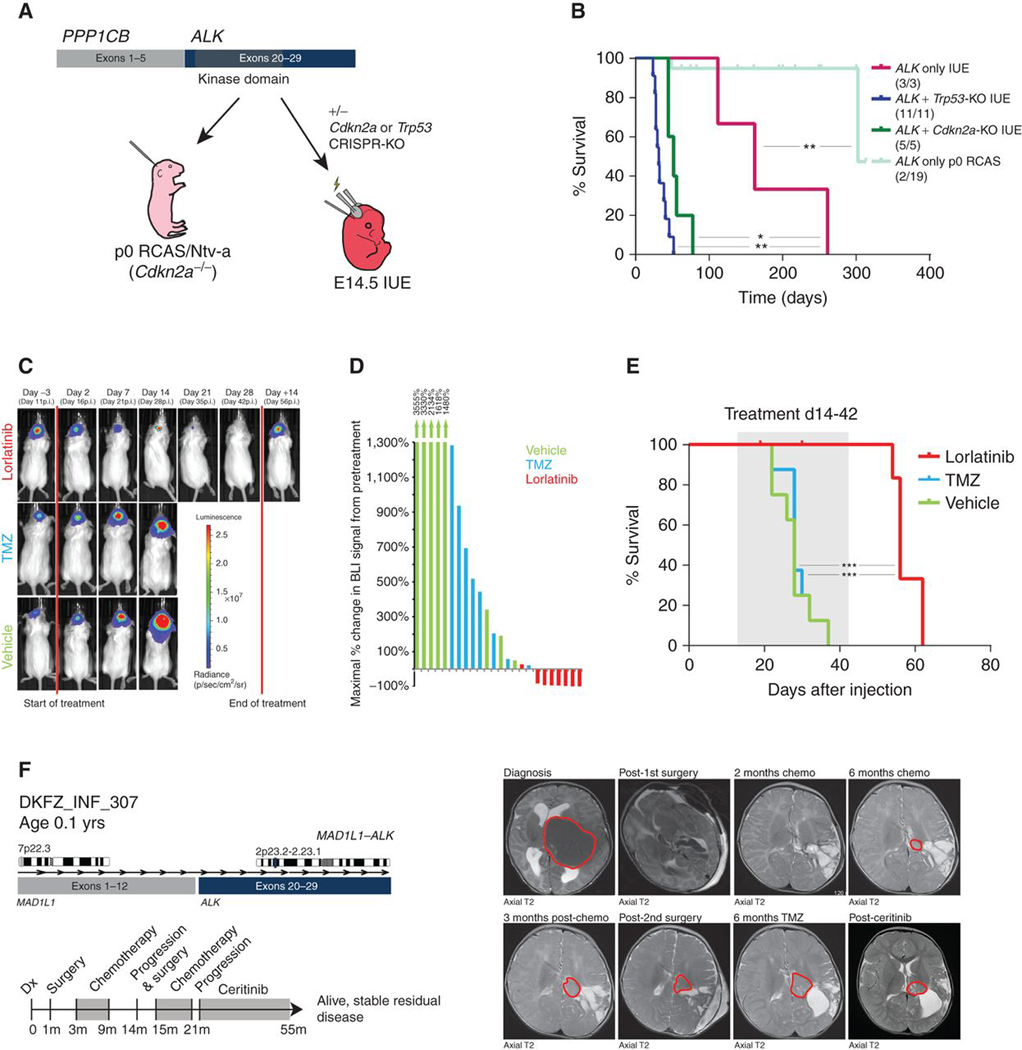
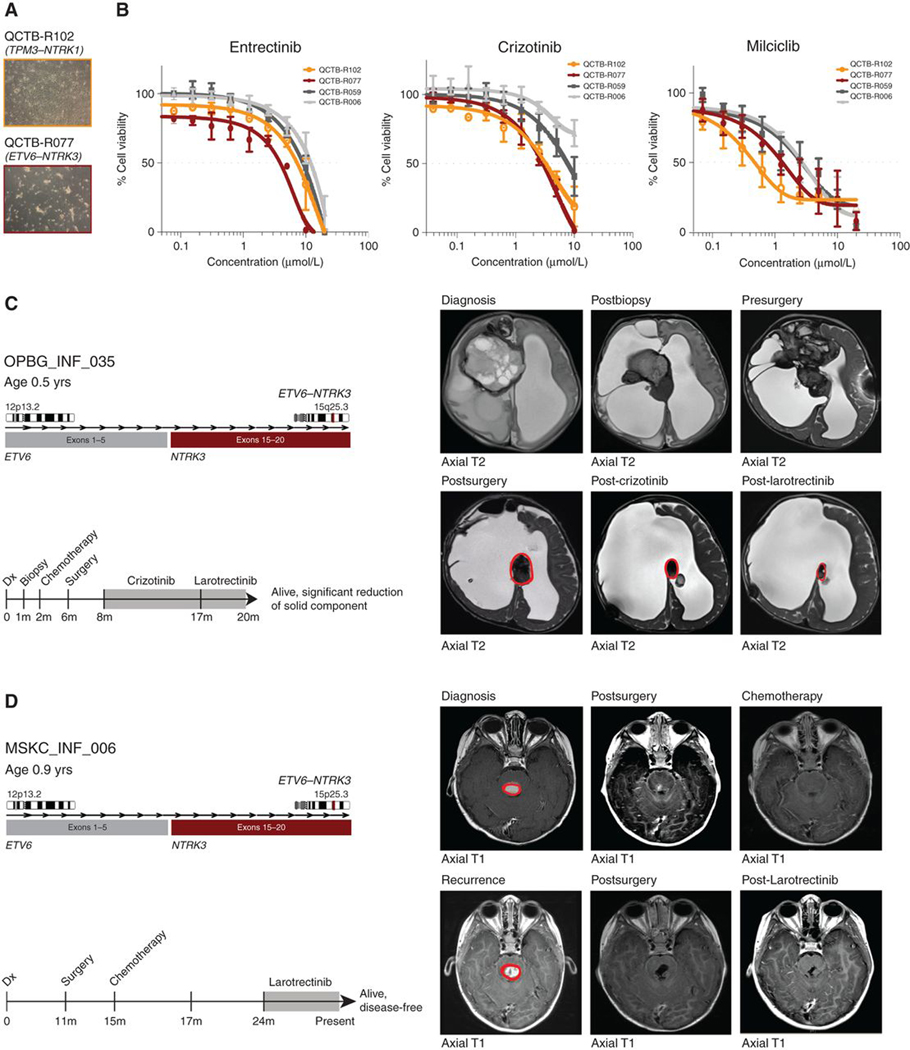
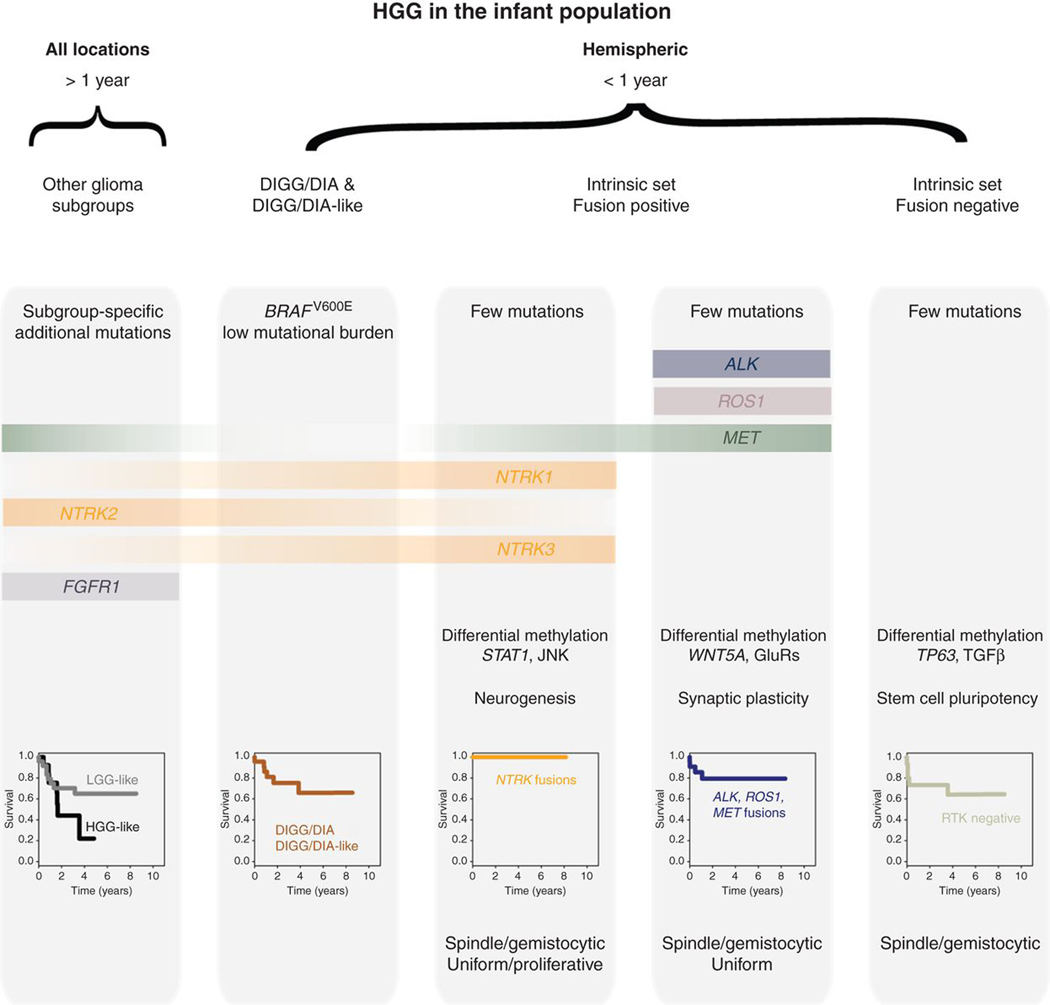
Infant high-grade gliomas appear clinically distinct from their counterparts in older children, indicating that histopathologic grading may not accurately reflect the biology of these tumors. We have collected 241 cases under 4 years of age, and carried out histologic review, methylation profiling, and custom panel, genome, or exome sequencing. After excluding tumors representing other established entities or subgroups, we identified 130 cases to be part of an "intrinsic" spectrum of disease specific to the infant population. These included those with targetable MAPK alterations, and a large proportion of remaining cases harboring gene fusions targeting ALK (n = 31), NTRK1/2/3 (n = 21), ROS1 (n = 9), and MET (n = 4) as their driving alterations, with evidence of efficacy of targeted agents in the clinic. These data strongly support the concept that infant gliomas require a change in diagnostic practice and management. SIGNIFICANCE: Infant high-grade gliomas in the cerebral hemispheres comprise novel subgroups, with a prevalence of ALK, NTRK1/2/3, ROS1, or MET gene fusions. Kinase fusion-positive tumors have better outcome and respond to targeted therapy clinically. Other subgroups have poor outcome, with fusion-negative cases possibly representing an epigenetically driven pluripotent stem cell phenotype.See related commentary by Szulzewsky and Cimino, p. 904.This article is highlighted in the In This Issue feature, p. 890.


Conflict of interest statement

Disclosure of Potential Conflicts of Interest

No potential conflicts of interest were disclosed by the other authors.

Figures

Figure 1.
Figure 1.
Defining an intrinsic set of infant gliomas. A, Flow diagram providing an overview of the inclusion and exclusion criteria for the assembled cohort of 241 samples from patients younger than 4 years. B, Fusion gene analysis by a variety of means allowed for the identification of 28 fusions marking clearly defined entities that were subsequently excluded from further analysis. C, Methylation array profiling and analysis by the Heidelberg classifier excluded a further 12 cases closely resembling non-glioma entities or failing quality control (n = 9). D, t-statistic based stochastic neighbor embedding (t-SNE) projection of the remaining cases highlighted 61 samples which clustered with previously reported high or low grade glioma subtypes, leaving an intrinsic set of 130 infant gliomas for further characterization by more histopathological assessment and in-depth sequencing. E, Anatomic location of infant gliomas after exclusion of pathognomonic fusions and non-glioma entities by methylation profiling (n = 130). Left, sagittal section showing internal structures; right, external view highlighting cerebral lobes. Each circle represents a single case and is colored by the glioma subgroup it most closely clusters with, defined by the key below. F, Kaplan–Meier plot of overall survival of cases separated by methylation subgroups DIGG (desmoplastic infantile ganglioglioma/astrocytoma), IHG (infantile hemispheric glioma), LGG (other low-grade glioma subgroups), and HGG (other high-grade glioma subgroups; n = 102). P value is calculated by the log-rank test (P = 0.0566 for HGG vs. rest). G, t-statistic based t-SNE projection of a combined methylation dataset comprising the intrinsic set of the current study (n = 130, circled) plus a reference set of glioma subtypes (n = 1,652). The first two projections are plotted on the x and y axes, with samples represented by dots colored by subtype according to the key provided.
Figure 2.
Figure 2.
Mutations in infant gliomas. A, OncoPrint representation of an integrated annotation of single-nucleotide variants, DNA copy-number changes, and structural variants for infant gliomas excluded as other subgroups (n = 24). B, OncoPrint representation of an integrated annotation of single-nucleotide variants, DNA copy-number changes, and structural variants for infant gliomas in the intrinsic set (n = 41). Samples are arranged in columns with genes labeled along rows. Clinicopathologic and molecular annotations are provided as bars according to the included key.
Figure 3.
Figure 3.
Copy number–associated fusion genes in infant gliomas. A, Segmented DNA copy-number heat map for ALK breakpoint cases, plotted according to chromosomal location. Pink, gain; blue, loss. B, Segmented DNA copy-number heat map for ROS1 breakpoint cases, plotted according to chromosomal location. Pink, gain; blue, loss. C, Segmented DNA copy-number heat map for MET breakpoint cases, plotted according to chromosomal location. Pink, gain; blue, loss. D, ETV6–NTRK3. Cartoon representation of the fusion structure, with reads on either side of the breakpoint colored by gene partner and taken from an Integrated Genome Viewer snapshot. Below this is a Sanger sequencing trace spanning the breakpoint. Underneath are copy-number plots (log2 ratio, y-axis) for chromosomal regions spanning the breakpoints (x-axis). Points are colored red for copy-number gain, blue for loss, and grey for no change. The smoothed values are overlaid by the purple line. E, ZC3H7A–ALK. Cartoon representation of the fusion structure, with reads on either side of the breakpoint colored by gene partner and taken from an Integrated Genome Viewer snapshot. Below this is a Sanger sequencing trace spanning the breakpoint. Underneath are copy-number plots (log2 ratio, y-axis) for chromosomal regions spanning the breakpoints (x-axis). Points are colored red for copy-number gain, blue for loss, and gray for no change. The smoothed values are overlaid by the purple line. F, Circos plot of gene fusions targeting NTRK1 (light orange), NTRK2 (orange), and NTRK3 (dark orange). Lines link fusion gene partners according to chromosomal location, represented by ideograms arranged around the circle. G, Circos plot of gene fusions targeting ALK (dark blue). Lines link fusion gene partners according to chromosomal location, represented by ideograms arranged around the circle. H, Kaplan–Meier plot of overall survival of cases separated by fusion event (n = 63). P value is calculated by the log-rank test (P = 0.085 for any fusion vs. none).
Figure 4.
Figure 4.
Epigenetic alterations in fusion-positive and fusion-negative infant gliomas. A, Differential methylation-based gene ontology analysis for ALK-fusion cases, represented in bar plots of −log10 P value for labeled highest-scoring categories (top) and aggregated ontology networks (bottom). B, Differential methylation-based gene ontology analysis for NTRK-fusion cases, represented in bar plots of −log10 P value for labeled highest-scoring categories (top) and aggregated ontology networks (bottom). C, Differential methylation-based gene ontology analysis for fusion-negative cases, represented in bar plots of −log10 P value for labeled highest scoring categories (top) and aggregated ontology networks (bottom). Node size is proportional to the number of genes, shading represents −log10 P value (darker is higher). Thickness of connecting lines reflects the percentage of overlapping genes. D, Genome browser view of the WNT5A locus, with lower methylation, provided as bar plots, in selected ALK-fusion (blue) cases compared to NTRK-fusion (orange) and fusion-negative (gray) cases. E, Genome browser view of the STAT1 locus, with lower methylation, provided as bar plots, in selected NTRK-fusion (orange) cases compared with ALK-fusion (blue) and fusion-negative (gray) cases. F, Genome browser view of the TP63 locus, with lower methylation provided as bar plots, in selected fusion-negative (gray) cases compared with ALK-fusion (blue) and NTRK-fusion (orange) cases. Chromosomal ideograms are provided, with the red bar indicating the cytoband in which the locus is found. Differentially methylated probes are highlighted by the red box. G, Immunofluorescence staining of an antibody directed against WNT5A (white) in an EML4–ALK fusion infant glioma case, UOLP_INF_001. DAPI is used as a counterstain. Scale bar, 50 μm. H, Immunofluorescence staining of an antibody directed against STAT1 (green) in an ETV6–NTRK3 fusion infant glioma case, GOSH_INF_007. DAPI is used as a counterstain. Scale bar, 50 μm. I, Heat map representing gene expression values from a NanoString assay of 30 most differentially methylated genes between ALK-fusion (blue), NTRK-fusion (orange), and fusion-negative (gray) cases. Expression values are colored according to the scale provided.
Figure 5.
Figure 5.
Preclinical modelling of ALK-fused glioma. A, Schematic representation of the in vivo modeling workflow. IUE, in utero electroporation; KD, kinase domain. B, Kaplan–Meier curve of injected animals using IUE and p0-RCAS method: PPP1CB–ALK only IUE, PPP1CB–ALK + Trp53-KO IUE, PPP1CB–ALK + Cdkn2a-KO IUE and PPP1CB–ALK p0-RCAS only. *, P < 0.05; **, P < 0.01. C and D, Effect of targeted ALK inhibition on growth of allografted PPP1CB–ALK + Cdkn2a-KO mouse tumor cells in vivo. p.i., post injection. E, Targeted inhibition significantly prolonged the survival of PPP1CB– ALK + Cdkn2a-KO allografted mice compared with temozolomide or vehicle controls. Two mice in the lorlatinib group were sacrificed due to technical complications with drug delivery, with no tumor being evident upon dissection of the brain. ***, P < 0.001. F, Clinical history of DKFZ_INF_307, with confirmed MAD1L1–ALK fusion. Timeline of clinical interventions is provided below, with treatment shaded in gray. Axial T2 MRI scans from diagnosis and successive surgeries and chemotherapeutic regimens are provided, in addition to treatment with the ALK inhibitor ceritinib, with tumor circled in red.
Figure 6.
Figure 6.
Preclinical and clinical experience with TRK inhibitors in fusion-positive infant glioma. A, Light microscopy image of two patient-derived infant glioma cell cultures, harboring either TPM3–NTRK1 (QCTB-R102; light orange) or ETV6–NTRK3 (QCTB-R077; dark red) fusions. B, Concentration–response curves for three TRK inhibitors tested against two NTRK fusion–positive infant glioma cell cultures (QCTB-R102, TPM3–NTRK1, light orange; QCTB-R077, ETV6–NTRK3, dark red) and two fusion-negative glioma cultures (QCTB-R006, light gray; QCTB-R059, dark gray). Concentration of compound is plotted on a log scale (x-axis) against cell viability (y-axis). Mean plus SE are plotted from at least n = 3 experiments. C, Clinical history of OPBG_INF_035, with confirmed ETV6-NTRK3 fusion. Timeline of clinical interventions is provided below, with TRK inhibitor treatment shaded in gray. Diagnosis, postbiopsy, pre/postsurgery, post-crizotinib, and post-larotrectinib axial T2 MRI scans are provided, with tumor circled in red. D, Clinical history of MSKC_INF_006, with confirmed ETV6–NTRK3 fusion. Timeline of clinical interventions is provided below, with TRK inhibitor treatment shaded in gray. Diagnosis and post-larotrectinib post-contrast axial T1 MRI scans are provided, with tumor circled in red.
Figure 7.
Figure 7.
Summary of infant HGG subgroups.

Comment in

References

    1. Jones C, Perryman L, Hargrave D . Paediatric and adult malignant glioma: close relatives or distant cousins? Nat Rev Clin Oncol 2012;9: 400–13. - PubMed
    1. Schwartzentruber J, Korshunov A, Liu XY, Jones DT, Pfaff E, Jacob K, et al. Driver mutations in histone H3.3 and chromatin remodelling genes in paediatric glioblastoma. Nature 2012;482:226–31. - PubMed
    1. Wu G, Broniscer A, McEachron TA, Lu C, Paugh BS, Becksfort J, et al. Somatic histone H3 alterations in pediatric diffuse intrinsic pontine gliomas and non-brainstem glioblastomas. Nat Genet 2012;44:251–3. - PMC - PubMed
    1. Jones C, Baker SJ. Unique genetic and epigenetic mechanisms driving paediatric diffuse high-grade glioma. Nat Rev Cancer 2014;14:651–61. - PMC - PubMed
    1. Sturm D, Witt H, Hovestadt V, Khuong-Quang DA, Jones DT, Konermann C, et al. Hotspot mutations in H3F3A and IDH1 define distinct epigenetic and biological subgroups of glioblastoma. Cancer Cell 2012;22:425–37. - PubMed

Publication types