. 2020 Apr 21;117(16):8989-9000.
doi: 10.1073/pnas.1920051117. Epub 2020 Apr 1.

The spatiotemporal spread of human migrations during the European Holocene

Affiliations

The spatiotemporal spread of human migrations during the European Holocene

Fernando Racimo et al. Proc Natl Acad Sci U S A. .

Abstract

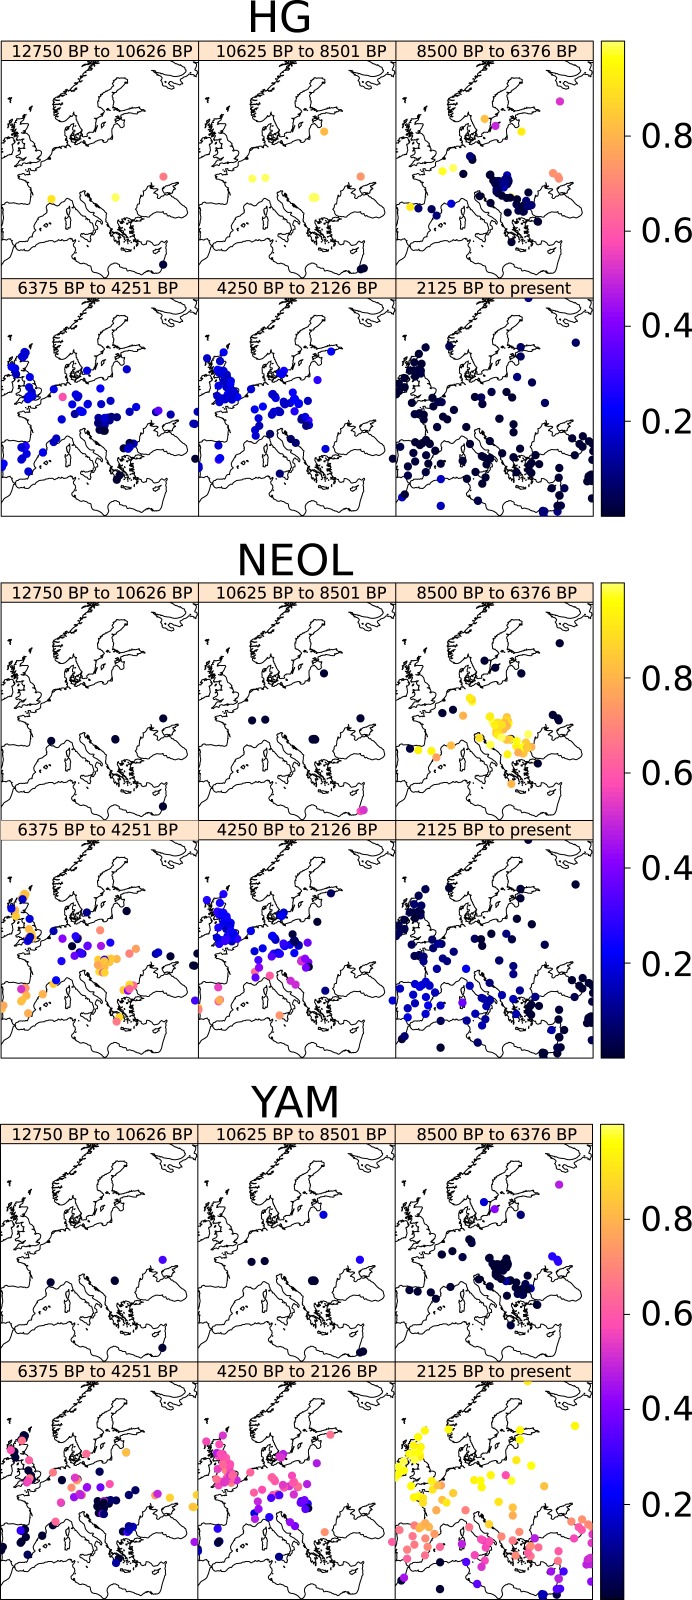
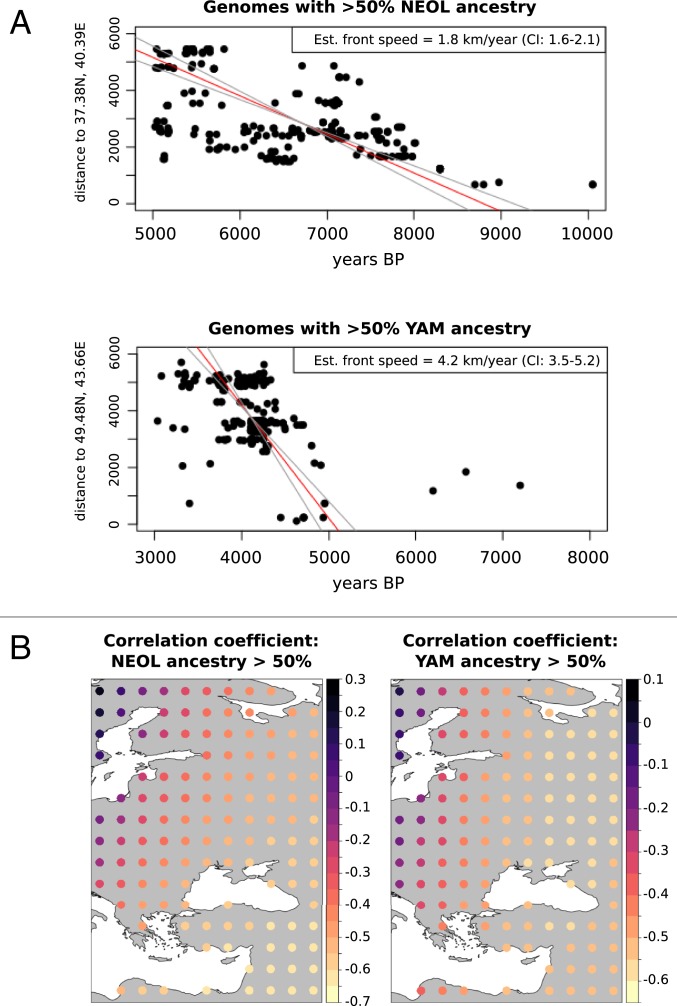
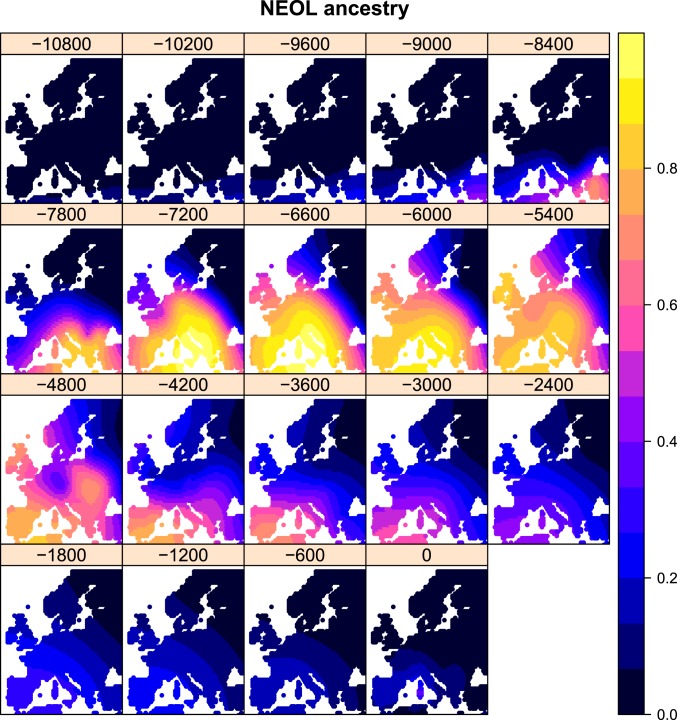
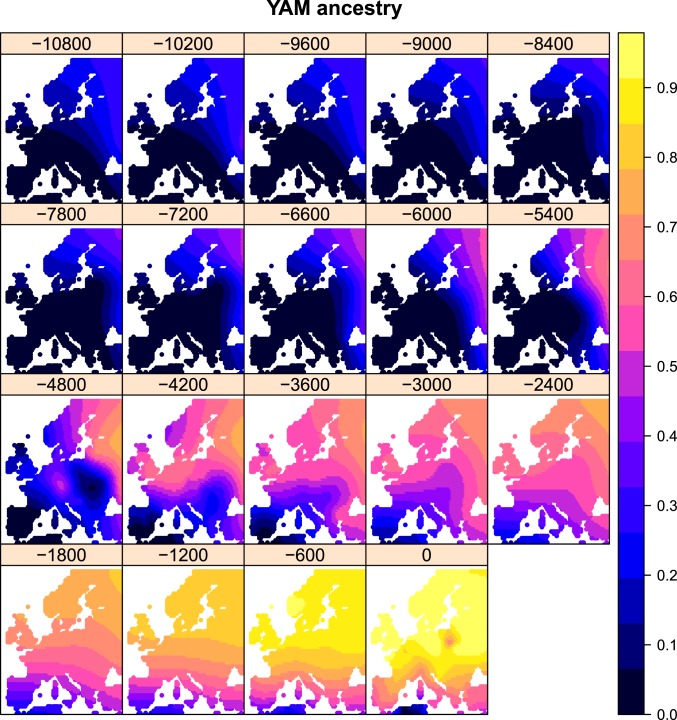
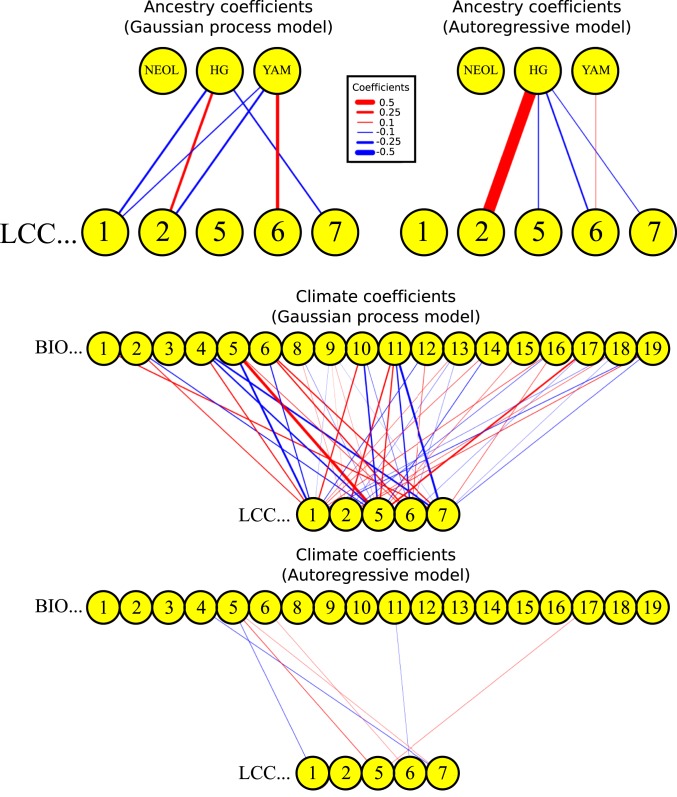
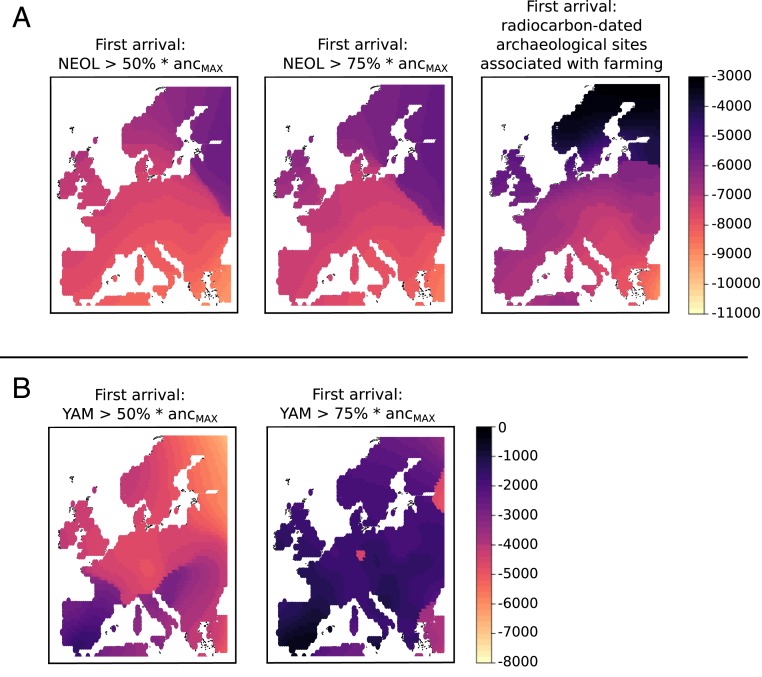
The European continent was subject to two major migrations of peoples during the Holocene: the northwestward movement of Anatolian farmer populations during the Neolithic and the westward movement of Yamnaya steppe peoples during the Bronze Age. These movements changed the genetic composition of the continent's inhabitants. The Holocene was also characterized by major changes in vegetation composition, which altered the environment occupied by the original hunter-gatherer populations. We aim to test to what extent vegetation change through time is associated with changes in population composition as a consequence of these migrations, or with changes in climate. Using ancient DNA in combination with geostatistical techniques, we produce detailed maps of ancient population movements, which allow us to visualize how these migrations unfolded through time and space. We find that the spread of Neolithic farmer ancestry had a two-pronged wavefront, in agreement with similar findings on the cultural spread of farming from radiocarbon-dated archaeological sites. This movement, however, did not have a strong association with changes in the vegetational landscape. In contrast, the Yamnaya migration speed was at least twice as fast and coincided with a reduction in the amount of broad-leaf forest and an increase in the amount of pasture and natural grasslands in the continent. We demonstrate the utility of integrating ancient genomes with archaeometric datasets in a spatiotemporal statistical framework, which we foresee will enable future studies of ancient populations' movements, and their putative effects on local fauna and flora.

Keywords: Bronze Age; Neolithic; ancient DNA; land cover; migrations.


Conflict of interest statement

The authors declare no competing interest.

Figures

Fig. 1.
Fig. 1.
Spatiotemporal maps of ancestry proportions for ancient and present-day genomes in this study. Note that not all ancient samples in each map are strictly contemporaneous with each other.
Fig. 2.
Fig. 2.
(A) Front speed estimation for the Neolithic farmer (Upper) and Yamnaya steppe peoples (Lower) population movements. We used an RMA regression on time against distance from the hypothesized origin of the spread to estimate average migration front speed. In this case, we used a >50% ancestry cutoff to define genomes as belonging to a particular migration wave. Est., estimated. (B) Point-of-origin estimation. We computed the correlation coefficient between time of sampling and distance from a hypothesized origin, which should be negative for a range expansion. Each dot in the map represents a different hypothesized origin.
Fig. 3.
Fig. 3.
Schematic of methodology for spatiotemporal kriging and vegetation modeling. (A) We first fitted a latent mixed-membership model to the ancient and present-day genomes. The ancestry proportions were then assigned the temporal and spatial metadata of their respective genomes, which allowed us to perform spatiotemporal kriging to any location and time in the European Holocene. (B) We used a spatiotemporally aware model to understand how patterns of human migration and climate relate to patterns of vegetation type changes during the European Holocene, while accounting for spatiotemporal autocorrelation. We used a bootstrapping method to account for biases due to uneven sampling of ancient genomes. Brighter colors represent higher values of each depicted variable.
Fig. 4.
Fig. 4.
Spatiotemporal kriging of NEOL ancestry during the Holocene, using 5,000 spatial grid points. The colors represent the predicted ancestry proportion at each point in the grid.
Fig. 5.
Fig. 5.
Spatiotemporal kriging of YAM steppe ancestry during the Holocene, using 5,000 spatial grid points. The colors represent the predicted ancestry proportion at each point in the grid.
Fig. 6.
Fig. 6.
(A) Timelines of kriged ancestry and vegetation type proportions at different points in Europe. (B) Change in pasture/natural grassland and broad-leaf forest cover composition after the arrival (first time there is >50% ancestry) in each spatial grid point of YAM and NEOL ancestry. Each line corresponds to the postarrival progression of a different spatial grid point.
Fig. 7.
Fig. 7.
Posterior mean coefficients of spatiotemporal model for paleovegetation anomalies, using kriged ancestry anomalies and anomalies from simulation-based paleoclimate reconstructions as explanatory variables. (Top Left and Middle) Posterior coefficients from GP model. (Top Right and Bottom) Coefficients from autoregressive model. Coefficients whose corresponding posterior distribution has a 95% central probability mass interval that spans the value of 0 are not depicted. LCC1, needle-leaf forest; LCC2, broad-leaf forest; LCC5, heath/scrubland; LCC6, pasture/natural grassland; LCC7, arable/disturbed land. The climate variables follow the WorldClim nomenclature. BIO1, Annual Mean Temperature; BIO2, Mean Diurnal Range (Mean of monthly (max temp – min temp)); BIO3, Isothermality (BIO2/BIO7) (× 100); BIO4, Temperature Seasonality (SD × 100); BIO5, Max Temperature of Warmest Month; BIO6, Min Temperature of Coldest Month; BIO8, Mean Temperature of Wettest Quarter; BIO9, Mean Temperature of Driest Quarter; BIO10, Mean Temperature of Warmest Quarter; BIO11, Mean Temperature of Coldest Quarter; BIO12, Annual Precipitation; BIO13, Precipitation of Wettest Month; BIO14, Precipitation of Driest Month; BIO15, Precipitation Seasonality (Coefficient of Variation); BIO16, Precipitation of Wettest Quarter; BIO17, Precipitation of Driest Quarter; BIO18, Precipitation of Warmest Quarter; BIO19, Precipitation of Coldest Quarter.
Fig. 8.
Fig. 8.
Comparison of inferred spread of farming from archaeological sites and spread of NEOL (A) and YAM (B) ancestries. A and B, Left define first arrival as the first time slice in which a grid point has more than 50%*ancMAX of the ancestry depicted, where ancMAX is the maximum value that ancestry reaches at that point throughout the entire timeline. A, Center and B, Right are the result of using a more strict cutoff: 75%*ancMAX ancestry. A, Right is a spatially kriged map of first arrivals of farming practices, based on radiocarbon-dated archaeological sites.

References

    1. Sikora M., et al. , Population genomic analysis of ancient and modern genomes yields new insights into the genetic ancestry of the Tyrolean Iceman and the genetic structure of Europe. PLoS Genet. 10, e1004353 (2014). - PMC - PubMed
    1. Lazaridis I., et al. , Ancient human genomes suggest three ancestral populations for present-day Europeans. Nature 513, 409–413 (2014). - PMC - PubMed
    1. Lazaridis I., et al. , Genomic insights into the origin of farming in the ancient Near East. Nature 536, 419–424 (2016). - PMC - PubMed
    1. Ammerman A. J., Cavalli-Sforza L. L., Measuring the rate of spread of early farming in Europe. Man 6, 674–688 (1971).
    1. Silva F., Steele J., New methods for reconstructing geographical effects on dispersal rates and routes from large-scale radiocarbon databases. J. Archaeol. Sci. 52, 609–620 (2014).

Publication types

LinkOut - more resources