. 2020 Apr;580(7801):136-141.
doi: 10.1038/s41586-020-2099-x. Epub 2020 Mar 11.

CRISPR screens in cancer spheroids identify 3D growth-specific vulnerabilities

Affiliations

CRISPR screens in cancer spheroids identify 3D growth-specific vulnerabilities

Kyuho Han et al. Nature. 2020 Apr.

Abstract

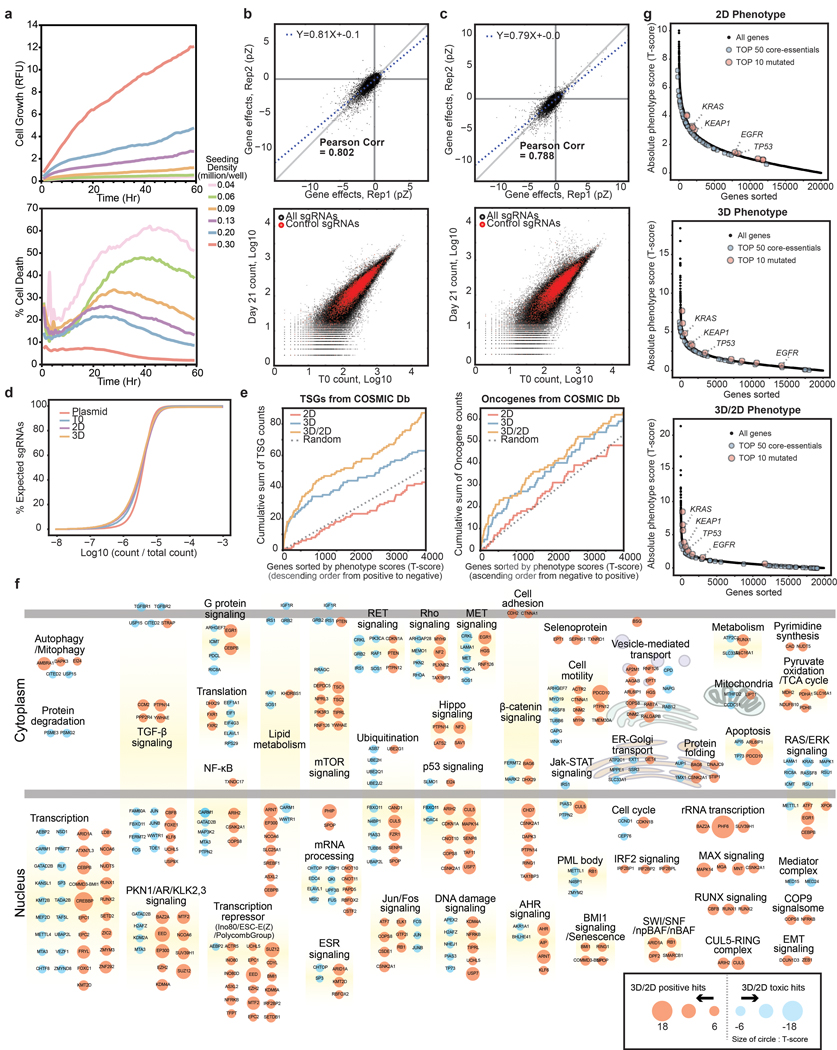
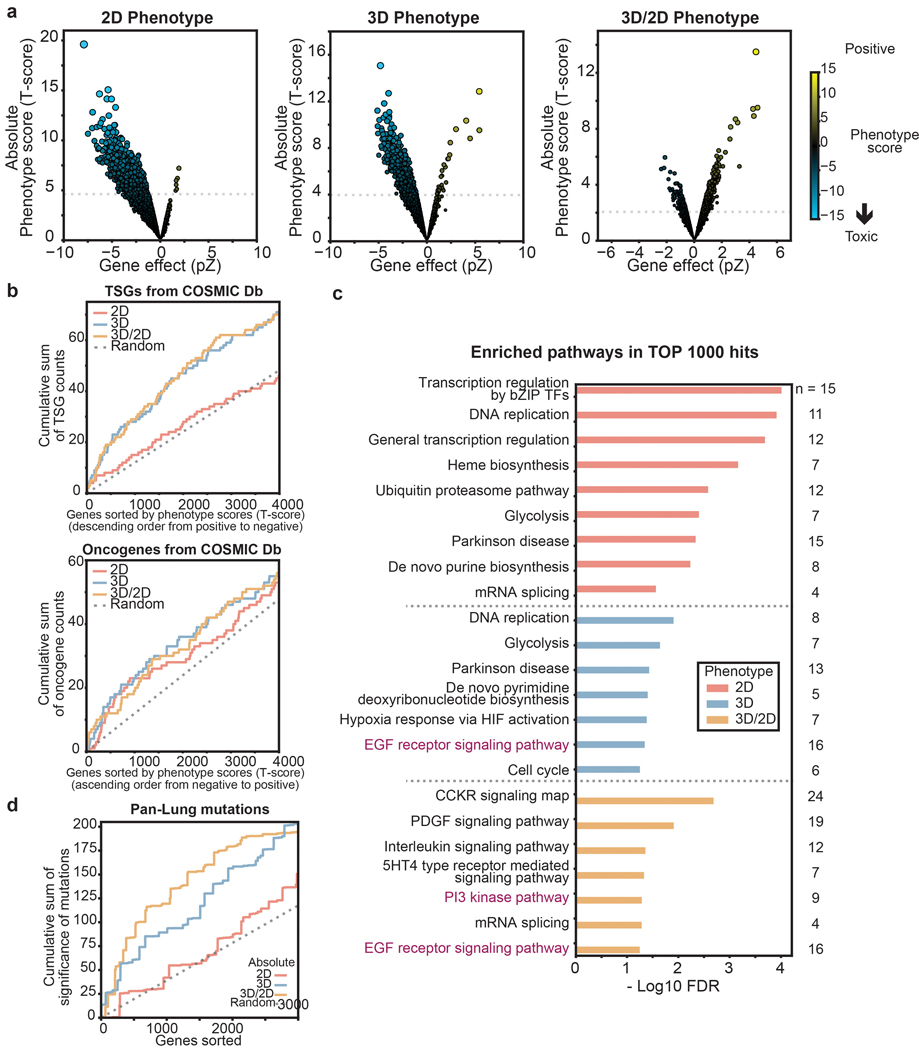
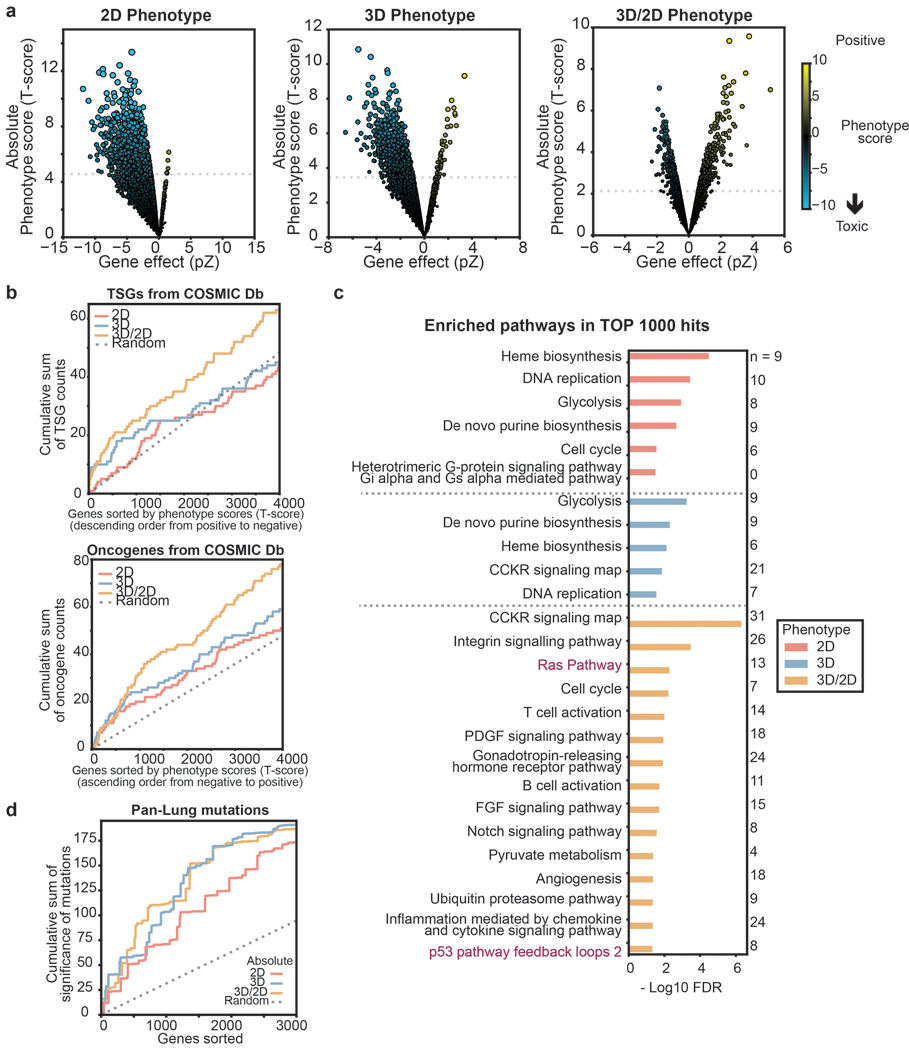
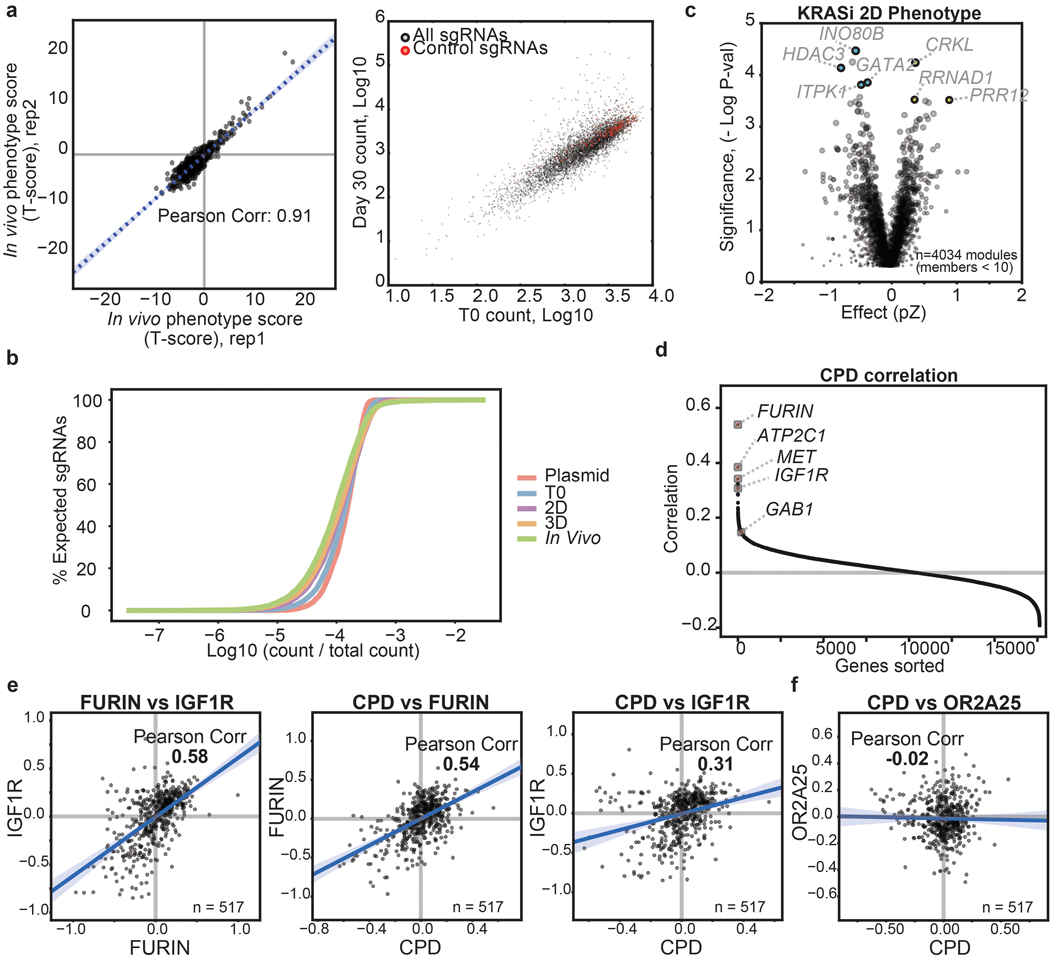
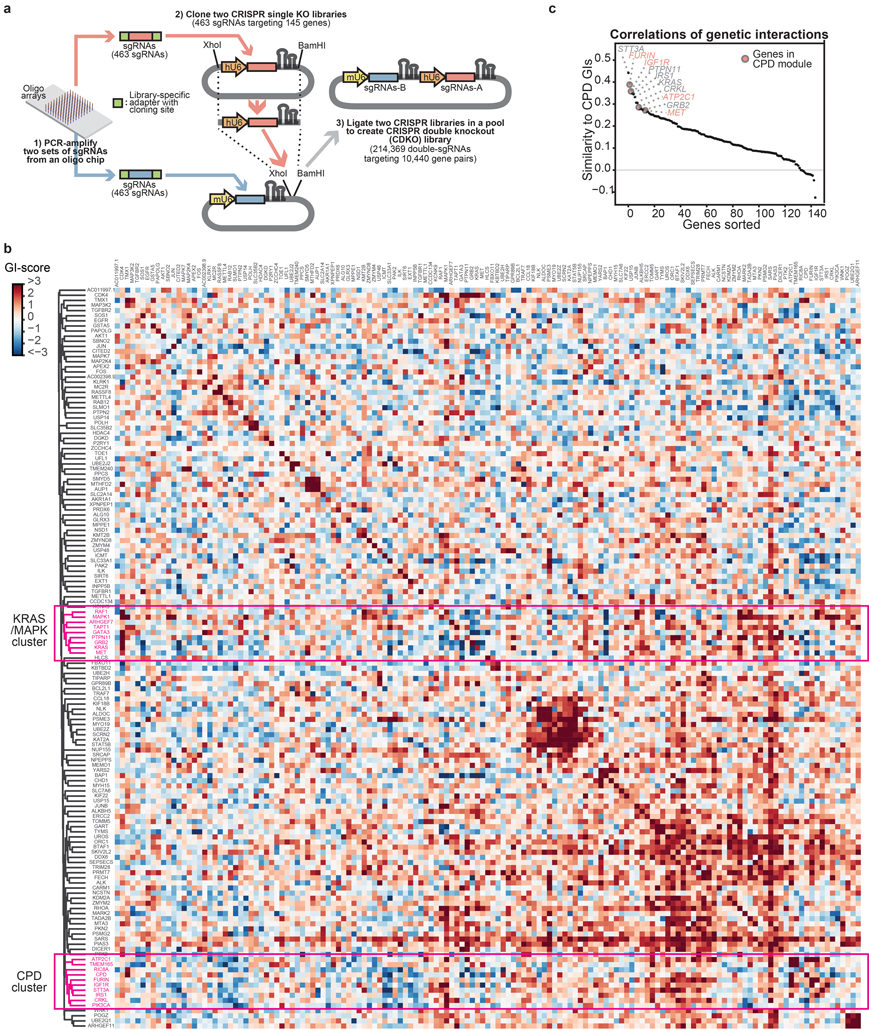
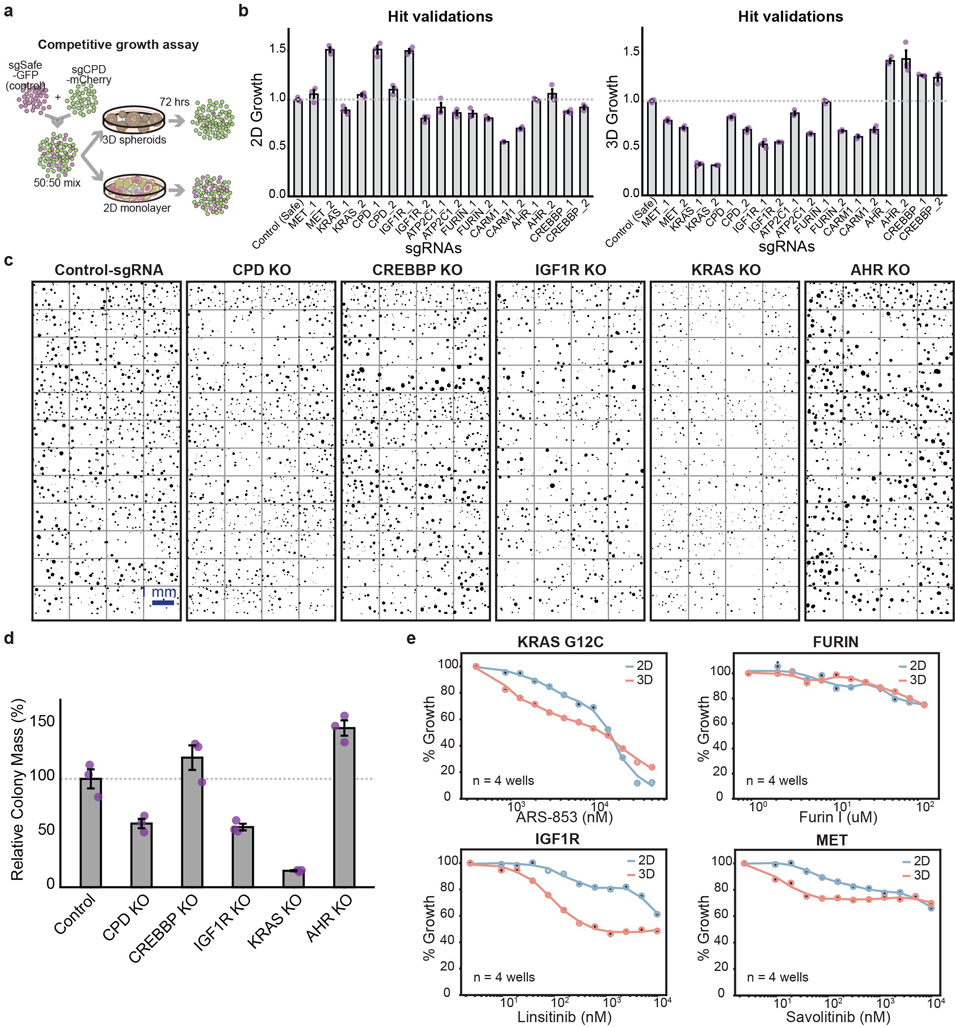
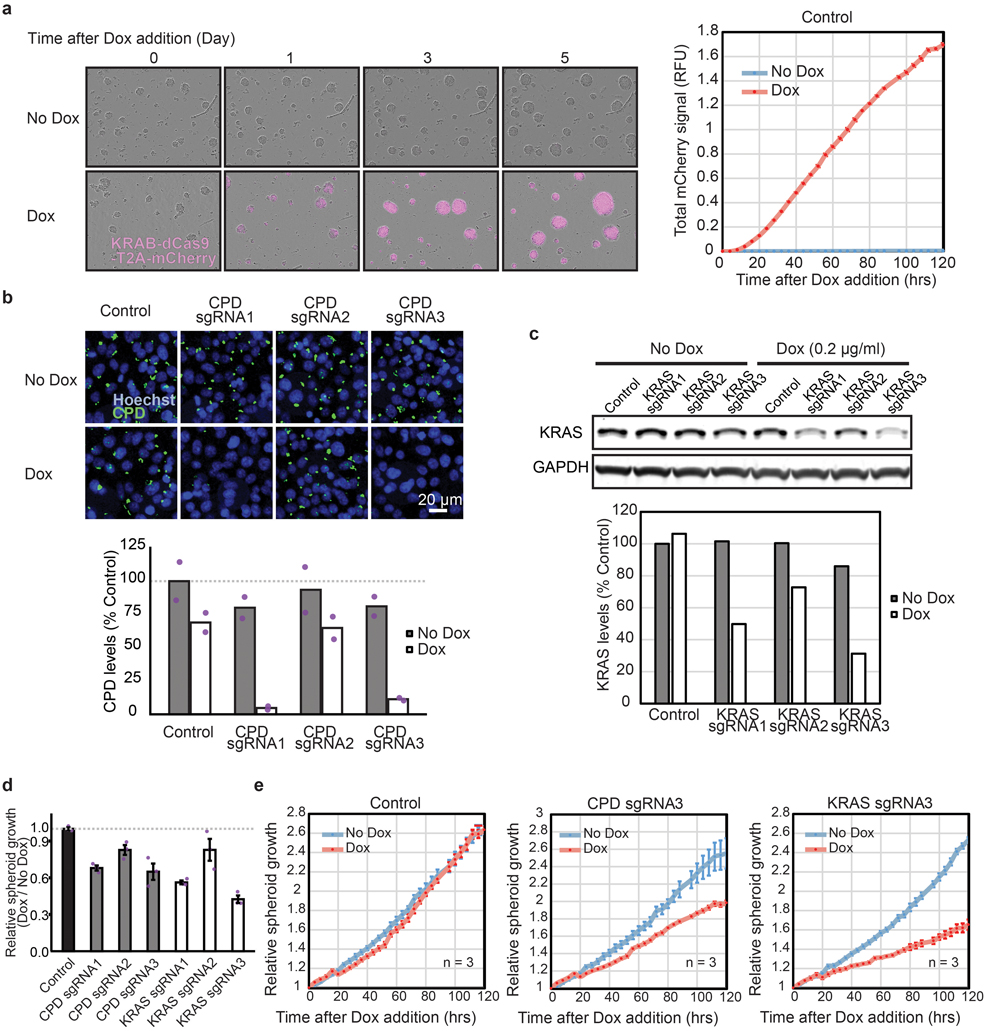
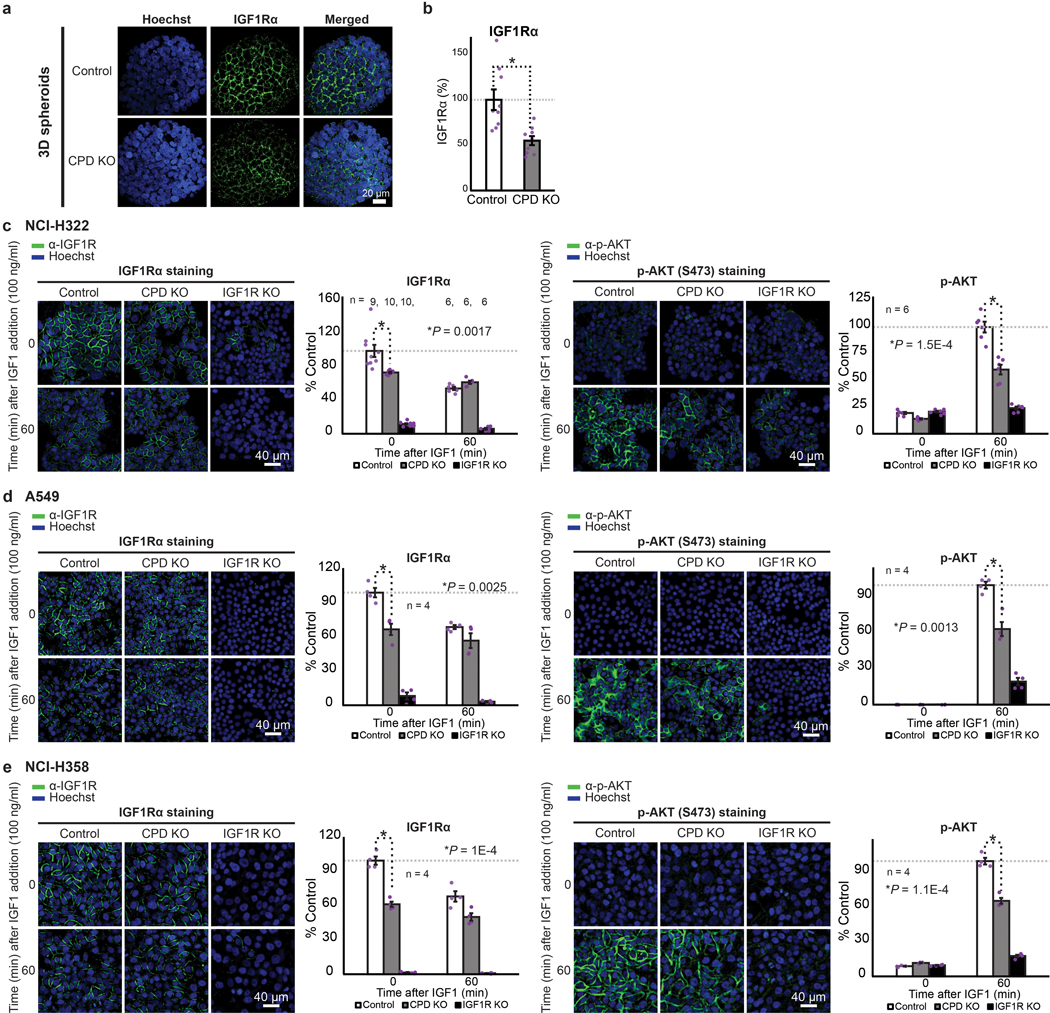
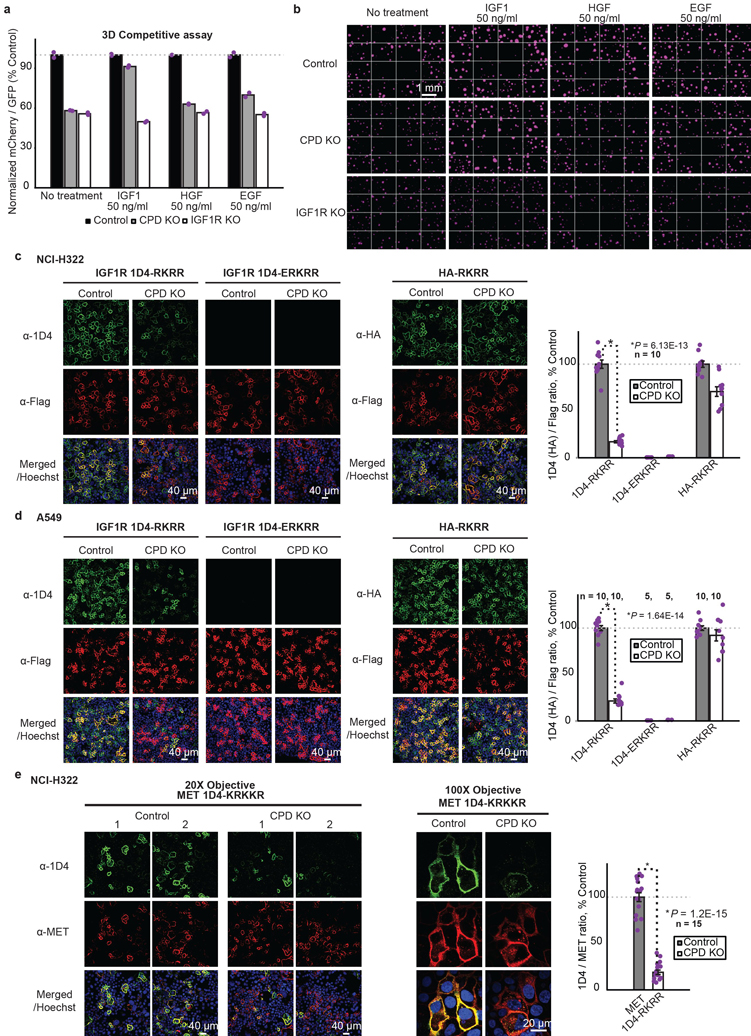
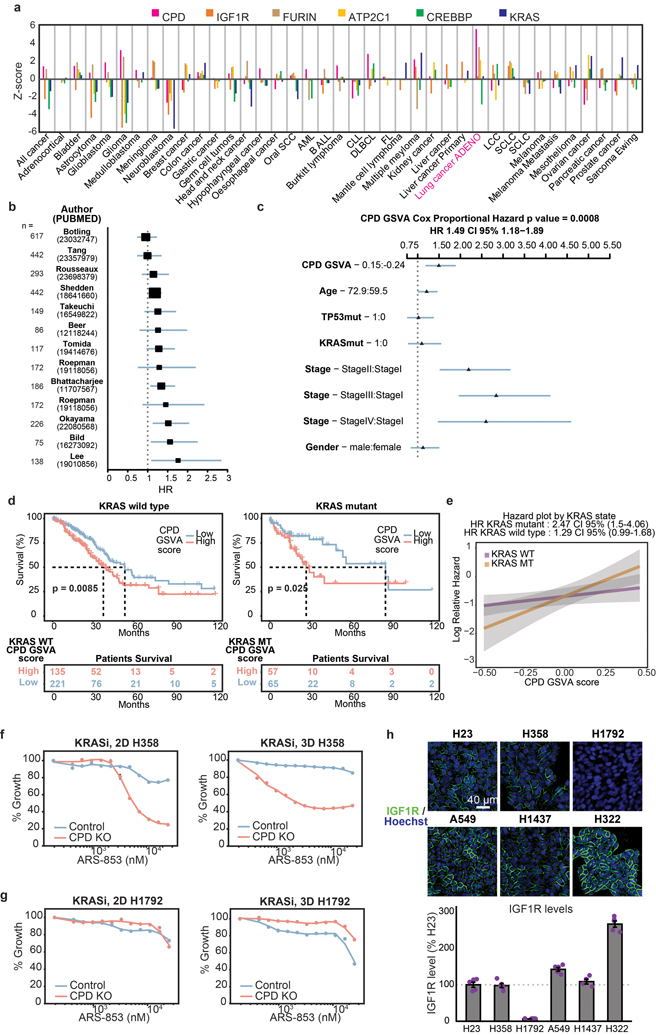
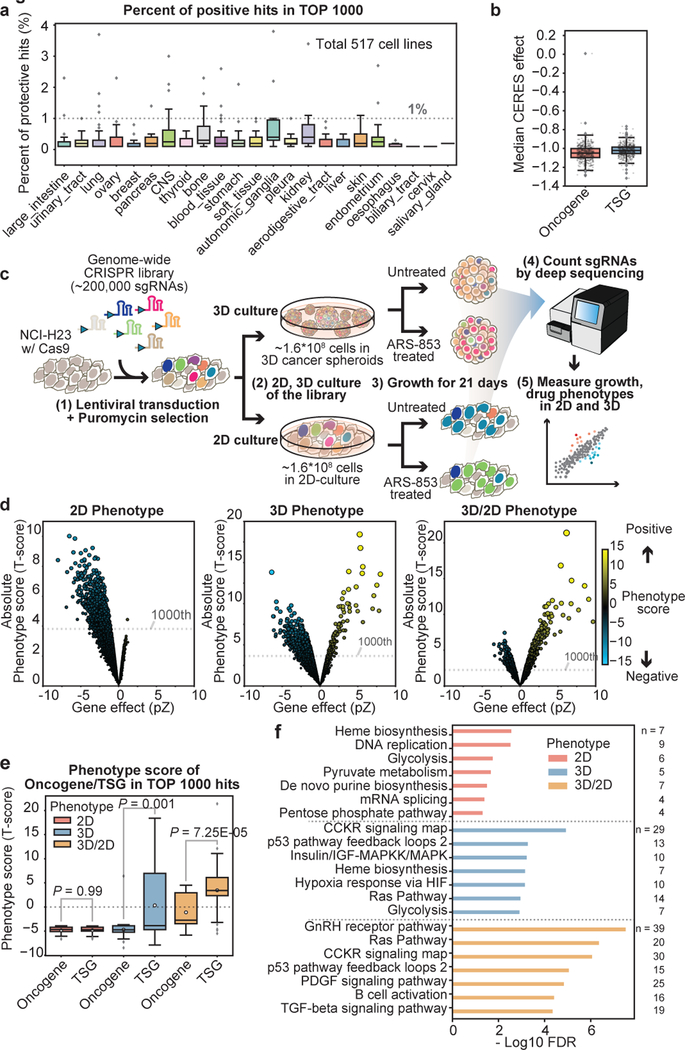
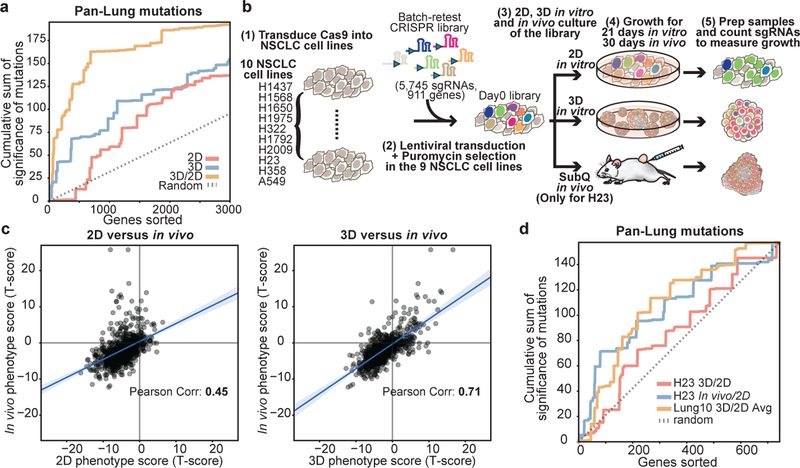
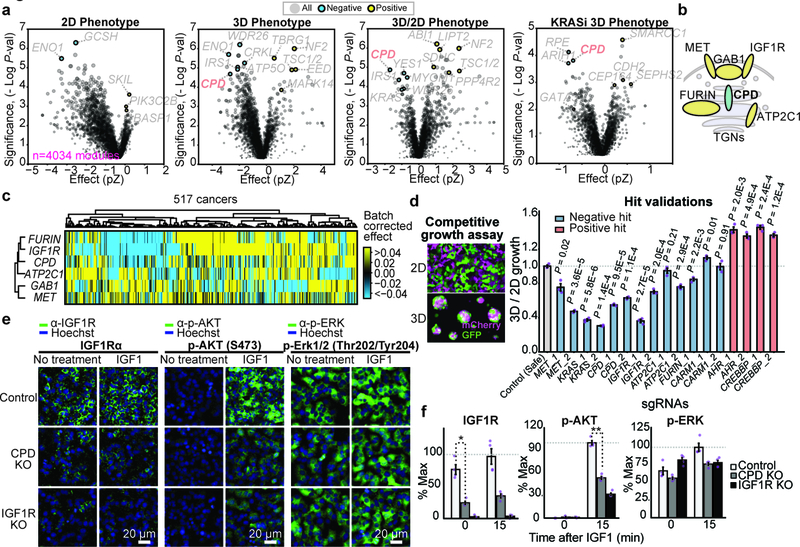
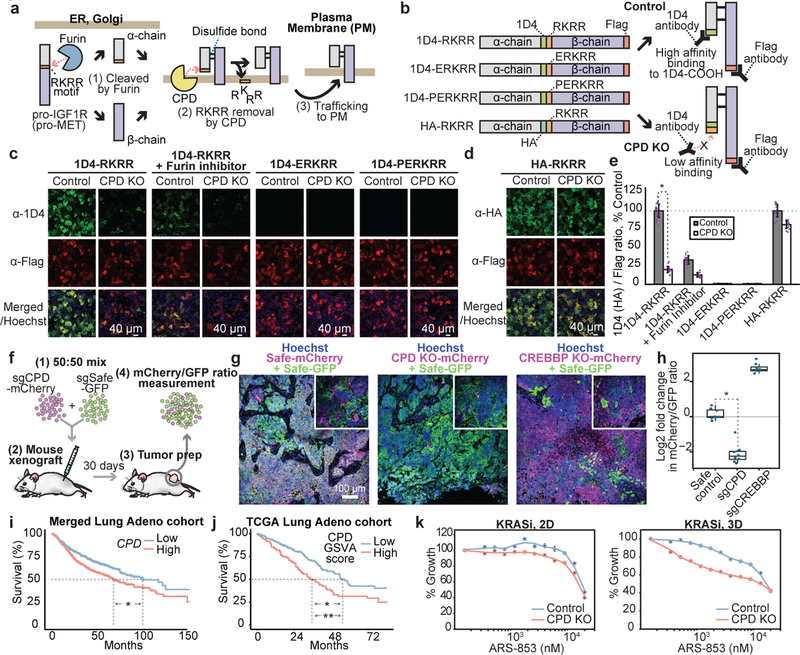
Cancer genomics studies have identified thousands of putative cancer driver genes1. Development of high-throughput and accurate models to define the functions of these genes is a major challenge. Here we devised a scalable cancer-spheroid model and performed genome-wide CRISPR screens in 2D monolayers and 3D lung-cancer spheroids. CRISPR phenotypes in 3D more accurately recapitulated those of in vivo tumours, and genes with differential sensitivities between 2D and 3D conditions were highly enriched for genes that are mutated in lung cancers. These analyses also revealed drivers that are essential for cancer growth in 3D and in vivo, but not in 2D. Notably, we found that carboxypeptidase D is responsible for removal of a C-terminal RKRR motif2 from the α-chain of the insulin-like growth factor 1 receptor that is critical for receptor activity. Carboxypeptidase D expression correlates with patient outcomes in patients with lung cancer, and loss of carboxypeptidase D reduced tumour growth. Our results reveal key differences between 2D and 3D cancer models, and establish a generalizable strategy for performing CRISPR screens in spheroids to reveal cancer vulnerabilities.


Conflict of interest statement

ETHICS DECLARATIONS

Competing interests

Authors through the Office of Technology Licensing at Stanford University have filed patent applications on methods for inhibiting tumor growth by inhibiting CPD as well as systems and methods for identifying CPD inhibitors and other tumor suppressors and/or oncogenes.

Figures

Extended Data Figure 1.
Extended Data Figure 1.. High quality/reproducibility of 2D and 3D genome-wide CRISPR screens and hits with differential effects in the two conditions.
a. H23 cells expressing mCherry were seeded at different densities in ultra-low attachment plates in the presence of 0.75% MC. Sytox Green was added at 100 nM concentration. Average mCherry signal and Sytox Green signal measured across single cells were used to estimate the total numbers of live cells and dead cells at each seeding density. Cell growth and death rates were then monitored simultaneously on a live-cell microscope for 60 hrs. We aimed for a ~30% cell death rate during the initial growth phase of spheroids and 0.1 million cells per well (1.9 cm2) was the chosen cell seeding density for our genome-wide screens in 3D spheroids b. 2D growth phenotypes of 20,463 genes were highly reproducible between experimental replicates (top panel). Sequencing counts of 208,687 sgRNAs in a T0 sample and a Day 21 sample from the 2D genome-wide screens (bottom panel) show that most negative control sgRNAs (red dots) do not enriched or disenriched between T0 and Day 21 (black dots). This indicates the complexity of the genome-wide library was maintained throughout the 2D screen. In the top plot, the data are fit by a linear regression line (blue dotted line). The gray line marks a 1:1 diagonal. Pearson corr, Pearson correlation coefficients. c. The quality and reproducibility of the 3D screens were comparable to those of the 2D screens, suggesting that the scalable 3D spheroid culture system is on a par with traditional 2D culture methods for its performance in genome-scale CRISPR screens. n=20,463 genes for the top plot. n=208,687 sgRNAs for the bottom plot. In the top plot, the data are fit by a linear regression line (blue dotted line). The gray line marks a 1:1 diagonal. Pearson corr, Pearson correlation coefficients. d. Cumulative distribution of sequencing reads for sgRNAs in the genome-wide CRISPR library. Read counts were normalized by total reads for each sample and the cumulative sums of sgRNAs were plotted as relative percentages of the number of expected sgRNAs. e. Cumulative sums of TSGs counts (left plot) or oncogenes counts (right plot) are plotted against genes sorted by their 2D, 3D, or 3D/2D phenotypes (T-score) from the genome-wide screens in H23 cells. TSGs are expected to have positive growth phenotypes when deleted. Therefore, genes are sorted in descending order from the most positive to the most negative phenotypes in the left plot for TSGs. On the other hand, oncogenes are expected to have negative/toxic growth phenotypes and genes are sorted in ascending order in the right plot for oncogenes. Black dotted line, randomly sorted genes. The first 4,000 genes are displayed. f. Summary of hits with differential 3D/2D phenotypes. Top positive (red filled circles) and negative (blue filled circles) hits from the differential 3D/2D phenotypes reveal many cancer relevant genes associated with transcriptional regulation, cell motility, cell adhesion, and energy metabolism. Cancer signaling pathways such as RAS-MAPK, TGFβ, MET, Rho, β-catenin, and hippo signaling are strongly represented. Sizes of circles are proportional to 3D/2D phenotype scores. g. The 10 most significant Pan-lung cancer genes and 50 top core-essential genes are marked. Genes sorted by absolute phenotype (T-score) in 2D, 3D, and 3D/2D (see Methods).
Extended Data Figure 2.
Extended Data Figure 2.. Genome-wide 2D and 3D CRISPR screens in NCI-H1975, a lung adenocarcinoma line with EGFR L858R mutation.
a. Distributions of 2D and 3D phenotypes are shown as volcano plots. The Y axis represents absolute T-score for each gene, and the X axis represents effect size of each gene. Size of dots represents absolute T-score of genes. b. Prediction of TSGs or oncogenes with 2D, 3D, 3D/2D phenotypes in NCI-H1975. Cumulative sums of TSGs counts (top panel) or oncogenes counts (bottom panel) are plotted against genes sorted by their 2D, 3D, or 3D/2D phenotypes (T-score) from the genome-wide screens in H1975 cells. These data indicate 3D or differential 3D/2D phenotypes show marked improvement for prediction of TSGs when compared to the 2D phenotypes, with marginal improvement for predicting oncogenes. In the boxplots, center lines mark median; box limits mark upper and lower quartiles; whiskers, 1.5x interquartile range; points, outliers. c. Enriched pathways among the top 1000 hits from each culture condition were analyzed using PANTHER Overrepresentation Test. Significance of enriched pathways were measured with Fisher’s Exact test and the Benjamini-Hochberg False Discovery Rate (FDR) were subsequently computed (x-axis). The EGFR signaling pathway, a known driver for NCI-H1975, is enriched in only 3D or 3D/2D phenotypes. Number of genes for enriched pathways are marked at the right side of bars. d. The cumulative sum of the significance of 11,249 Pan-lung cancer mutations from 1,144 lung cancer patients as measured by MutSig2CV is displayed on the y-axis, while the x-axis shows phenotypes for genes sorted by their strength in 2D (solid red line), 3D (solid blue line), or 3D/2D (solid yellow line). Black dotted line, randomly sorted genes. Top 3,000 genes are shown.
Extended Data Figure 3.
Extended Data Figure 3.. Genome-wide 2D and 3D CRISPR screens in NCI-H2009, a lung adenocarcinoma line with KRAS G12A mutation.
a. Distributions of 2D and 3D phenotypes are shown as volcano plots. The Y axis represents absolute T-score for each gene, and the X axis represents effect size of each gene. Size of dots represents absolute T-score of genes. b. Prediction of TSGs or oncogenes with 2D, 3D, 3D/2D phenotypes in NCI-H2009. Cumulative sums of TSGs counts (top panel) or oncogenes counts (bottom panel) are plotted against genes sorted by their 2D, 3D, or 3D/2D phenotypes (T-score) from the genome-wide screens in H2009 cells. These data indicate that 3D, and in particular the differential 3D/2D phenotypes show improved prediction of both TSGs and oncogenes when compared to 2D phenotypes. In the boxplots, center lines mark median; box limits mark upper and lower quartiles; whiskers, 1.5x interquartile range; points, outliers. c. Enriched pathways among the top 1000 hits from each culture condition were analyzed using PANTHER Overrepresentation Test. Significance of enriched pathways were measured with Fisher’s Exact test and the Benjamini-Hochberg False Discovery Rate (FDR) were subsequently computed (x-axis). RAS pathway, a known driver for NCI-H2009, is enriched in 3D/2D phenotypes. Number of genes for enriched pathways are marked at the right side of bars. d. The cumulative sum of the significance of 11,249 Pan-lung cancer mutations from 1,144 lung cancer patients as measured by MutSig2CV is displayed on the y-axis, while the x-axis shows phenotypes for genes sorted by their strength in 2D (solid red line), 3D (solid blue line), or 3D/2D (solid yellow line). Black dotted line, randomly sorted genes. Top 3,000 genes are shown.
Extended Data Figure 4.
Extended Data Figure 4.. High quality/reproducibility of optimized in vivo CRISPR screens and analysis of the CPD co-essential module
a. A CRISPR sgRNA library targeting 911 hits with differential growth effects in 3D versus 2D (Supplementary Table 4) was introduced into H23 cells, and introduced by subcutaneous injection into NSG mice. After 30 days, tumors were harvested and sgRNAs were amplified. In vivo growth phenotypes of 911 genes were highly reproducible between experimental replicates (left panel). Sequencing counts of T0 samples and Day 30 samples from the in vivo batch-retest screens (right panel). In the left plot, the data are fit by a linear regression line (blue dotted line). Pearson corr, Pearson correlation coefficients. b. Cumulative distribution of sequencing reads for sgRNAs in the batch-retest library in H23 cells. Read counts were normalized by total reads for each sample and the cumulative sums of sgRNAs were plotted as relative percentages of the number of expected sgRNAs. c. 4,034 co-essential gene modules based on the DepMap CRISPR dataset are plotted as volcano plots for KRASi 2D phenotype scores. Y axis, significance of enrichments of co-essential modules as measured in log p values from the two-sided Mann-Whitney U test (see Methods). X axis, average gene effects of members in CERES modules. d. Genes in the CPD module are marked along 17,634 genes sorted by their correlations to CPD. Pearson correlation coefficients between CPD and other genes are measured in batch-corrected CERES effects in the DepMap CRISPR dataset. e. CERES effects of CPD, FURIN, and IGF1R are shown as correlation plots. CERES effects are batch-corrected before plotting. Blue lines, regression lines. Blue shaded translucent bands, 95% confidence intervals. Pearson corr, Pearson correlation coefficients. f. Lack of correlation between CPD and OR2A25, an olfactory receptor, in their CERES effects across 517 cancer lines.
Extended Data Figure 5.
Extended Data Figure 5.. Analysis of CPD co-essential module with a 145 by 145 gene genetic interaction map
a. Cloning of CRISPR double knockout (CDKO) library. 463 sgRNAs targeting 145 hits from the 3D/2D phenotypes were PCR-amplified from a oligo array. These 145 hits include members of CPD co-essential module. sgRNAs were separately cloned into two lentiviral vectors with either a mU6 or a hU6 promoter to generate two CRISPR single-knockout libraries. hU6-sgRNA cassettes were then cut out from one library and ligated into the other library containing the mU6 promoter. This generated a CRISPR double-knockout (CDKO) library with all possible pairwise combinations of 463 sgRNAs (214,369 double-sgRNAs). This CDKO library was used to measure genetic interactions (GIs) of 10,440 gene pairs (145 by 145 combinations). b. 145 by 145 genetic interaction map. 145 by 145 matrix of genetic interaction scores are shown as a heatmap. 145 genes are clustered by their GI similarities (pearson correlation coefficients of GIs) in the map. Members of the CPD co-essential module form a cluster (marked with red box) in this GI map, consistent with their correlations in the DepMap CRISPR dataset. c. A genetic interaction map validates the CPD co-essential module in H23. Correlations of GIs are used to sort 145 genes based on their similarities to GIs of CPD. Genes in the CPD module are marked with red dots along the sorted genes.
Extended Data Figure 6.
Extended Data Figure 6.. Validation of individual sgRNAs targeting top hits with differential 3D/2D growth effects
a. A schematic showing the competitive growth assay used to validate individual sgRNAs in 2D and 3D conditions. Cells expressing a gene-targeting sgRNA (mCherry) are mixed with cells expressing a control-sgRNA (Safe-sgRNA, GFP). Relative changes of mCherry to GFP ratios are monitored to compute growth phenotypes of gene-targeting sgRNAs. b. Genes within the CPD module and selected top hits with differential effects in 3D vs. 2D growth were targeted with individual sgRNAs and subjected to competitive growth assays in both 2D and 3D culture. Relative 2D and 3D growth phenotypes of individual sgRNAs were measured by tracking changes in ratios of mCherry (gene-targeting sgRNAs) to GFP (control-sgRNA) in the assays by automated fluorescence microscopy. (n=3 wells in a 24 well plate, mean±s.e.m.). c. Binary masks of H23 spheroids with the indicated gene knockouts. H23 knockout cell lines expressing sgRNAs against top hits from the 3D/2D phenotypes were seeded at equal density on ultra-low attachment plates. 3D spheroids generated from the knockout lines were imaged in a fluorescent microscope 72 hours after seeding. For each knockout line, 48 images were taken from three wells in a 24-well plate using a 10x objective. Binary masks were then generated from mCherry signals of 3D spheroids. 48 images were then stitched together to be shown as one large image for each knockout. d. Relative colony masses of H23 spheroids with gene knockouts are quantified and displayed in bar graphs. (n=3 wells in a 24 well plate, mean±s.e.m.) e. Genes in the CPD module and KRAS were targeted with corresponding small molecule inhibitors. Cells were seeded in 96 well plates in 2D (blue line) and 3D (red line) conditions, and grown in the presence of titrating doses of inhibitors for 72 hrs. Live cells were quantified with alamar blue assays. Relative growth of treated cells compared to the untreated samples are plotted in the drug titration curves. (n=3 wells in a 96 well plate for Linsitinib and n=4 for all other drugs, mean±s.e.m.)
Extended Data Figure 7.
Extended Data Figure 7.. Induced CPD knockdown in established H23 spheroids slows growth.
a. 0.2 ug/ml of doxycycline was added to established spheroids at 48 hours post initial seeding. Spheroids were expressing both mCherry and KRAB-dCas9 separated by a T2A sequence under the same doxycycline-inducible promoter. Addition of doxycycline rapidly induced KRAB-dCas9-T2A-mCherrymCherry-T2A-dCas9-KRAB expression in spheroids. (n=3 wells in a 24-well plate, mean±s.e.m.). b. Immunofluorescence staining of CPD (green) showed that CPD sgRNA 1 and 3 robustly reduced CPD levels in H23 cells expressing the inducible KRAB-dCas9 upon doxycycline addition. On the other hand, CPD sgRNA 2 was less effective. Mean intensities of CPD IF signals of 2 biological replicates were measured in the bottom bar plot.. c. Immunostaining of KRAS (green) by western blot showed that KRAS sgRNA 1 and 3 robustly reduced KRAS levels in H23 cells expressing the inducible KRAB-dCas9 upon doxycycline addition. On the other hand, KRAS sgRNA 2 was less effective. These experiments were repeated twice to confirm the result. d. Relative spheroid growth 5 days post doxycycline addition comparing doxycycline-treated and untreated samples was measured in control, CPD, and KRAS sgRNA expressing cells. H23 cells with inducible KRAB-dCas9-T2A-mCherry were first transduced with gene targeting sgRNAs using a lentivirus that also expressed a GFP marker. Cells were seeded and allowed to form spheroids for 48 hours. Doxycycline was then added and growth of spheroids in doxycycline treated or untreated samples was monitored by GFP signal for another 5 days. Spheroids expressing CPD sgRNA 1 or 3 and spheroids expressing KRAS sgRNA 1 or 3 showed markedly reduced growth upon doxycycline addition whereas spheroids expressing control sgRNA did not show difference between doxycycline treated and untreated samples. (n=3 wells in a 24 well plate. mean±s.e.m.). e. Growth of spheroids expressing control, CPD sgRNA 3, or KRAS sgRNA 3 were monitored after doxycycline addition. Cells were seeded to form spheroids in the first 48 hours and growth of spheroids were monitored by GFP for the next 5 days. (n=3 wells in a 24-well plate, mean±s.e.m.)
Extended Data Figure 8.
Extended Data Figure 8.. CPD deletion inhibits the IGF1R pathway in H322, A549, and H358 Cells.
a. Representative IF images of IGF1Rα (green) in control and CPD KO H23 spheroids. b. Quantitation of IF in a. IGF1Rα intensities averaged across 9 spheroids per condition. *P=2.2E-3 (n=9, two-sided t-test, mean±s.e.m.) c-e. IGF1R and phosphorylated AKT levels were quantified from immunofluorecence (IF) images in c for NCI-H322, in d for A549, and in e for NCI-H358. The dotted gray line marks a 100% level (P values calculated using two-sided t-test, mean±s.e.m.)
Extended Data Figure 9.
Extended Data Figure 9.. CPD deletion acts through IGF1R pathway to inhibit 3D growth in H23 cells and CPD removes the FURIN-recognition motif from the C-terminus of IGF1R and MET α-chain.
a. The growth phenotype observed upon CPD deletion in H23 cells is rescued by addition of excess IGF1 (50 ng/ml) to the growth medium. A CPD or IGF1R targeting sgRNA with mCherry and a Safe-sgRNA with GFP were infected into H23 cells separately, mixed in 50:50 ratio, and cultured in 3D spheroids for 72 hrs. Ratios of mCherry to GFP at 72 hr normalized to T0 ratios were plotted in the bar graphs. Both CPD and IGF1R deletion reduced 3D growth of spheroids as reflected in the reduced mCherry to GFP ratios compared to control. Treating cells with excess IGF1 ligand (50 ng/ml) rescued CPD deletion phenotypes, whereas EGF or HGF addition did not. This suggests that partial inhibition of IGF1R pathway by CPD deletion can be compensated by over-activation of the pathway with the excess IGF1 ligand. On the other hand, IGF1 could not rescue IGF1R deletion phenotype. (n=2 wells in a 24 well plate. mean±s.e.m.) b. Control, CPD KO, and IGF1R KO spheroids were treated with the indicated growth factors. 16 mCherry fluorescent images of spheroids expressing a gene-targeting sgRNA vector with mCherry marker were stitched together to create the images shown. c-d. IGF1R 1D4-reporters (see Fig.4b) showed that removal of the FURIN recognition site RKRR from the C-terminus of IGF1R α-chain after FURIN cleavage is severely impaired by CPD deletion in NCI-H322 (c) and A549 (d). (P values calculated using two-sided t-test, mean±s.e.m.). e. A MET 1D4-KRKKR reporter (with 1D4 epitope inserted upstream of the FURIN recognition site KRKKR in MET, as with IGF1R in Fig.4b) showed that removal of KRKKR from the C-terminus of MET α-chain is severely impaired by CPD deletion in NCI-H322. Total MET reporter levels were measured using an antibody against Met and ratios of 1D4 signal to MET staining signal were used to assess the degree of the KRKKR processing in control and CPD null background. Error bars, s.e. of biological replicates in a 96-well plate. (P values calculated using two-sided t-test, mean±s.e.m.)
Extended Data Figure 10.
Extended Data Figure 10.. Targeting CPD may have therapeutic effects in lung cancer patients.
a. Meta-Z scores of genes in CPD module across different cancer types from PRECOG analysis. Positive Z score predicts high expression of a given gene is associated with poor prognosis of disease. Pink bar (CPD) shows that high CPD expression predicts poor prognosis of lung adenocarcinoma (Z score=5.59, PRECOG meta-FDR=3.23E-06) b. A forest plot showing hazard ratios (HR) of CPD measured from different datasets (authors and PubMed IDs for the datasets are indicated on the y axis). The HR is the increase in risk of death for each unit increase in expression of CPD (see Methods). Blue error bars mark 95% confidence intervals. Number of patient samples used for each study is listed at the right side of the plot. c. A forest plot showing the hazard ratios from an adjusted two-sided Cox proportional hazard model, using the CPD GSVA score as a continuous variable adjusted by age, TP53, KRAS, stage and gender. d. Kaplan Meier (KM) plots of lung cancer patients with wild type KRAS (left panel) or mutant KRAS (right panel). Variation of a gene set downregulated by CPD deletion in H23 spheroids were first scored by GSVA (CPD GSVA score) in lung cancer patients. Differences in survival among lung cancer patients with high versus low CPD GSVA score are illustrated in KM plots. High CPD GSVA scores are significantly associated with poor prognosis in both KRAS wild type and mutant patient groups. However, the separation between high and low CPD GSVA groups is larger in KRAS mutant patients than wild type patients, suggesting an interaction between CPD and KRAS mutation in lung cancer patients. (P values calculated using a two-sided log-rank test) e. Hazard plots illustrating the two-sided Cox proportional log relative hazard by expression levels of CPD in KRAS mutant versus KRAS wild type samples. Gray shading corresponds to 95% confidence intervals. f. CPD deletion sensitizes NCI-H358 cells against ARS-853, a KRAS inhibitor. NCI-H358 cells with control Safe sgRNA (blue line) or CPD sgRNA (red line) were treated with escalating doses of ARS-853 for 72 hours in both 2D (top plot) and 3D (bottom plot). Live cells were then quantified using alamar blue assay. Relative growth of treated cells compared to the untreated cells are plotted in the titration plots. (n=4 wells in a 96 well plate. mean±s.e.m.) g. CPD deletion does not show synergy with ARS-853 in NCI-H1792 cells. The same plots as in f were generated for NCI-H1792. (n=4 wells in a 96 well plate. mean±s.e.m.) h. IGF1R were quantified from immunofluorescence images of IGF1R staining across 6 lung cancer cell lines. NCI-H1792 cells show very low IGF1R expression compared to other 5 cell lines. (n=4 for H1437, and n=5 for all other cell lines, mean±s.e.m.)
Figure 1.
Figure 1.. Genome-wide screens in 3D improve detection of cancer genes/pathways compared to 2D
a. % positive hits in top 1000 hits in the DepMap dataset. Each point represents a cell line. b. Median CERES effects of oncogenes and tumor suppressors (TSG) (annotated in COSMIC) among top 1000 hits of 517 DepMap cell lines; each data point represents a cell line. c. Schematic for CRISPR screens in H23 cells. d. Distributions of phenotypes. Y axis; absolute T-score, X axis; effect size of each gene (see Methods). Dot size represents absolute T-score. e. Phenotypes for oncogenes and TSGs in top 1000 hits in each condition. P values calculated using two-sided t-test. f. Enriched pathways among the top 1000 hits from each condition analyzed using PANTHER Overrepresentation Test (see Methods). Significance of enriched pathways were measured with Fisher’s Exact test and the Benjamini-Hochberg False Discovery Rate (FDR) were subsequently computed (x-axis). # genes in enriched pathways marked at right. In all boxplots, box limits mark upper/lower quartiles; whiskers, 1.5x interquartile range; points, outliers.
Figure 2.
Figure 2.. Genes with differential 3D/2D phenotypes are enriched for significantly mutated lung cancer genes.
a. Cumulative sum of the significance of 11,249 Pan-lung cancer genes from 1,144 lung cancer patients, measured by MutSig2CV displayed on y-axis. X-axis; phenotypes sorted by strength in 2D, 3D, or 3D/2D. Top 3,000 genes shown. b. Schematic for batch-retest CRISPR screens. c. Comparisons between in vitro and in vivo phenotypes in the H23 batch-retest screens. Data fit by linear regression (blue line); 95% confidence intervals marked (shaded bands). d. Significance of 744 Pan-lung cancer genes measured by MutSig2CV displayed as cumulative sum plots against genes sorted by absolute values of 3D/2D phenotypes in H23 cells, average 3D/2D phenotypes across 10 lung cancer lines, and H23 in vivo/2D phenotypes in batch-retest screens.
Figure 3.
Figure 3.. CPD module is critical for 3D spheroid growth and IGF1R function
a. Top negative modules (blue). Top protective modules (yellow). Y axis; significance of enrichment for co-essential modules (P values, two-sided Mann-Whitney U test). X axis; average gene effects of CERES modules (see Methods). b. Genes in the CPD co-essential module c. Cluster map showing batch-corrected CERES gene effects for CPD module. d. CPD module and selected top 3D/2D hits were validated with individual sgRNAs in competitive growth assays (see Methods). (n=3, P values, two-sided t-test between the control and gene-targeting sgRNAs, mean±s.e.m.). e. Control, CPD KO, and IGF1R KO H23 cells grown in 2D were stimulated with IGF1 (100 ng/ml) for 15 min and levels of IGF1R and activities of downstream effectors measured by IF. f. Quantitation of IF in e. *P=6.4E-4, **P=1.24E-5 (n=4, two-sided t-test, mean±s.e.m.)
Figure 4.
Figure 4.. CPD is a carboxypeptidase for IGF1R α-chain and loss of CPD inhibits in vivo tumor growth
a. Proposed model of CPD-IGF1R interaction. b. 1D4 reporters to test model in a (see Methods). c. 1D4 and Flag IF levels from the 1D4 reporters measured in control or CPD KO 2D H23 cells, untreated or treated with FURIN inhibitor. d. IF of HA-RKRR reporter in control or CPD KO H23 cells e. Ratios of ID4 to Flag signals relative to the control 1D4-RKRR or to the control HA-RKRR for conditions in c and d. *P=1.38E-39 using two-sided t-test (n=19,30,18,12,20,21,18,18,18,18 from left to right, mean±s.d.) f. Schematic for the competitive tumor growth assay (see Methods). g. IF images of mCherry and GFP signal in Day30 tumor sections. 10x (larger images), 20x, inset. IF experiments repeated on two tumors/condition. h. Changes of mCherry/GFP ratios between Day0 and Day30 (see Methods). *P=4.3E-39, (n=8 tumors/group, two-sided t-test). Center lines, median; box limits, upper and lower quartiles; whiskers, 1.5x interquartile range; points, outliers. i. A Kaplan Meier (KM) plot of lung adenocarcinoma patients with high or low CPD expression. A median split was used and curve separation assessed by two-sided log-rank test (see Methods). n=1106, *P<0.0001 j. Variation of the set of genes downregulated by CPD deletion in H23 spheroids were scored by Gene Set Variation Analysis (CPD GSVA score, see Methods). KM plot for survival in 479 lung adenocarcinoma patients,divided into two groups with high or low CPD GSVA scores. Curve separation assessed by two-sided log-rank test (*P=9E-5) and Cox Proportional Hazard test (**P=7.68E-4). k. CPD deletion sensitizes H23 cells to ARS-853, a KRAS G12C inhibitor. H23 cells with control sgRNA or CPD sgRNA treated with indicated doses of ARS-853 for 72 hours in 2D or 3D. Live cells quantified using alamar blue (n=4, mean±s.e.m.).

References

    1. Garraway LA & Lander ES Lessons from the cancer genome. Cell 153, 17–37 (2013). - PubMed
    1. Khatib A-M et al. Inhibition of proprotein convertases is associated with loss of growth and tumorigenicity of HT-29 human colon carcinoma cells importance of insulin-like growth factor-1 (IGF-1) receptor processing in IGF-1-mediated functions. J. Biol. Chem 276, 30686–30693 (2001). - PubMed
    1. Unger C et al. Modeling human carcinomas: physiologically relevant 3D models to improve anti-cancer drug development. Adv. Drug Deliv. Rev 79–80, 50–67 (2014). - PubMed
    1. Siolas D & Hannon GJ Patient-derived tumor xenografts: transforming clinical samples into mouse models. Cancer Res. 73, 5315–5319 (2013). - PMC - PubMed
    1. Sharpless NE & Depinho RA The mighty mouse: genetically engineered mouse models in cancer drug development. Nat. Rev. Drug Discov. 5, 741–754 (2006). - PubMed

REFERENCES FOR METHODS

    1. Lawrence MS et al. Discovery and saturation analysis of cancer genes across 21 tumour types. Nature 505, 495–501 (2014). - PMC - PubMed
    1. Nepusz T, Yu H & Paccanaro A. Detecting overlapping protein complexes in protein-protein interaction networks. Nat. Methods 9, 471–472 (2012). - PMC - PubMed
    1. Storey JD & Tibshirani R. Statistical significance for genomewide studies. Proc. Natl. Acad. Sci. U. S. A. 100, 9440–9445 (2003). - PMC - PubMed
    1. Mi H, Muruganujan A & Thomas PD PANTHER in 2013: modeling the evolution of gene function, and other gene attributes, in the context of phylogenetic trees. Nucleic Acids Res. 41, D377–86 (2013). - PMC - PubMed
    1. Bray NL, Pimentel H, Melsted P & Pachter L. Erratum: Near-optimal probabilistic RNA-seq quantification. Nat. Biotechnol. 34, 888 (2016). - PubMed

MeSH terms