. 2020 Apr;580(7801):106-112.
doi: 10.1038/s41586-020-2139-6. Epub 2020 Mar 25.

Centrosome anchoring regulates progenitor properties and cortical formation

Affiliations

Centrosome anchoring regulates progenitor properties and cortical formation

Wei Shao et al. Nature. 2020 Apr.

Abstract

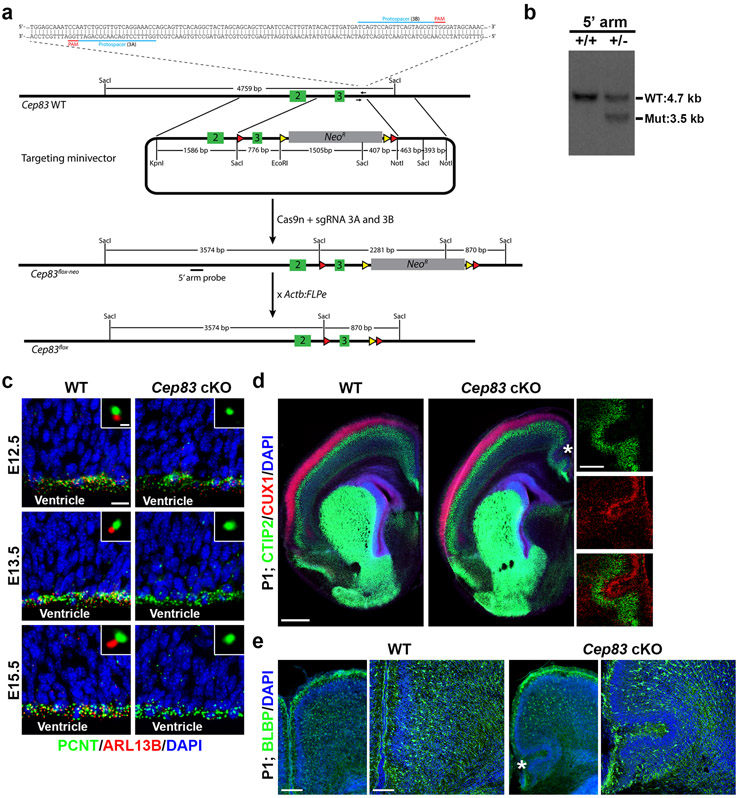
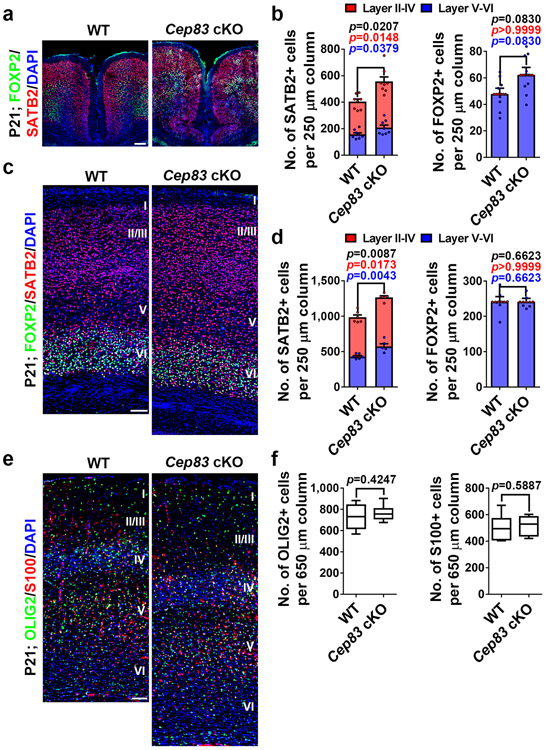
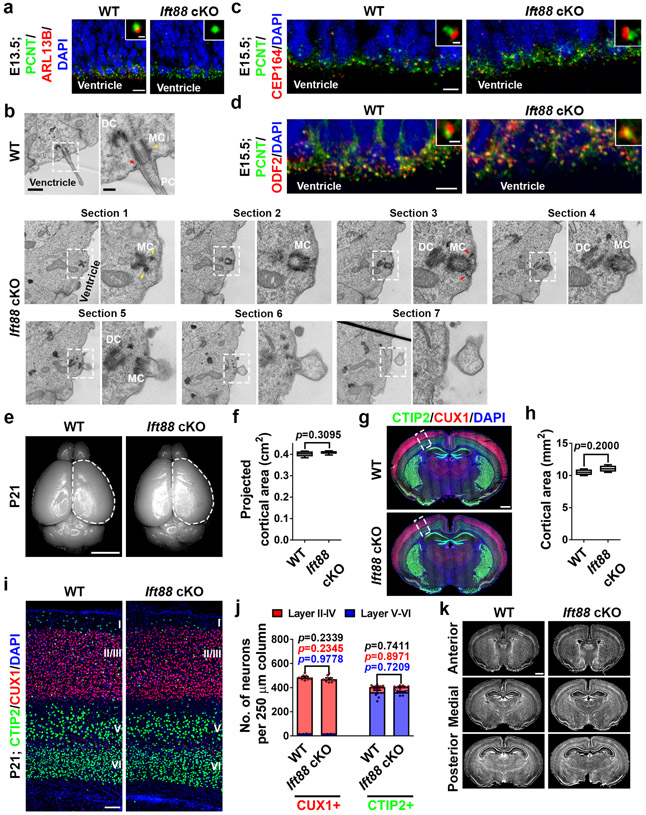
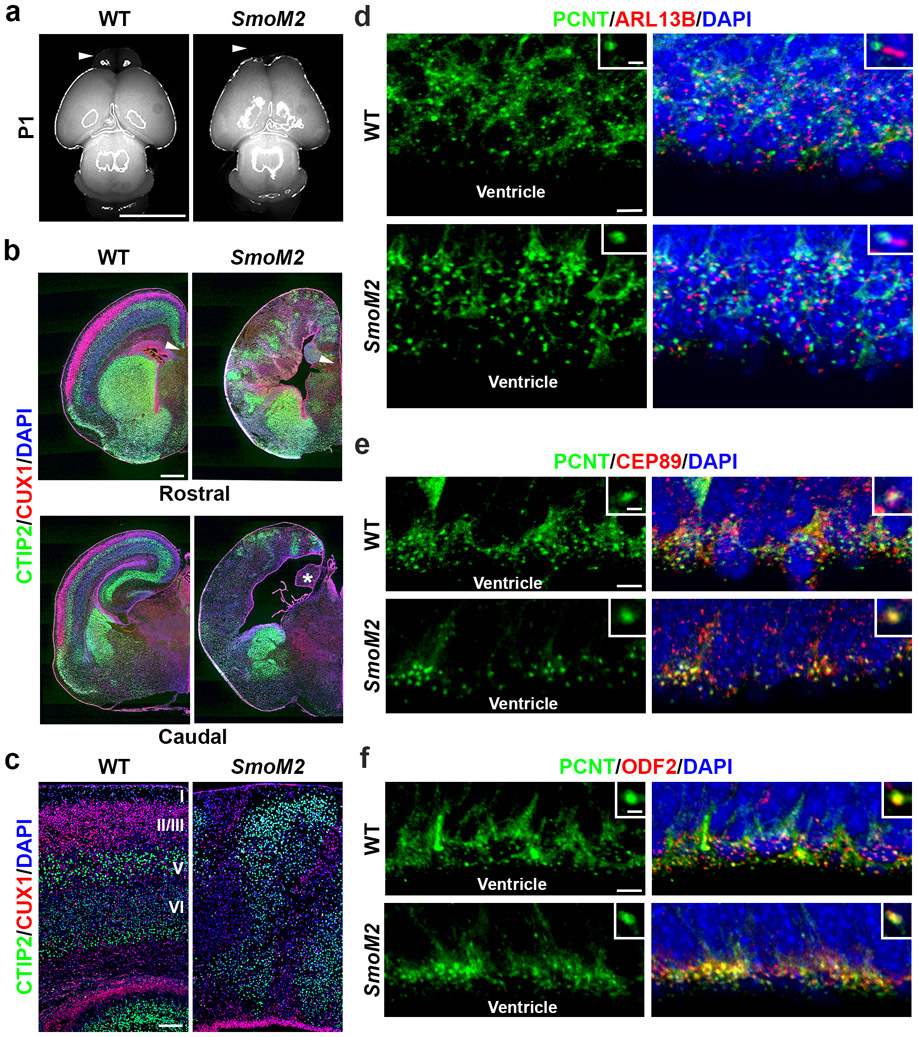
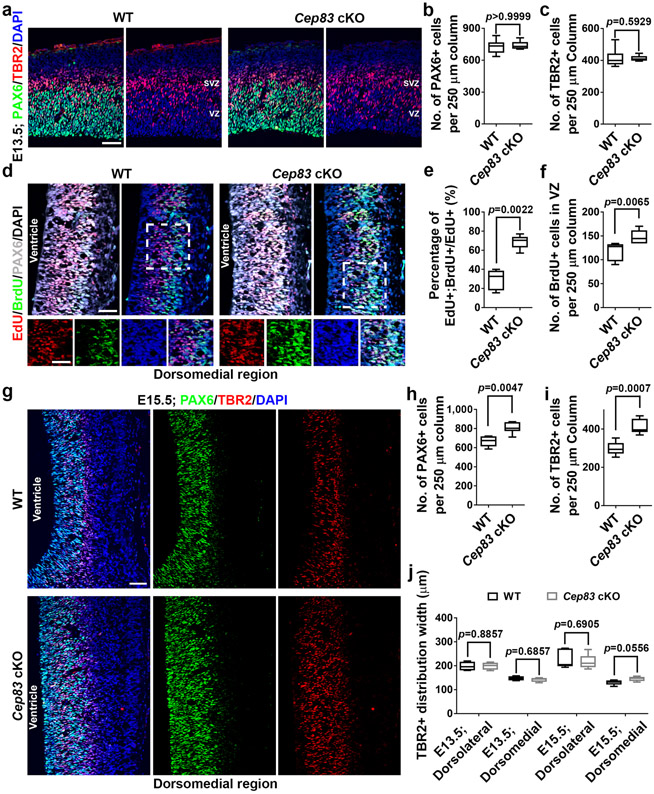
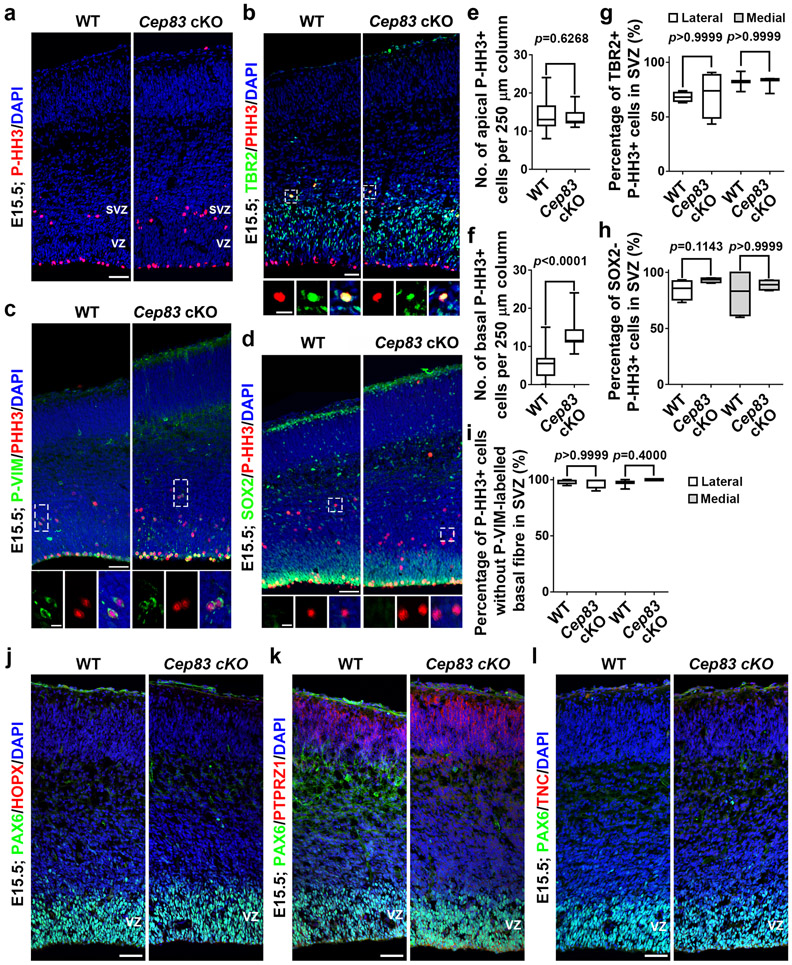
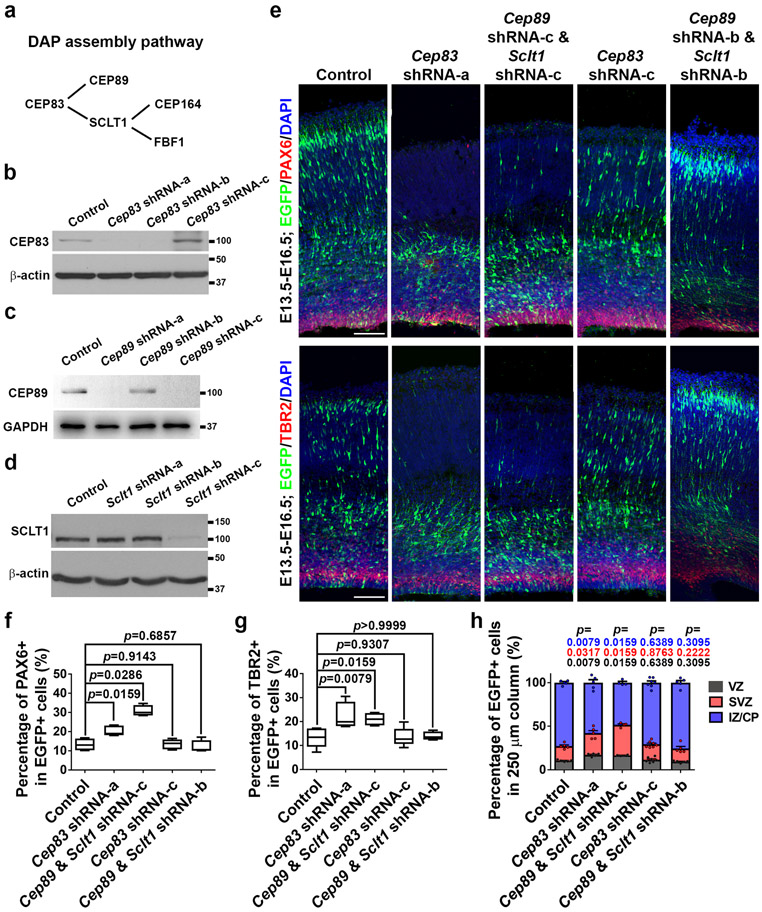
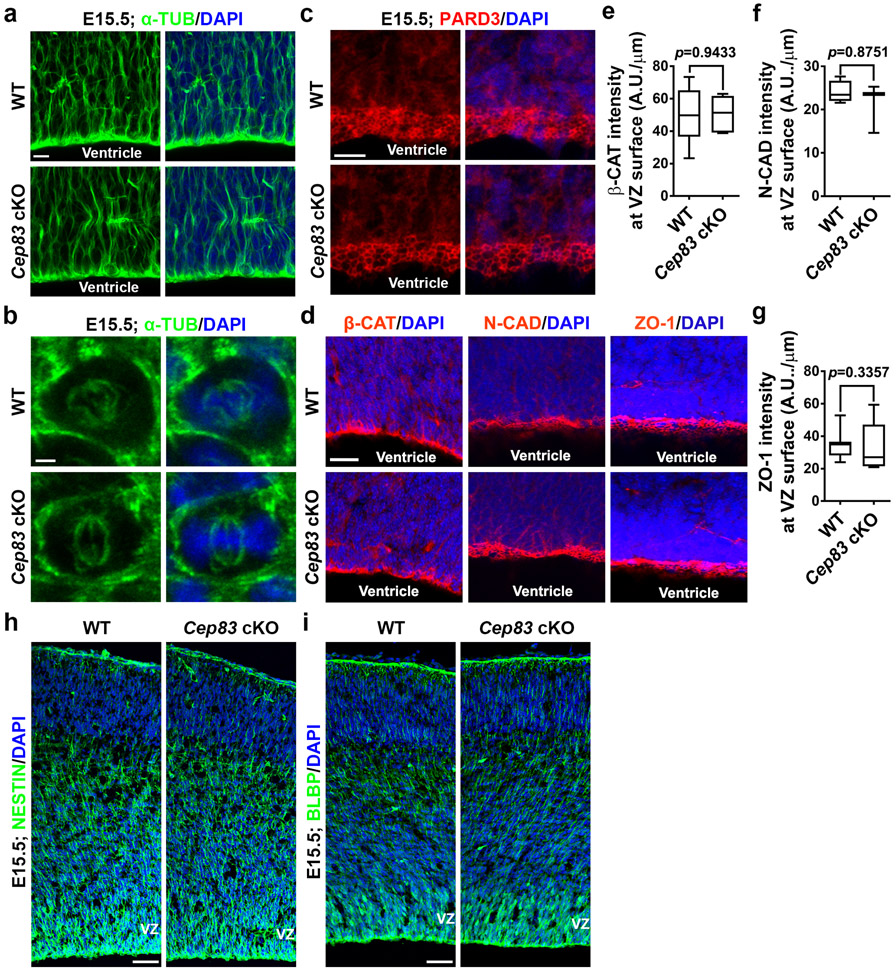
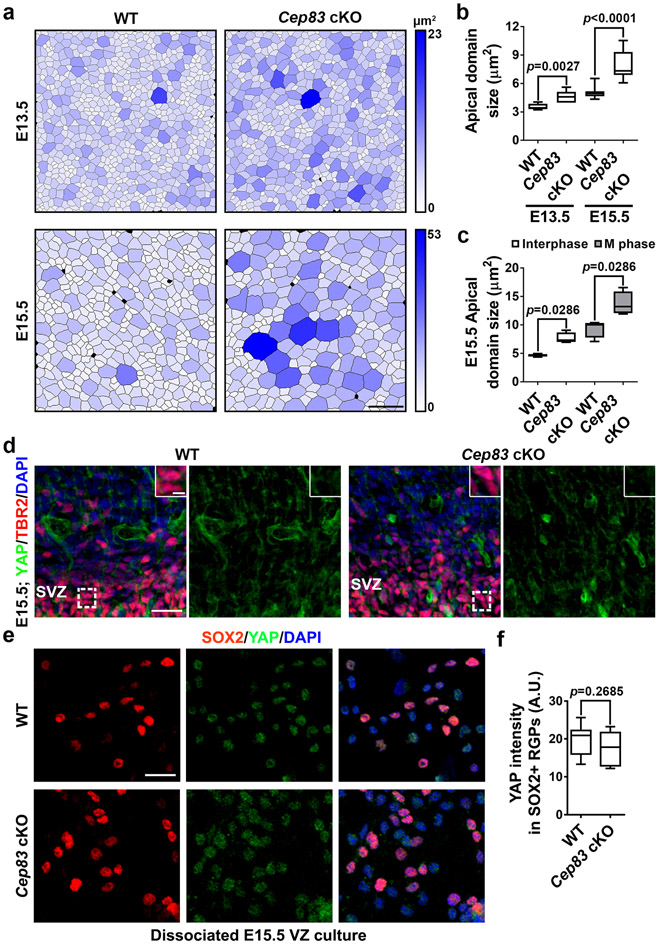
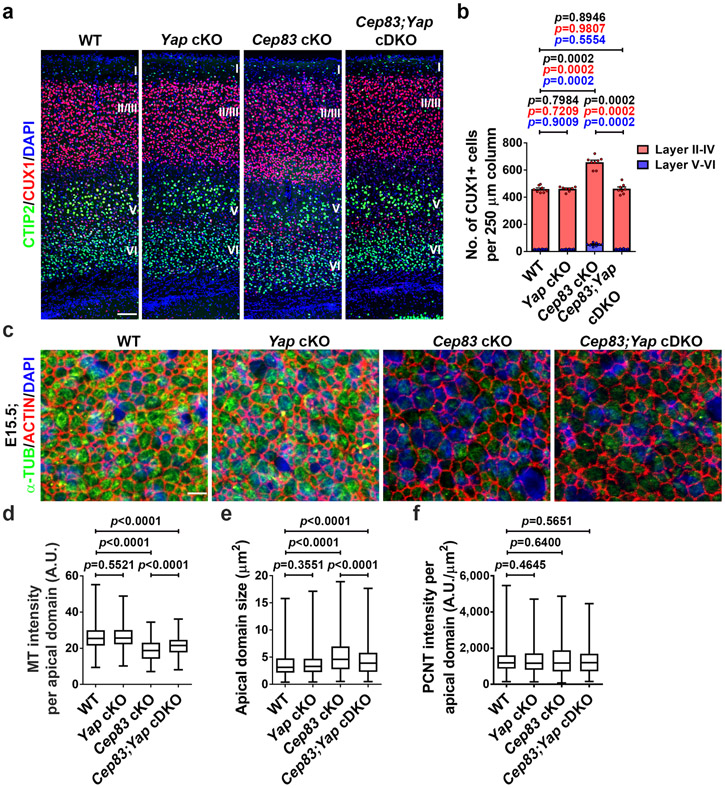
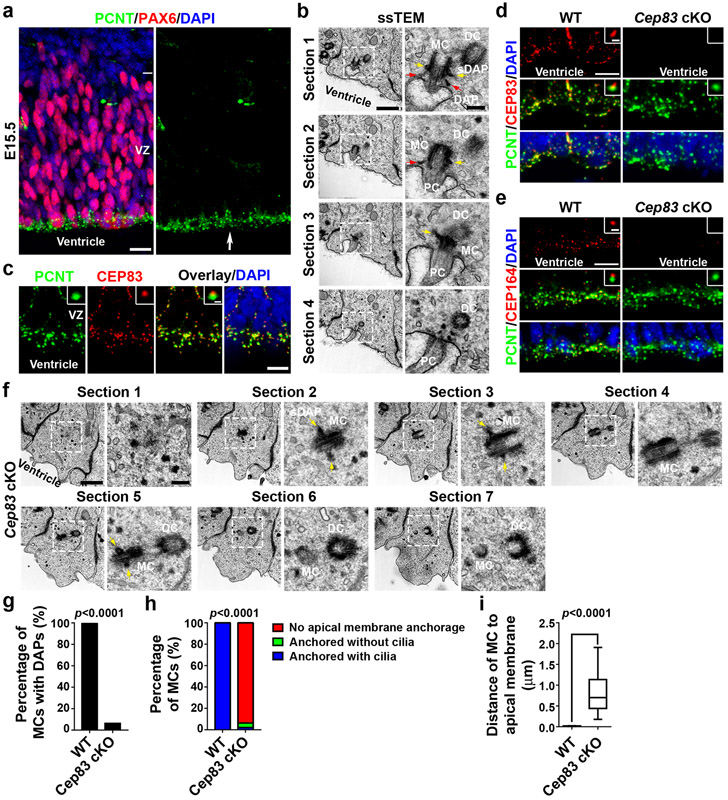
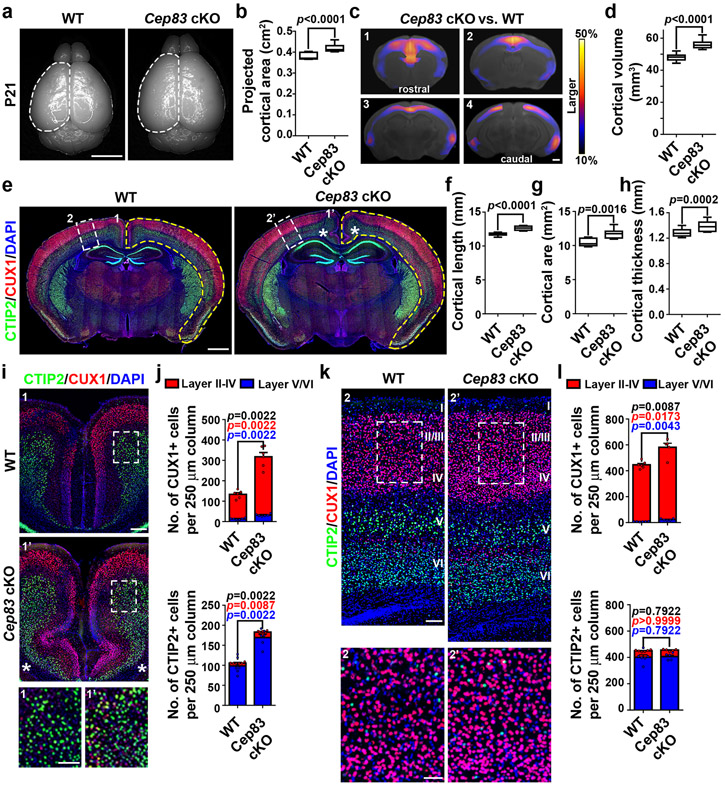
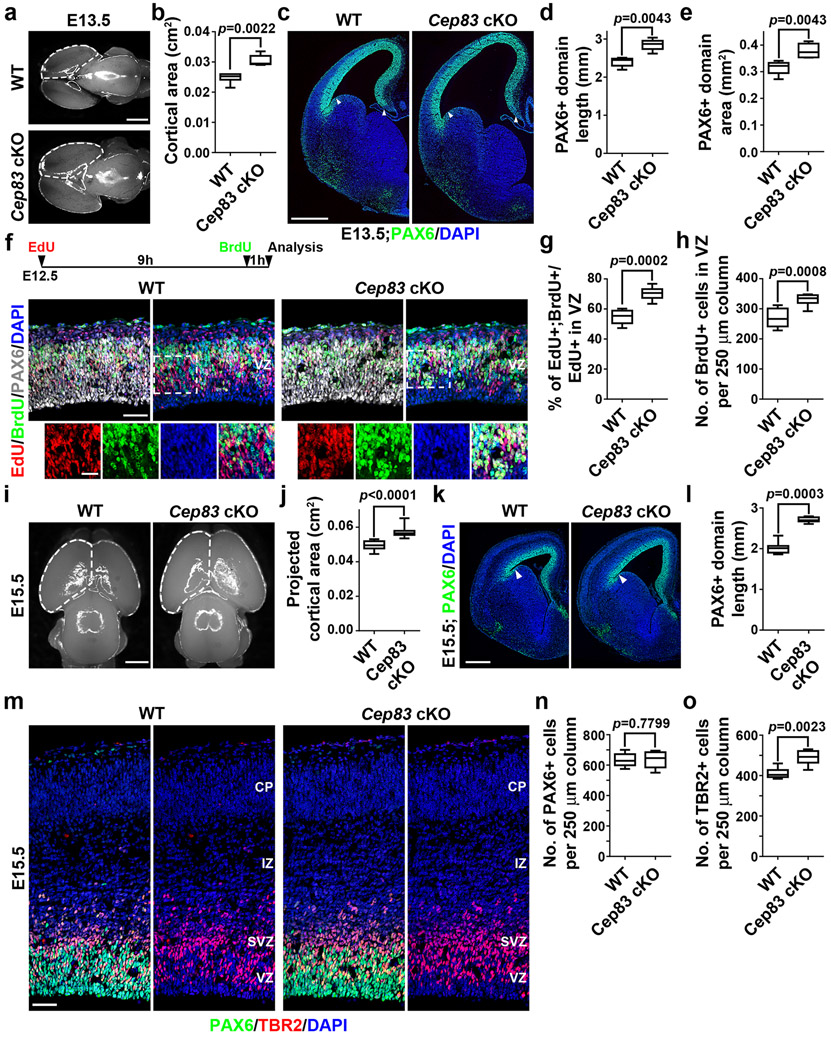
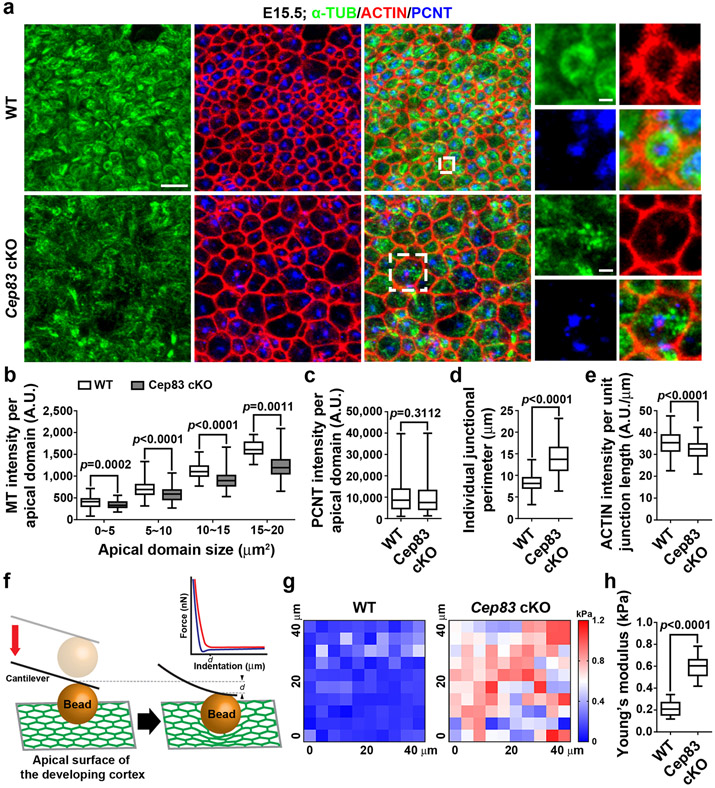
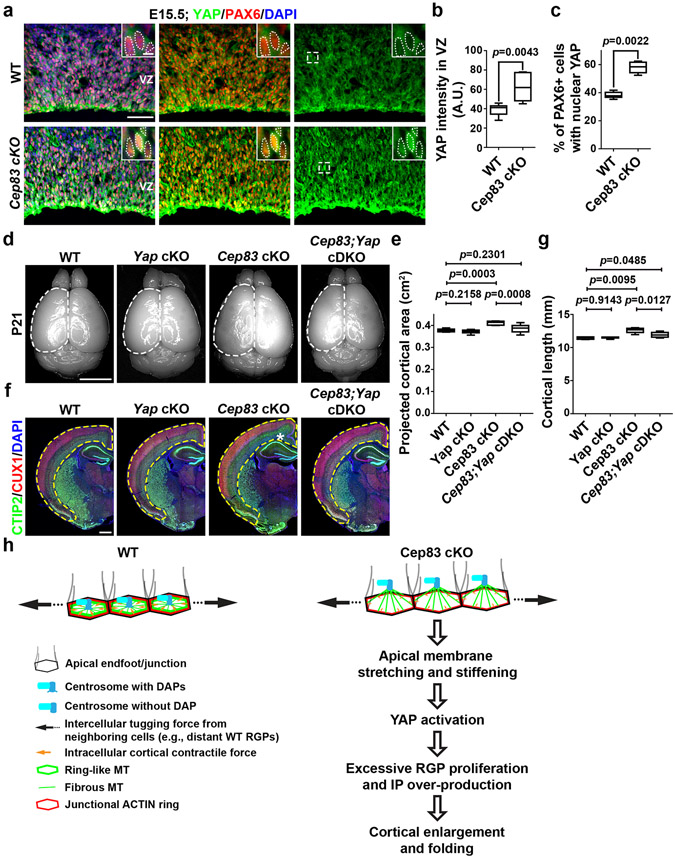
Radial glial progenitor cells (RGPs) are the major neural progenitor cells that generate neurons and glia in the developing mammalian cerebral cortex1-4. In RGPs, the centrosome is positioned away from the nucleus at the apical surface of the ventricular zone of the cerebral cortex5-8. However, the molecular basis and precise function of this distinctive subcellular organization of the centrosome are largely unknown. Here we show in mice that anchoring of the centrosome to the apical membrane controls the mechanical properties of cortical RGPs, and consequently their mitotic behaviour and the size and formation of the cortex. The mother centriole in RGPs develops distal appendages that anchor it to the apical membrane. Selective removal of centrosomal protein 83 (CEP83) eliminates these distal appendages and disrupts the anchorage of the centrosome to the apical membrane, resulting in the disorganization of microtubules and stretching and stiffening of the apical membrane. The elimination of CEP83 also activates the mechanically sensitive yes-associated protein (YAP) and promotes the excessive proliferation of RGPs, together with a subsequent overproduction of intermediate progenitor cells, which leads to the formation of an enlarged cortex with abnormal folding. Simultaneous elimination of YAP suppresses the cortical enlargement and folding that is induced by the removal of CEP83. Together, these results indicate a previously unknown role of the centrosome in regulating the mechanical features of neural progenitor cells and the size and configuration of the mammalian cerebral cortex.


Figures

Extended Data Fig. 1:
Extended Data Fig. 1:. Cep83 deletion in cortical RGPs.
(a) Schematic diagram of the Cep83 conditional knockout mouse generation using CRISPR/Cas9-mediated double nicking strategy. The DNA sequence at the top depicts the sites targeted by a pair of guide RNAs (outlined in blue) downstream of the critical exon 3 in the Cep83 gene. Green boxes represent exons, red triangles represent LoxP sites, and yellow triangles represent FRT sites. NeoR, Neomycin resistance gene cassette. (b) Representative southern blot image showing the correct gene targeting against the 5’ homology arm of Cep83 floxed allele with the presence of deletion-specific 3.5 kb band (n = 3). (c) Representative images of WT and Cep83 cKO cortices at E12.5, E13.5 and E15.5 stained for PCNT (green) and ARL13B (red), a primary cilium marker, and with DAPI (blue) (n = 3). High magnification images of individual centrosomes are shown in the insets. Note the loss of primary cilia in the Cep83 cKO cortex by E13.5. Scale bars: 10 μm and 1 μm. (d) Representative images of P1 WT (n = 11) and Cep83 cKO (n = 12) cortices stained for CTIP2 (green) and CUX1 (red), and with DAPI (blue). The asterisk indicates the folding in the medial region of the Cep83 cKO cortex. High magnification images of the folding are shown to the right. Scale bars: 500 μm and 200 μm. (e) Representative images of P1 WT and Cep83 cKO cortices stained for Brain lipid-binding protein (BLBP, green) and DAPI (blue). High magnification images are shown to the right. Scale bars: 500 μm and 100 μm.
Extended Data Fig. 2:
Extended Data Fig. 2:. Cep83 deletion in RGPs leads to increased neurogenesis and gliogenesis.
(a) Representative images of the medial regions of P21 WT and Cep83 cKO cortices stained for FOXP2 (green) and SATB2 (red), and with DAPI (blue). Scale bar: 100 μm. (b) Quantification of the numbers of SATB2+ (left) and FOXP2+ (right) neurons per 250 μm column. WT, n = 8 brains, cKO, n = 8 brains. (c) Representative images of the dorsal regions of P21 WT and Cep83 cKO cortices stained for FOXP2 (green) and SATB2 (red), and with DAPI (blue). Scale bar: 100 μm. (d) Quantification of the number of SATB2+ (left) and FOXP2+ (right) neurons per 250 μm column. WT, n = 6 brains; cKO, n = 5 brains. (e) Representative images of P21 WT and Cep83 cKO cortices stained for OLIG2 (green), an oligodendrocyte marker, and S100 (red), an astrocyte marker, and with DAPI (blue). Scale bar: 100 μm. (f) Quantification of the numbers of OLIG2+ oligodendrocytes (n = 10 regions from 5 brains for each genotype) and S100+ astrocytes (n = 6 regions from 3 brains for each genotype) per 650 μm column. Data are shown as mean + SEM. Statistical analysis was performed using two-sided Mann-Whitney-Wilcoxon test.
Extended Data Fig. 3:
Extended Data Fig. 3:. Ift88 deletion in RGPs does not lead to any obvious defect in centrosome appendages and membrane anchorage or cortical development.
(a) Representative images of E13.5 WT and Ift88 cKO VZ surfaces stained for PCNT (green) and ARL13B (red), and with DAPI (blue) (n = 3). High magnification images of individual centrosomes are shown as the insets. Note the complete loss of primary cilia in the Ift88 cKO cortex by E13.5. Scale bars: 10 μm and 1 μm. (b) Representative ssTEM images of E15.5 WT (top) and Ift88 cKO (bottom) VZ surfaces showing individual centrosomes of RGPs in the apical endfoot. High magnification images (broken line squares) are shown to the right. Note that the Ift88 cKO mother centriole (MC) possesses the DAPs that are anchored at the apical membrane (red arrows) and the sDAPs (yellow arrows), but does not support any MT-based ciliary axoneme (WT, n = 9 centrosomes; Ift88 cKO, n = 20 centrosomes). All WT MCs were anchored to the apical membrane with MT-based cilia. All Ift88 cKO MCs were anchored to the apical membrane, but none possessed MT-based cilia. Scale bars: 800 nm and 200 nm. (c) Representative images of E15.5 WT and Ift88 cKO VZ surfaces stained for PCNT (green) and CEP164 (red), and with DAPI (blue) (n = 3). High magnification images of individual centrosomes are shown as the insets. Note the normal presence of CEP164 at the centrosome in the Ift88 cKO cortex. Scale bars: 10 μm and 0.5 μm. (d) Representative images of E15.5 WT (n = 6) and Ift88 cKO (n = 6) VZ surfaces stained for PCNT (green) and ODF2 (red), an sDAP marker, and with DAPI (blue). High magnification images of individual centrosomes are shown as the insets. Note the normal presence of ODF2 at the centrosome in the Ift88 cKO cortex. Scale bars: 5 μm and 1 μm. (e) Representative whole mount images of P21 WT and Ift88 cKO brains. Scale bar: 0.5 cm. (f) Quantification of the projected cortical area. N = 6 brains for each genotype. (g) Images of P21 WT and Ift88 cKO brain sections stained for CTIP2 (green) and CUX1 (red), and with DAPI (blue). Scale bar: 0.5 mm. (h) Quantification of the cortical area. WT, n = 4 brains; Ift88 cKO, n = 4 brains. (i) Images of the dorsal regions of P21 WT and Ift88 cKO cortices stained for CTIP2 (green) and CUX1 (red), and with DAPI (blue). Scale bar: 100 μm. (j) Quantification of the number of CUX1+ (left) and CTIP2+ (right) neurons per 250 μm column. N = 8 brains for each genotype. (k) Representative images of P21 WT and Ift88 cKO brain sections along the rostrocaudal axis stained with DAPI (grey) (n = 5). Note no obvious hydrocephalus in the Ift88 cKO brain. Scale bar: 1 mm. For box-whisker plots: centre line, median; box, interquartile range; whiskers, minimum and maximum. For bar charts, data are shown as mean + SEM. Statistical analysis was performed using two-sided Mann-Whitney-Wilcoxon test.
Extended Data Fig. 4:
Extended Data Fig. 4:. Expression of SmoM2 in RGPs leads to cortical dysplasia.
(a) Representative whole mount images of P1 WT and SmoM2 brains (n = 5). Arrowheads indicate the agenesis of olfactory bulb in the SmoM2 brain. Scale bar: 0.5 cm. (b) Representative images of P1 WT and SmoM2 brain sections stained for CTIP2 (green) and CUX1 (red), and with DAPI (blue) (n = 5). The arrowheads indicate the absence of corpus callosum in the SmoM2 brain. The asterisk indicates the agenesis of hippocampus in the SmoM2 brain. Scale bar: 0.5 mm. (c) Representative images of P1 WT and SmoM2 cortices stained for CTIP2 (green) and CUX1 (red), and with DAPI (blue) (n = 4). Note the drastic disorganization of the SmoM2 cortex. Scale bar: 100 μm. (d) Representative images of E15.5 WT and SmoM2 VZ surfaces stained for PCNT (green) and ARL13B (red), and with DAPI (blue) (n = 3). High magnification images of individual centrosomes are shown as the insets. Note the presence of the primary cilium at the SmoM2 centrosome. Scale bars: 5 μm and 1 μm. (e) Representative images of E15.5 WT and SmoM2 VZ surfaces stained for PCNT (green) and CEP89 (red), a DAP marker, and with DAPI (blue) (n = 3). High magnification images of individual centrosomes are shown as the insets. Note the normal presence of CEP89 at the SmoM2 centrosome. Scale bars: 5 μm and 1 μm. (f) Representative images of E15.5 WT and SmoM2 VZ surfaces (n= 5) stained for PCNT (green) and ODF2 (red), and with DAPI (blue) (n = 3). High magnification images of individual centrosomes are shown in the insets. Note the normal presence of ODF2 at the SmoM2 centrosome. Scale bars: 5 μm and 1 μm.
Extended Data Fig. 5:
Extended Data Fig. 5:. Cep83 deletion does not affect the densities of RGPs and IPs at E13.5, but leads to increased densities of RGPs and IPs in the dorsomedial cortex at E15.5.
(a) Representative images of E13.5 WT and Cep83 cKO cortices stained for PAX6 (green) and TBR2 (red), and with DAPI (blue). Scale bar: 50 μm. (b, c) Quantification of the number of PAX6+ (b) and TBR2+ (c) cells per 250 μm column in a. WT, n = 8 brains; Cep83 cKO, n = 8 brains. (d) Images of E12.5 WT and Cep83 cKO cortices (dorsomedial region) subjected to EdU (red) and BrdU (green) sequential pulse chase labelling, stained for PAX6 (white), and with DAPI (blue). High magnification images (broken line squares) are shown at the bottom. Scale bars: 50 μm. (e, f) Quantification of the percentage of EdU+;BrdU+ cells among the total EdU+ cells in the VZ (e) and the number of BrdU+ cells in the VZ per 250 μm column (f). WT, n = 6 brains; Cep83 cKO, n = 6 brains. (g) Images of E15.5 WT and Cep83 cKO cortices (dorsomedial region) stained for PAX6 (green) and TRB2 (red), and with DAPI (blue). Scale bar: 50 μm. (h, i) Quantification of the number of PAX6+ (h) or TBR2+ (i) cells per 250 μm column. WT, n = 8 brains; Cep83 cKO, n = 6 brains. (j) Quantification of the distribution width of TBR2+ cells in the WT or Cep83 cKO cortices. E13.5, n = 4 brains for each genotype; E15.5, n = 5 brains for each genotype. For box-whisker plots: centre line, median; box, interquartile range; whiskers, minimum and maximum. Statistical analysis was performed using two-sided Mann-Whitney-Wilcoxon test.
Extended Data Fig. 6:
Extended Data Fig. 6:. Increased mitotic cells in the SVZ of the Cep83 cKO cortex are predominantly IPs.
(a) Images of E15.5 WT and Cep83 cKO cortices stained for P-HH3 (red), a mitotic cell marker, and with DAPI (blue). Scale bar: 50 μm. (b, d) Images of E15.5 WT and Cep83 cKO cortices stained for P-HH3 (red) and TBR2 (green, d) or SOX2 (green, f), an RGP marker, and with DAPI (blue). High magnification images of individual P-HH3+ cells are shown at the bottom. Note that P-HH3+ cells in the SVZ of the Cep83 cKO cortex are predominantly TBR2+, but SOX2. Scale bars: 25 μm and 10 μm. (c) Images of E15.5 WT and Cep83 cKO cortices stained for P-HH3 (red) and phospho-VIMENTIN (P-VIM, green), and with DAPI (blue). High magnification images of individual P-HH3+ cells are shown at the bottom. Scale bars: 50 μm and 10 μm. (e, f) Quantification of the number of apical (e) and basal (f) P-HH3+ cells per 250 μm column. WT, n = 16 brains; Cep83 cKO, n = 14 brains. (g, h) Quantification of the percentage of P-HH3+ cells in the SVZ that are TBR2+ (g; lateral: n = 4 brains for each genotype; medial: n = 3 brains for each genotype) or SOX2 (h; n = 4 brains for each genotype). (i) Quantification of the percentage of P-HH3+ cells without a P-VIM labelled basal radial glial fibre (lateral: n = 4 brains for each genotype; medial: n = 3 brains for each genotype). (j-l) Representative images of E15.5 WT and Cep83 cKO cortices stained for PAX6 (green) and HOPX (red, j), PTPRZ1 (red, k), or TNC (red, l), three previously suggested oRG markers, and with DAPI (blue) (n = 4). Note no obvious increase in HOPX, PTPRZ1, or TNC expression in the Cep83 cKO cortex and low expression in both WT and Cep83 cKO cortices. Scale bars: 50 μm. For box-whisker plots: centre line, median; box, interquartile range; whiskers, minimum and maximum. Statistical analysis was performed using two-sided Mann-Whitney-Wilcoxon test.
Extended Data Fig. 7:
Extended Data Fig. 7:. Disruption of other DAP assembly pathway components leads to excessive production of RGPs and IPs.
(a) Diagram of the hierarchical DAP assembly pathway. (b-d) Western blot assays on the efficacy of Cep83 (b), Cep89 (c), or Sclt1 (d) shRNAs on suppressing protein expression (n = 3). (e) Representative images of E16.5 cortices that received in utero electroporation of EGFP (green) together with Cep83 or Cep89/Sclt1 shRNAs at E13.5 and stained for PAX6 (red, top) and TBR2 (red, bottom), and with DAPI (blue). Note that expression of Cep83 shRNA-a which effectively suppresses protein expression but not Cep83 shRNA-c that does not suppress protein expression leads to a significant increase in both PAX6+ RGPs in the VZ and TBR2+ IPs in the SVZ. Moreover, expression of Cep89 shRNA-c and Sclt1 shRNA-c that effectively suppress protein expression but not Cep89 shRNA-b and Sclt1 shRNA-b that do not suppress protein expression results in a similar increase in both PAX6+ RGPs and TBR2+ IPs. Scale bars: 100 μm. (f, g) Quantification of the percentage of EGFP+ cells that are PAX6+ (f) or TBR2+ (g). Note that similar to Cep83 cKO, both Cep83 shRNA-a and Cep89/Sclt1 shRNA-c, but not Cep83 shRNA-c or Cep89/Sclt1 shRNA-b, lead to a significant increase in PAX6+ RGPs and TBR2+ IPs, indicating that disruption of other DAP components causes an excessive production of RGPs and IPs, similar to CEP83 removal. Control, n = 4 (f) and 5 (g) brains; Cep83 shRNA-a, n = 5 brains; Cep89 & Sclt1 shRNA-c, n = 4 brains; Cep83 shRNA-c, n = 6 brains; Cep89 & Sclt1 shRNA-b, n = 4 brains. (h) Quantification of the percentage of EGFP+ cells in different cortical regions. Control, n = 5 brains; Cep83 shRNA-a, n = 5 brains; Cep89 & Sclt1 shRNA-c, n = 4 brains; Cep83 shRNA-c, n = 7 brains; Cep89 & Sclt1 shRNA-b, n = 5 brains. For box-whisker plots: centre line, median; box, interquartile range; whiskers, minimum and maximum. For bar charts, data are shown as mean + SEM. Statistical analysis was performed with two-sided Mann-Whitney-Wilcoxon test.
Extended Data Fig. 8:
Extended Data Fig. 8:. Centrosome apical membrane detachment does not disrupt RGP polarity, junction formation, or radial glial fibre scaffolding.
(a) Representative images of E15.5 WT and Cep83 cKO cortices in coronal section stained for α-TUB (green) and with DAPI (blue) (n = 3). Note no obvious difference in non-apical membrane MTs in the WT and Cep83 cKO cortices. Scale bar: 10 μm. (b) Representative en face images of mitotic RGPs in E15.5 WT and Cep83 cKO cortices stained for α-TUB (green) and with DAPI (blue) (n = 12). Note no obvious difference in MT spindles in the WT and Cep83 cKO RGPs. Scale bar: 2 μm. (c) Representative images of E15.5 WT and Cep83 cKO cortices stained for Partition defective protein 3 (PARD3, red), an evolutionarily conserved polarity protein, and with DAPI (blue) (n = 3). Scale bar: 10 μm. (d) Representative images of E15.5 WT and Cep83 cKO cortices stained for β-CATENIN (β-CAT, red, left), N-CADHERIN (N-CAD, red, middle), or ZO-1 (red, right), three junction markers, and with DAPI (blue). Scale bar: 50 μm. (e-g) Quantification of the staining intensity of β-CAT (e; WT, n = 8 brains; cKO, n = 5 brains for each genotype), N-CAD (f; WT, n = 4 brains; cKO, n = 3 brains), or ZO-1 (g; WT, n= 8 brains; cKO, n = 7 brains) at the VZ surface. A.U., arbitrary unit. (h, i) Representative images of E15.5 WT and Cep83 cKO cortices stained for NESTIN (h) or BLBP (i) (green), and with DAPI (blue) (n = 5). Scale bars: 50 μm. For box-whisker plots: centre line, median; box, interquartile range; whiskers, minimum and maximum. Statistical analysis was performed using two-sided Mann-Whitney-Wilcoxon test.
Extended Data Fig. 9:
Extended Data Fig. 9:. Centrosome detachment leads to apical membrane enlargement and nuclear expression of YAP is low in TBR2+ IPs and dissociated RGPs in culture.
(a) Representative en face segmented images of WT and Cep83 cKO VZ surface at E13.5 and E15.5. Each apical domain is colour-coded based on its size. Blue colour indicates a relatively larger apical domain. Scale bar: 10 μm. (b) Quantification of the apical domain size of WT and Cep83 cKO RGPs at E13.5 and E15.5. For E13.5 samples, WT, n = 5,038 apical domains from 8 embryos; Cep83 cKO, n = 2,891 apical domains from 6 embryos. For E15.5 samples, WT, n = 4,780 apical domains from 12 embryos; Cep83 cKO, n = 1,959 apical domains from 8 embryos. (c) Quantification of the apical domain size of interphase and mitotic WT and Cep83 cKO RGPs at E15.5. WT, n = 1,703 interphase apical domains and n = 145 mitotic apical domains from 4 embryos; Cep83 cKO, n = 988 interphase apical domains and n = 83 mitotic apical domains from 4 embryos. (d) Representative images of the SVZ of E15.5 WT and Cep83 cKO cortices stained for YAP (green) and TBR2 (red), and for DAPI (blue) (n = 5). Individual TBR2+ IPs are shown as the insets. Note the low expression of YAP in the nuclei of TBR2+ IPs in the SVZ of the WT and Cep83 cKO cortices. Scale bars: 50 μm and 5 μm. (e) Representative images of acute dissociated cell culture of E15.5 WT and Cep83 cKO cortical VZ stained for SOX2 (red) and YAP (green), and with DAPI (blue). Scale bar: 20 μm. (f) Quantification of the YAP staining intensity in SOX2+ RGPs. A.U., arbitrary unit. WT, n = 13 brains; cKO, n = 8 brains. For box-whisker plots: centre line, median; box, interquartile range; whiskers, minimum and maximum. Statistical analysis was performed using two-sided Mann-Whitney-Wilcoxon test.
Extended Data Fig. 10:
Extended Data Fig. 10:. Excessive neurogenesis in the Cep83 cKO cortex depends on excessive YAP activation.
(a) Representative high magnification images of P21 WT, Yap cKO, Cep83 cKO, and Cep83;Yap cDKO cortices stained for CTIP2 (green) and CUX1 (red), and with DAPI (blue). Scale bar: 100 μm. (b) Quantification of the number of CUX1+ neurons per 250 μm column. N = 8 brains for each genotype. (c) Representative en face images of coronal sections of E15.5 WT, Yap cKO, Cep83 cKO, and Cep83;Yap cDKO cortices stained for α-TUB (green) and ACTIN (red), and with DAPI (blue). Scale bar: 5 μm. (d-f) Quantification of the intensity of MT (d) per apical domain, individual apical domain size (e), and the intensity of PCNT per apical domain (f). A.U., arbitrary unit. WT, n = 1,730 apical domains from 4 embryos; Yap cKO, n = 1,074 apical domains from 3 embryos, Cep83 cKO, n = 456 apical domains from 3 embryos; Cep83;Yap cDKO, n = 540 apical domains from 3 embryos. For bar charts, data are shown as mean + SEM. For box-whisker plots: centre line, median; box, interquartile range; whiskers, minimum and maximum. Statistical analysis was performed with two-sided Mann-Whitney-Wilcoxon test.
Fig. 1:
Fig. 1:. Cep83 deletion disrupts DAPs and centrosome membrane anchorage.
(a) Representative images of E15.5 cortex stained for PAX6 (red) and PCNT (green), and with DAPI (blue) (n = 5). Scale bar: 25 μm. (b) Representative ssTEM images of E15.5 cortical VZ surface. Scale bars: 800 nm and 200 nm. (c) Representative images of E15.5 cortex stained for PCNT (green) and CEP83 (red), and with DAPI (blue) (n = 3). Scale bars: 10 μm and 1 μm. (d) Representative images of E15.5 WT and Cep83 cKO VZ surface stained for PCNT (green) and CEP83 (red), and with DAPI (blue). Scale bars: 10 μm and 1 μm. (e) Representative images of E15.5 WT and Cep83 cKO VZ stained for PCNT (green) and CEP164 (red), and with DAPI (blue) (n = 3). Scale bars: 10 μm and 1 μm. (f) Representative ssTEM images of E15.5 Cep83 cKO VZ surface. Scale bars: 800 nm and 200 nm. (g-i) Quantification of the percentage of MCs with DAPs (g), with primary cilia and/or membrane anchorage (h), or the distance of MC to the apical membrane (i) (WT, n = 11 centrosomes; cKO, n = 48 centrosomes). Data are represented as a box-whisker plot. Statistical analysis: Chi-square (g, h) or two-sided Mann-Whitney-Wilcoxon (i) test.
Fig. 2:
Fig. 2:. Centrosome apical membrane detachment leads to an enlarged cortex with abnormal folding.
(a) Representative whole mount images of P21 WT and Cep83 cKO brains. Scale bar: 0.5 cm. (b) Quantification of the projected cortical area (WT, n = 13 brains; cKO, n = 11 brains). (c) MRI images of P21 WT and Cep83 cKO brains along the rostrocaudal axis (1-4). Warmer colours indicate larger difference. FDR < 5%. Scale bar: 1 mm. (d) Quantification of P21 WT and Cep83 cKO cortical volumes (N = 7 brains/14 hemispheres for each genotype). (e) Representative images of P21 WT and Cep83 cKO brain sections stained for CTIP2 (green) and CUX1 (red), and with DAPI (blue). Yellow broken outlines delineate the total cortical area. Asterisks indicate the abnormal cortical folding in the medial region (1 and 1’) shown in i. White broken rectangles indicate a dorsal region (2 and 2’) shown in k. Scale bar: 1 mm. (f-h) Quantification of the cortical lengths (f), areas (g), and thicknesses (h) (WT, n = 8 brains/16 hemispheres; cKO, n = 9 brains/18 hemispheres). (i, k) Representative images of the medial (i) or dorsal (k) region of P21 WT and Cep83 cKO cortices stained for CTIP2 (green) and CUX1 (red), and with DAPI (blue). Scale bars: 200 μm and 100 μm. (j, l) Quantification of the numbers of CUX1+ (top) and CTIP2+ (bottom) neurons per 250 μm column in the medial (j) or dorsal (l) region (WT, n = 6 brains; cKO, n = 5 brains). Statistical significance of the differences in the number of total (black), superficial (red), or deep (blue) layer neurons are shown. Bar charts: mean + SEM; Statistical analysis: two-sided Mann-Whitney-Wilcoxon test.
Fig. 3:
Fig. 3:. Centrosome apical membrane detachment leads to excessive RGP proliferation and additional increase in IP production.
(a) Representative whole mount images of E13.5 WT and Cep83 cKO brains. Scale bar: 1 mm. (b) Quantification of the projected cortical area (WT, n = 6 brains; cKO, n = 5 brains). (c) Representative images of E13.5 WT and Cep83 cKO cortices stained for PAX6 (green) and with DAPI (blue). Arrows indicate the boundaries of the PAX6+ domain. Scale bar: 0.5 mm. (d, e) Quantification of PAX6+ domain length (d) and area (e) (WT, n = 5 brains; cKO, n = 6 brains). (f) Representative images of E12.5 WT and Cep83 cKO cortices (dorsolateral region) subjected to EdU (red) and BrdU (green) sequential pulse chase labelling (top inset), stained for PAX6 (white) and with DAPI (blue). Scale bars: 50 μm and 25 μm. (g, h) Quantification of the percentage of EdU+;BrdU+ cells among the total EdU+ cells in the VZ (g) and the number of BrdU+ cells in the VZ per 250 μm column (h) (WT, n = 8 brains; cKO, n = 8 brains). (i) Representative whole mount images of E15.5 WT and Cep83 cKO brains. Scale bar: 1 mm. (j) Quantification of the projected cortical area (WT, n = 32 brains; cKO, n = 9 brains). (k) Representative images of E15.5 WT and Cep83 cKO brain sections stained for PAX6 (green) and with DAPI (blue). Scale bar: 0.5 mm. (l) Quantification of the PAX6+ domain length (WT, n = 8 brains; cKO, n = 7 brains). (m) Representative images of E15.5 WT and Cep83 cKO cortices (dorsolateral region) stained for PAX6 (green) and TRB2 (red), and with DAPI (blue). CP, cortical plate; IZ, intermediate zone; SVZ, subventricular zone. Scale bar: 50 μm. (n, o) Quantification of the number of PAX6+ (n) and TBR2+ (o) cells per 250 μm column (WT, n = 8 brains; cKO, n = 6 brains). Statistical analysis: two-sided Mann-Whitney-Wilcoxon test.
Fig. 4:
Fig. 4:. Centrosome detachment disrupts microtubule organization and results in apical membrane stretching and stiffening.
(a) Representative en face images of E15.5 WT and Cep83 cKO VZ surface stained for α-TUB (green), ACTIN (red), and PCNT (blue). Scale bars: 5 μm, 1 μm, and 2 μm. (b-e) Quantification of the intensity of MT (b) or PCNT (c) per apical domain, individual junctional perimeter (d), and the intensity of ACTIN per unit junctional length (e). A.U., arbitrary unit. WT, n = 478 (b), 361 (c), and 200(d, e) apical domains from 4 embryos; cKO, n = 443 (b), 258 (c), and 200 (d, e) apical domains from 4 embryos. (f) Schematic diagram illustrating the use of AFM to probe apical membrane stiffness. The indentation of the cantilever probe generates force-distance curves, including the approach curve (red) and the retraction curve (blue). d, indentation depth. (g) Representative heat maps of Young’s modulus reflecting the stiffness of E15.5 WT and Cep83 cKO VZ surfaces. kPa, kilopascal. (h) Quantification of Young’s Modulus of WT and Cep83 cKO VZ surfaces (WT, n = 10 sample areas; cKO, n= 9 sample areas; from 3 brains for each genotype). Statistical analysis: two-sided Mann-Whitney-Wilcoxon test.
Fig. 5:
Fig. 5:. Excessive YAP activation is essential for cortical enlargement and abnormal folding.
(a) Representative images of E15.5 WT and Cep83 cKO cortices stained for YAP (green) and PAX6 (red), and with DAPI (blue). Scale bars: 50 μm and 5 μm. (b, c) Quantification of YAP intensity (b) and the percentage of PAX6+ cells with nuclear YAP (c) in the VZ (n = 6 brains for each genotype). (d) Represenative whole mount images of P21 WT, Yap cKO, Cep83 cKO, and Cep83;Yap cDKO brains. Scale bar: 0.5 cm. (e) Quantification of the projected cortical area (WT, n = 8 brains; Yap cKO, n = 6 brains; Cep83 cKO, n = 7 brains; Cep83;Yap cDKO, n = 12 brains). (f) Representative images of P21 WT and Cep83 cKO brain sections stained for CTIP2 (green) and CUX1 (red), and with DAPI (blue). Scale bar: 1 mm. (g) Quantification of p21 WT, Yap cKO, Cep83 cKO, and Cep83;Yap cDKO cortical length (WT, n = 4 brains; Yap cKO, n = 6 brains; Cep83 cKO, n = 6 brains; Cep83;Yap cDKO, n = 8 brains). (h) A model diagram indicating the positioning and function of the centrosome in cortical RGPs. Statistical analysis: two-sided Mann-Whitney-Wilcoxon test.

References

    1. Florio M & Huttner WB Neural progenitors, neurogenesis and the evolution of the neocortex. Development 141, 2182–2194, doi:10.1242/dev.090571 (2014). - DOI - PubMed
    1. Homem CC, Repic M & Knoblich JA Proliferation control in neural stem and progenitor cells. Nat Rev Neurosci 16, 647–659, doi:10.1038/nrn4021 (2015). - DOI - PMC - PubMed
    1. Kriegstein A & Alvarez-Buylla A The glial nature of embryonic and adult neural stem cells. Annu Rev Neurosci 32, 149–184, doi:10.1146/annurev.neuro.051508.135600 (2009). - DOI - PMC - PubMed
    1. Wang X et al. Asymmetric centrosome inheritance maintains neural progenitors in the neocortex. Nature 461, 947–955, doi:10.1038/nature08435 (2009). - DOI - PMC - PubMed
    1. Tsai JW, Lian WN, Kemal S, Kriegstein AR & Vallee RB Kinesin 3 and cytoplasmic dynein mediate interkinetic nuclear migration in neural stem cells. Nat Neurosci 13, 1463–1471, doi:10.1038/nn.2665 (2010). - DOI - PMC - PubMed

MeSH terms

LinkOut - more resources