Comparative Study
. 2020 May;15(5):1649-1672.
doi: 10.1038/s41596-020-0300-1. Epub 2020 Apr 1.

Nanoscale imaging of clinical specimens using conventional and rapid-expansion pathology

Affiliations
Comparative Study

Nanoscale imaging of clinical specimens using conventional and rapid-expansion pathology

Octavian Bucur et al. Nat Protoc. 2020 May.

Abstract

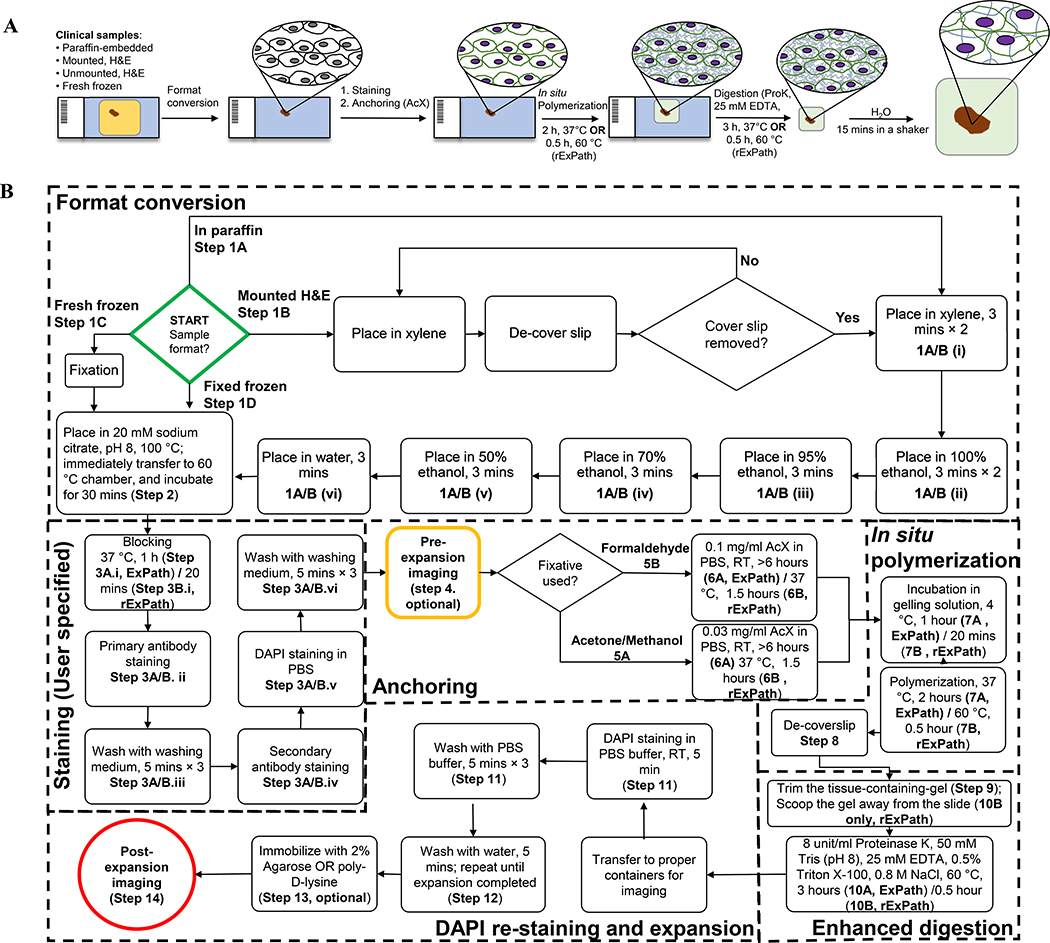
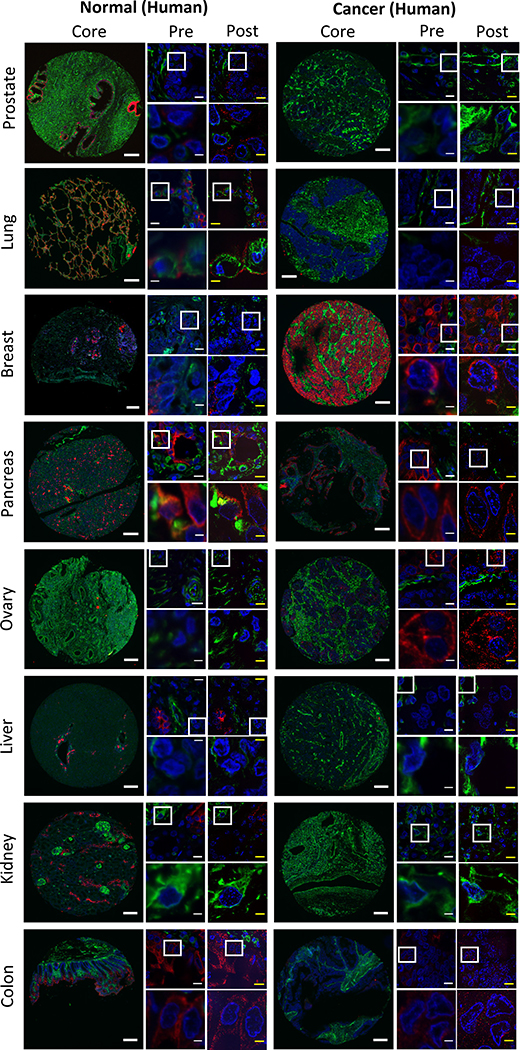
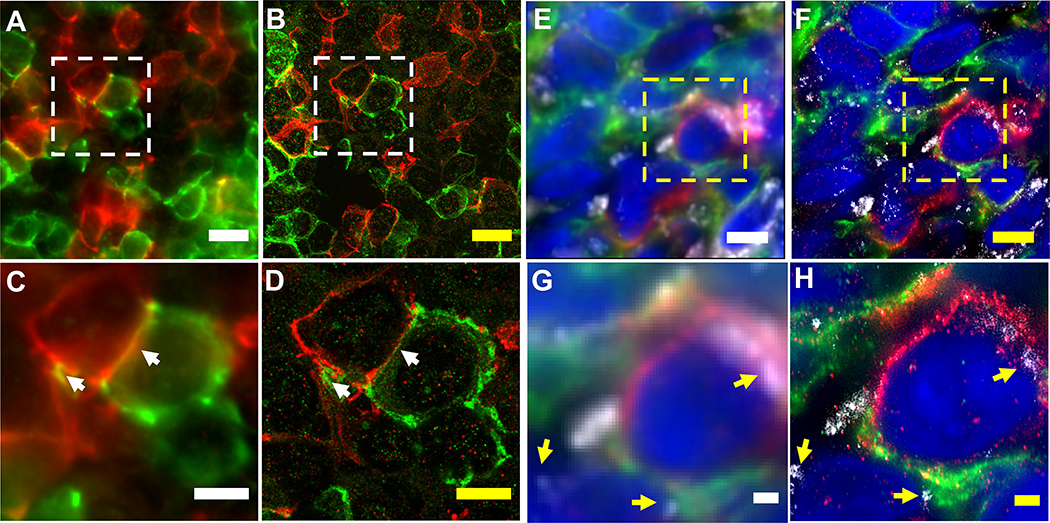
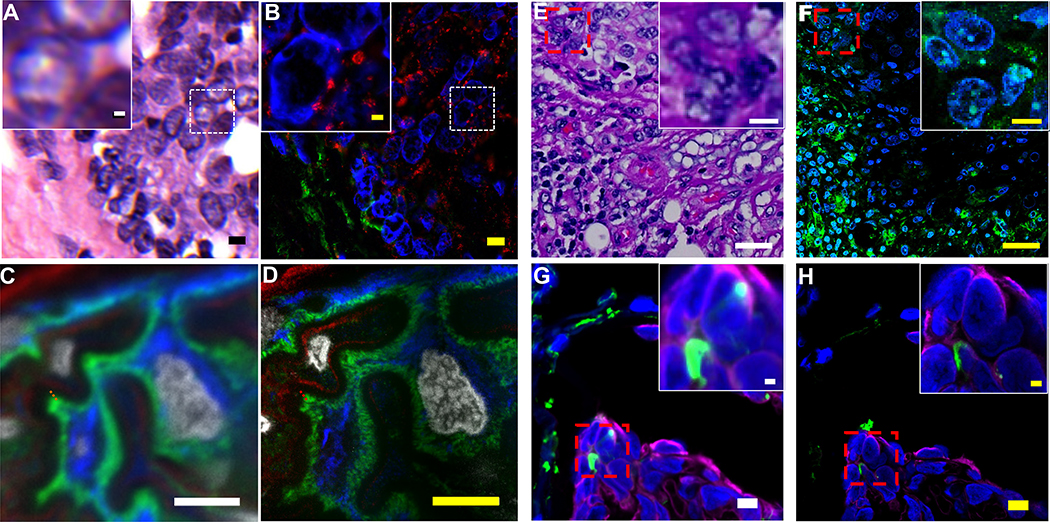
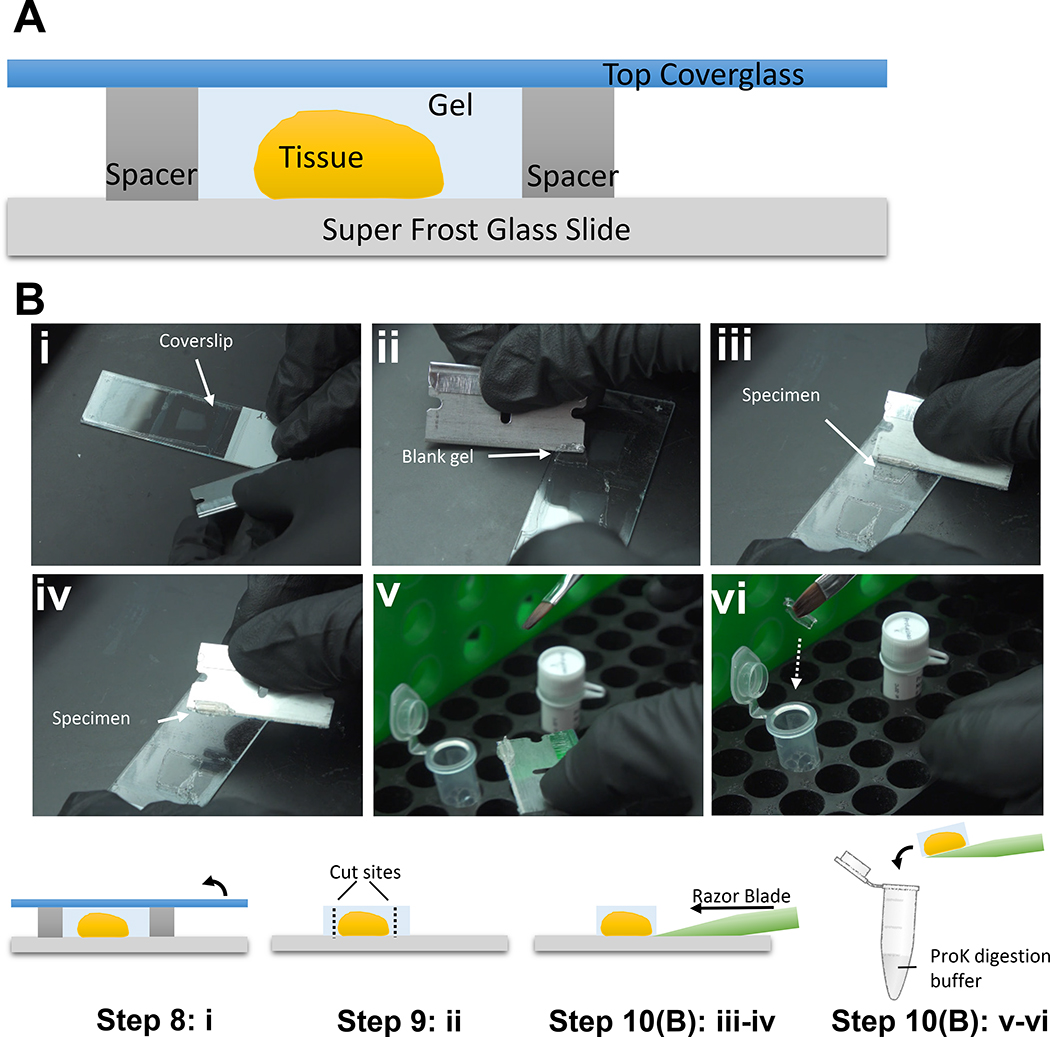
In pathology, microscopy is an important tool for the analysis of human tissues, both for the scientific study of disease states and for diagnosis. However, the microscopes commonly used in pathology are limited in resolution by diffraction. Recently, we discovered that it was possible, through a chemical process, to isotropically expand preserved cells and tissues by 4-5× in linear dimension. We call this process expansion microscopy (ExM). ExM enables nanoscale resolution imaging on conventional microscopes. Here we describe protocols for the simple and effective physical expansion of a variety of human tissues and clinical specimens, including paraffin-embedded, fresh frozen and chemically stained human tissues. These protocols require only inexpensive, commercially available reagents and hardware commonly found in a routine pathology laboratory. Our protocols are written for researchers and pathologists experienced in conventional fluorescence microscopy. The conventional protocol, expansion pathology, can be completed in ~1 d with immunostained tissue sections and 2 d with unstained specimens. We also include a new, fast variant, rapid expansion pathology, that can be performed on <5-µm-thick tissue sections, taking <4 h with immunostained tissue sections and <8 h with unstained specimens.


Conflict of interest statement

COMPETING FINANCIAL INTERESTS

The authors have filed and obtained patent protection on a subset of the technologies here described (US provisional application no. 62/299,754, 62/463,265 and 62/463,251). E.S.B. helped cofound a company to help disseminate expansion microscopy to the community. OB is the co-Founder and CEO of QPathology LLC, Boston, MA.

Figures

Figure 1.
Figure 1.. Workflows of conventional (ExPath) and rapid (rExPath) expansion pathology.
(A) Schematic of ExPath/rExPath workflow (details in B). (B) Detailed outline of ExPath/rExPath workflow. Symbols in bold, e.g. 1A/B(vi), refer to steps in the text.
Figure 2.
Figure 2.. Validation of conventional (ExPath) and rapid (rExPath) expansion pathology.
(A) Super-resolution structured illumination microscopy (SR-SIM) image of normal human breast tissue. Blue, DAPI; green, anti-vimentin; magenta, anti-keratin-19 (KRT19). (B) ExPath image of the specimen of A acquired with a spinning disk confocal microscope. (C and D) Root-mean square (RMS) length measurement error as a function of measurement length for ExPath vs SR-SIM images of human breast tissue (blue solid line, mean of DAPI channel; magenta solid line, mean of KRT19 channel; shaded area, standard error of the mean; n = 5 fields of view from specimens from 4 different patients. Average expansion factor: 4.0 (standard deviation (SD): 0.2)). Scale bars: (A) 10 μm; (B) 10 μm (scalebars of yellow indicates biological scale throughout; physical size post-expansion, 43 μm, expansion factor 4.3). Adapted from Ref. . (E) Stimulated emission depletion microscopy (STED) image of normal human breast tissue. Green, anti-vimentin; red, anti-voltage-dependent anion channel (VDAC). (F) rExPath image of the specimen of E acquired with a spinning disk confocal microscope. (G and H) RMS length measurement error as a function of measurement length for rExPath vs STED images of human breast tissue (green solid line, mean of vimentin channel; red solid line, mean of VDAC channel; shaded area, standard error of the mean; n = 3 fields of view from specimens from 3 different patients. Average expansion factor: 4.8 (SD: 1.0)). Scale bars: (E) 10 μm; (F) 10 μm (Physical size post-expansion, 50 μm, expansion factor 5.0). A-D are adapted from Ref. .
Figure 3.
Figure 3.. ExPath reduction of tissue autofluorescence.
(A) Photo of human kidney tissue sections before (on the left) and after expansion (on the right) with ExPath protocol. (B-G) Confocal images of normal human breast tissue, labeled with DAPI (blue) and antibodies against vimentin (green) and KRT19 (magenta), showing pre- (B-D) and post- (E-G) expansion data. (H) Signal-to-background ratio for pre-expansion (magenta), as well as post-expansion (green) states of n=3 samples of breast tissue from 3 patients. Average expansion factor: 4.1 (SD: 0.1). ** P<0.01, * P<0.1, two-tailed paired t-test. The ends of whiskers are defined by the SD; the upper and lower boundaries of the box are defined by the maximum and minimum, respectively; the segment in the rectangle indicates the median; the square symbol indicates the mean. The purple diamond-shaped dots indicate the individual data points. Scale bars (yellow indicates post-expansion image): (A) 15 mm. (B-D) 5 μm; (E-F) 5 μm (Physical size post-expansion, 18 μm; expansion factor 4.0). (B-H) Adapted from Ref. .
Figure 4.
Figure 4.. Comparison of ExPath and rExPath on adjacent human prostate FFPE tissue sections.
(A) Pre-expansion image of a normal human prostate FFPE tissue section acquired with a spinning disk confocal microscope. Blue, DAPI; Green, Vimentin; Magenta, VDAC. (B) ExPath image of the specimen of A acquired with the same confocal microscope. Expansion factor: 5.0. (C and D) Fields of view zoomed into the corresponding areas outlined by a dashed red box in A and B, respectively. (E) Pre-expansion image of a normal human prostate FFPE tissue section adjacent to that in (A) acquired with a spinning disk confocal microscope with the same staining and imaging parameters. (F) rExPath image of the specimen of E acquired with the same confocal microscope and same imaging parameters. Expansion factor: 5.0. (G and H) Fields of view zoomed into the corresponding areas outlined by a dashed red box in E and F, respectively. Scale bar (biological scale): 5 μm (A, B, E, and F); 1 μm (C, D, G, and H). All the scale bars are yellow in the images of expanded samples (B, D, F, and H).
Figure 5.
Figure 5.. ExPath and rExPath imaging of H&E-stained tissue sections and frozen tissue sections.
(A) Hematoxylin and eosin (H&E) stained human breast specimen with atypical ductal hyperplasia (ADH). Inset (upper left) is a magnified view of the area framed by the small dotted square. (B) ExPath widefield fluorescent image of the specimen of A, stained with antibodies against Hsp60 (magenta) and vimentin (green), and DAPI (blue). (C) Pre-expansion confocal image of a normal human kidney specimen (fresh frozen, fixed in acetone before processing) showing part of a glomerulus acquired with a spinning disk confocal microscope. Blue, vimentin; green, actinin-4; magenta, collagen IV; grey, DAPI. (D) ExPath image of the specimen of C, using the same microscope. (E) Hematoxylin and eosin (H&E) stained human breast specimen with atypical ductal hyperplasia (ADH). Inset (upper right) is a magnified view of the area framed by the small dotted red square. (F) rExPath widefield fluorescent image of the specimen of G, stained with antibodies against vimentin (green), and DAPI (blue). (G) Pre-expansion confocal image of a normal human lung specimen (fresh frozen, fixed in acetone before processing) acquired with a spinning disk confocal microscope. Inset (upper right) is a magnified view of the area framed by the small dotted red square. Blue, DAPI; green, vimentin; magenta, pan-cytokeratin. (H) rExPath image of the specimen of G, using the same microscope. Scale bars (biological scale): (A) 5 μm, inset 1 μm; (B) 5 μm, inset 1 μm (Physical size post-expansion, 23 μm; inset, 4.6 μm; expansion factor 4.6); (C) 5 μm; (D) 5 μm (Physical size post-expansion, 23.5 μm; expansion factor: 4.7); (E) 20 μm, inset 3.3 μm; (F) 20 μm, inset 3.3 μm (Physical size post-expansion: 80 μm, inset 13.2 μm; expansion factor 4.0); (G) 5 μm, inset 1 μm; (H) 5 μm, inset 1 μm (Physical size post-expansion: 25 μm, inset 5 μm; expansion factor 5.0). (A-D) Adapted from Ref. .
Figure 6.
Figure 6.. ExPath imaging of a wide range of human tissue types.
Images of various tissue types for both normal (left images) and cancerous (right images) tissues from human patients. From top to bottom, different rows show different tissue types as labeled (e.g., prostate, lung, breast, etc.). Within each block of images for a given tissue x disease type, there are 5 images shown. The leftmost of the 5 images shows a core from a tissue microarray (scale bar, 200 μm). The middle column within the 5 images shows two images, the top of which is a small field of view (scale bar, 10 μm), and the bottom of which zooms into the area outlined in the top image by a white box (scale bar, 2.5 μm). The right column within the 5 images shows the same fields of view as in the middle column, but post-expansion (yellow scale bars; top images, 10 – 12.5 μm; bottom images, 2.5 – 3.1 μm; physical size post-expansion, top images, 50 μm; bottom images, 12.5 μm; expansion factors 4.0–5.0x). Blue, DAPI; green, vimentin; magenta, KRT19. Adapted from Ref. with permission.
Figure 7.
Figure 7.. Gelling station setup and specimen pre-treatment prior to proteinase K digestion.
(A) Schematic of the gelling station setup. (B) Specimen pre-treatment and handling prior to proteinase K digestion: i. Remove the coverslip; ii. Trim the blank gel region surrounding the tissue; iii-iv. Remove the tissue using a razor blade; v-vi. Carefully transfer the gel into the proteinase K-containing digestion buffer.
Figure 8.
Figure 8.. Rapid ExPath imaging of lymph node specimens from patients.
(A) Pre-expansion image of a normal human lymph node specimen acquired with a spinning disk confocal microscope. Green, IgD; Red, CD8. (B) rExPath image of the specimen of A acquired with the same confocal microscope. Expansion factor: 4.0. (C and D) Fields of view zoomed into the corresponding areas outlined by a dashed white box in A and B, respectively. White arrows indicate examples of pre-expansion overlapped IgD and CD8 patterns being resolved after expansion. (E) Pre-expansion image of a human lymph node specimen with HIV acquired with a wide-field fluorescence microscope. Green, CD8; Red, PD-1; Grey, p24; Blue, DAPI. (F) rExPath image of the specimen of E acquired with the same microscope. Expansion factor: 4.58. (G and H) Corresponding fields of view zoomed into the areas outlined by a dashed yellow box in E and F, respectively. Yellow arrows indicate examples of p24 being localized with sub-diffraction limit precision. Scale bar (biological scale): (A and B) 5 μm; (C and D) 1 μm; (E and F) 10 μm; (G and H) 2 μm.

References

    1. Hell SW Far-field optical nanoscopy. in 2010 23rd Annual Meeting of the IEEE Photonics Society, PHOTINICS 2010 3–4 (2010). doi:10.1109/PHOTONICS.2010.5698725 - DOI
    1. Zhuang X Nano-imaging with STORM. Nat. Photonics 3, 365–367 (2009). - PMC - PubMed
    1. Huang B, Bates M & Zhuang X Super-resolution fluorescence microscopy. Annu. Rev. Biochem. 78, 993–1016 (2009). - PMC - PubMed
    1. Betzig E Proposed method for molecular optical imaging. Opt. Lett. 20, 237–9 (1995). - PubMed
    1. Betzig E et al. Imaging Intracellular Fluorescent Proteins at Nanometer Resolution. Science 313, 1642–1645 (2006). - PubMed

Publication types