

Resolving mechanisms of immune-mediated disease in primary CD4 T cells
- PMID: 32239644
- PMCID: PMC7207160
- DOI: 10.15252/emmm.202012112
Resolving mechanisms of immune-mediated disease in primary CD4 T cells
Abstract
Deriving mechanisms of immune-mediated disease from GWAS data remains a formidable challenge, with attempts to identify causal variants being frequently hampered by strong linkage disequilibrium. To determine whether causal variants could be identified from their functional effects, we adapted a massively parallel reporter assay for use in primary CD4 T cells, the cell type whose regulatory DNA is most enriched for immune-mediated disease SNPs. This enabled the effects of candidate SNPs to be examined in a relevant cellular context and generated testable hypotheses into disease mechanisms. To illustrate the power of this approach, we investigated a locus that has been linked to six immune-mediated diseases but cannot be fine-mapped. By studying the lead expression-modulating SNP, we uncovered an NF-κB-driven regulatory circuit which constrains T-cell activation through the dynamic formation of a super-enhancer that upregulates TNFAIP3 (A20), a key NF-κB inhibitor. In activated T cells, this feedback circuit is disrupted-and super-enhancer formation prevented-by the risk variant at the lead SNP, leading to unrestrained T-cell activation via a molecular mechanism that appears to broadly predispose to human autoimmunity.
Keywords: GWAS; MPRA; CD4 T cells; TNFAIP3; super-enhancer.
© 2020 The Authors. Published under the terms of the CC BY 4.0 license.
Conflict of interest statement
The authors declare that they have no conflict of interest.
Figures
- A
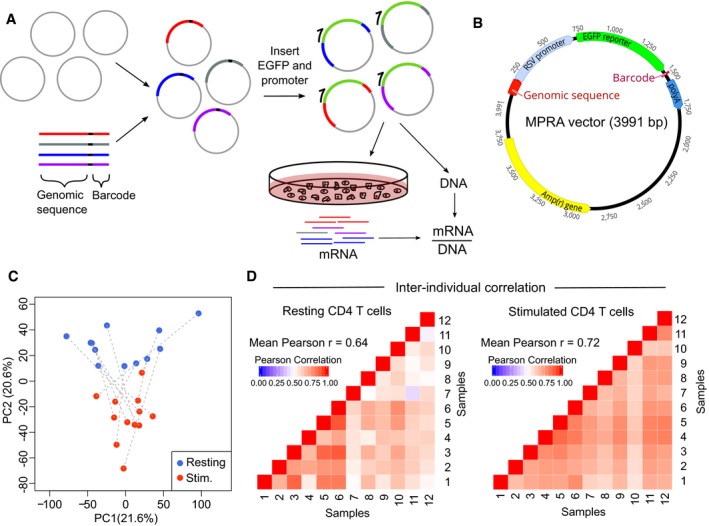
Experimental workflow for MPRA: oligonucleotide library is cloned into an empty vector, and a reporter gene and promoter are inserted using restriction sites within the oligonucleotide. The assembled plasmid is transfected into primary CD4 T cells, and RNA is extracted after 24 h. RNA barcode counts are normalised to their respective counts in the input plasmid library (DNA), which is sequenced separately.
- B
Adapted MPRA plasmid incorporating RSV promoter.
- C
Principal component analysis of scaled element counts (sum of barcodes tagging same genomic construct in mRNA) in resting and stimulated CD4 T cells from 12 donors. Dotted lines indicate samples from the same donor.
- D
Heat maps showing pairwise comparison of MPRA activity for all constructs (mRNA/DNA) between donors—left panel: resting CD4 T cells; right panel: stimulated CD4 T cells.
- A
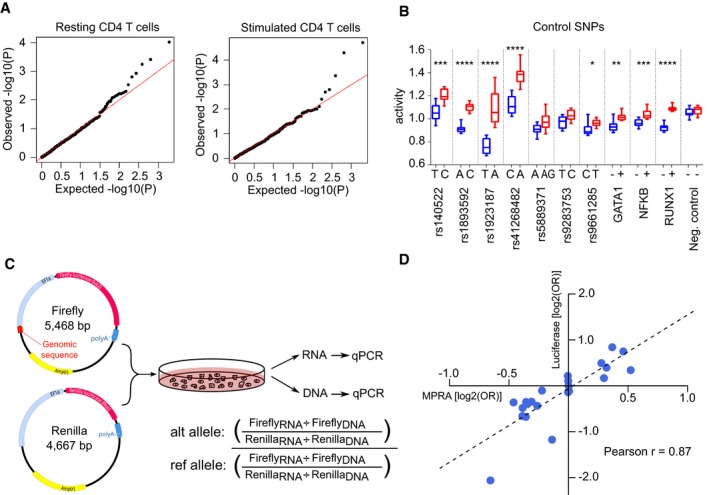
qq plots of the observed −log10(P) values versus the expected −log10(P) values under the null hypothesis for representative resting and stimulated CD4 T‐cell samples.
- B
Activity of each allele at 10 positive control SNPs and 1 negative control SNP in stimulated T cells. GATA1, NF‐κB and RUNX1 constructs were designed to include a binding site for the indicated transcription factors (+) or with that site disrupted (−). Fixed‐effects meta‐analysis P value is shown: * < 0.05; ** < 0.01, *** < 0.001, **** < 0.0001. Box and whisker plots represent median and IQR (box) and min to max (whiskers). Exact P values are shown in Appendix Table S4.
- C
Experimental workflow for validation experiment using a different promoter (EF1α), reporter gene (luciferase) and quantification method (qPCR).
- D
Expression‐modulating effect of each SNP [log2(OR)] as measured in MPRA and validation experiments. OR were calculated using the median activity of allelic constructs and are presented with respect to the risk allele (luciferase: n = 5, MPRA: n = 12).
- A
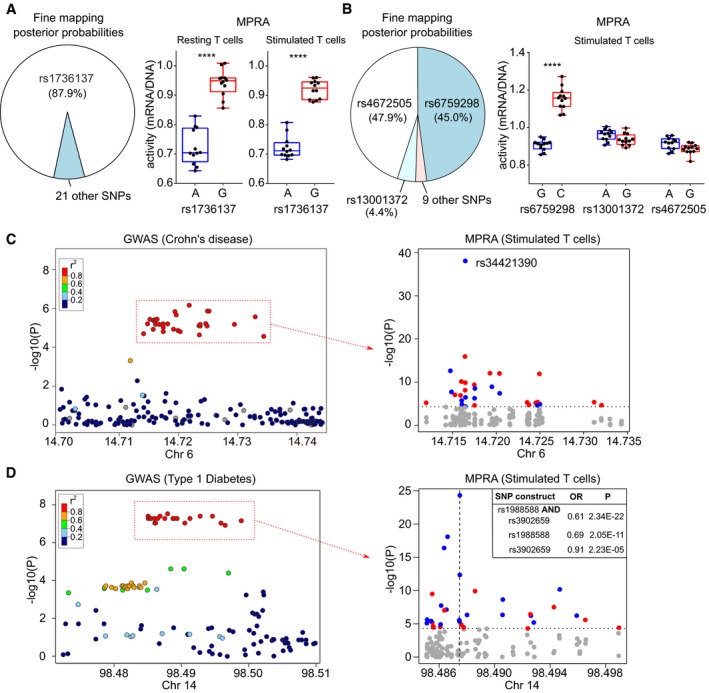
Pie chart depicting fine‐mapping results (Huang et al, 2017; posterior probabilities) for an IBD‐associated locus on 21q21 (left panel). MPRA results in resting (centre panel) and stimulated CD4 T cells (right panel) showing that the putative causal variant has significant expression‐modulating effect.
- B
Pie chart depicting Bayesian fine‐mapping results for an AS‐associated locus on 2p15 (left panel). MPRA results in stimulated T cells (right panel) showing that rs6759298 has a significant expression‐modulating effect (the strongest of any variant at this locus) while the other candidate SNPs have negligible effects.
- C
GWAS results (Liu et al, 2015) at a Crohn's disease and multiple sclerosis‐associated locus on 6p23 (left panel). MPRA for candidate SNPs in stimulated T cells (right panel) identifying a SNP (rs34421390) with by far the greatest expression‐modulating effect at this locus (blue, risk allele reduces expression; red, risk allele increases expression). Dotted horizontal line represents significance threshold (corrected for multiple testing).
- D
GWAS results at a type 1 diabetes‐associated locus on 14q32 (Onengut‐Gumuscu et al, 2015; left panel). MPRA for the candidate SNPs in stimulated T cells (right panel). The construct with the largest and most significant effect contains the risk alleles for 2 SNPs (rs1988588 and rs3902659), each of which has a smaller effect when tested individually (position indicated by vertical dotted line). Dotted horizontal line represents significance threshold (corrected for multiple testing).
- A
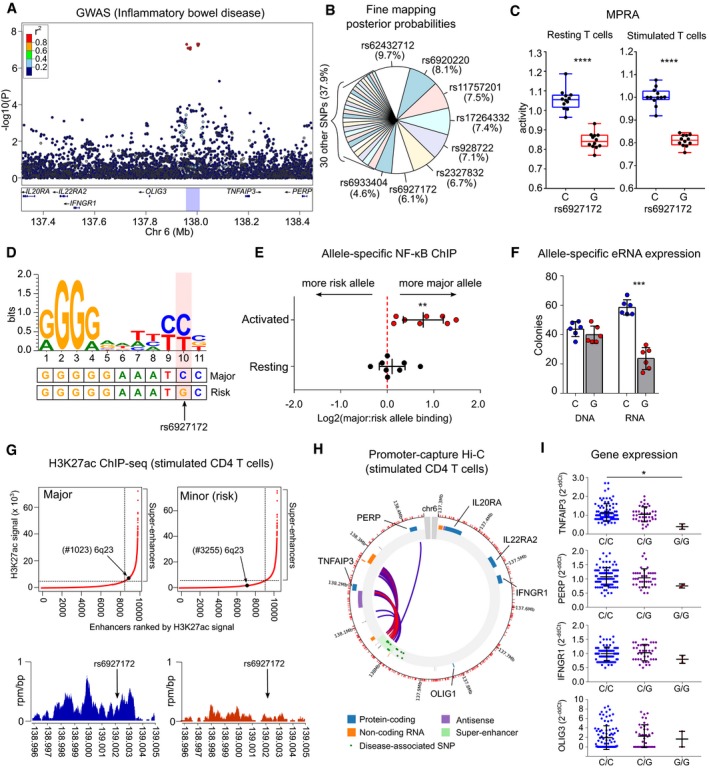
IBD GWAS results (Liu et al, 2015) at a multi‐disease‐associated locus on chromosome 6q23.
- B
Fine‐mapping results (Huang et al, 2017; posterior probabilities) for candidate SNPs at this locus.
- C
A single variant (rs6927172) has the largest and most significant expression‐modulating activity in resting (left panel) and stimulated CD4 T cells (right panel) with the risk allele reducing transcription. Plots represent median and IQR (box) and min to max (whiskers). FDR‐corrected meta‐analysis P value shown.
- D
Sequence logo for an experimentally validated NF‐κB binding motif (Wong et al, 2011). The genomic sequence around rs6927172 is aligned below.
- E
Allele‐specific NF‐κB binding in CD4 T cells from rs6927172 heterozygotes, demonstrating reduced NF‐κB binding to the risk allele following stimulation (n = 8; one‐sample t‐test, two‐tailed).
- F
Allele‐specific expression of enhancer RNA in heterozygous CD4 T cells. DNA used for technical control (n = 6; paired t‐test; two‐tailed).
- G
Genome‐wide H3K27ac ChIP‐seq in stimulated CD4 T cells from major and minor allele homozygotes at rs6927172 (n = 6). Upper panels show input‐normalised H3K27ac signals plotted against enhancer rank. Super‐enhancers are defined above the inflection point of the curve. Lower panels show H3K27ac reads from a major (left) and a minor (risk) allele homozygote (right) in a 9 kb window around rs6927172.
- H
Promoter capture Hi‐C plot depicting interactions of the 6q23 super‐enhancer in stimulated CD4 T cells.
- I
Expression of genes on 6q23 in CD4 T cells from 131 patients with active IBD, stratified by rs6927172 genotype (qPCR; one‐way ANOVA). Error bars represent SD. Expression of IL20RA and IL22RAR2 not detected.
- A
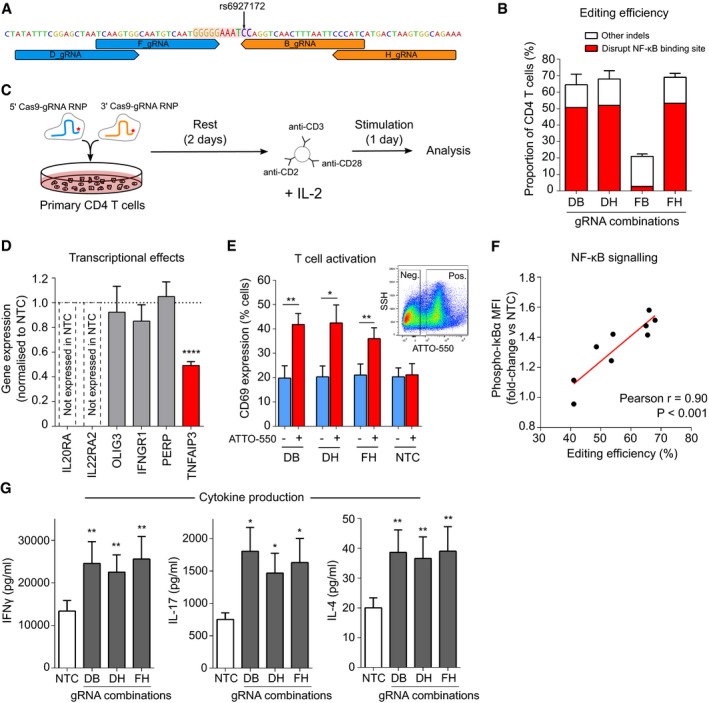
Location of gRNAs flanking the NF‐κB binding site (highlighted).
- B
Primary CD4 T‐cell editing efficiency for indicated combinations of 5′ and 3′ gRNAs (n = 6 for DB, DH and FH and n = 2 for FB). Distribution of indels assessed using ICE.
- C
Experimental workflow: equimolar amounts of 5′ and 3′ gRNA‐containing RNPs (fluorescently tagged with ATTO‐550) were nucleofected into resting CD4 T cells, which were stimulated after 48 h with anti‐CD2/3/28 microbeads and IL‐2.
- D
Expression of genes on 6q23 in EU‐containing mRNA (EU added at time of stimulation) showing that deletion of the NF‐κB binding site specifically reduces transcription of TNFAIP3, but not other genes at this locus (n = 6; one‐sample t‐test). Representative data from the DH gRNA combination.
- E
Expression of CD69, an activation marker, following CRISPR editing with indicated gRNA combinations or the non‐targeting (negative) control (NTC)—data shown for ATTO‐550 positive (RNP‐containing) and negative cells (n = 6; paired t‐test, one‐tailed). Inset flow cytometry plot depicting representative gating of ATTO‐550‐positive and ATTO‐550‐negative cells.
- F
Correlation between editing efficiency (total indel rate) and levels of phosphorylated IκBα in CD4 T cells (normalised to the mean fluorescence intensity in NTC; n = 9, linear regression).
- G
Secretion of effector cytokines following deletion of the NF‐κB binding site—Th1 (left panel, IFNγ), Th17 (centre panel, IL‐17A) and Th2 subsets (right panel, IL‐4; n = 6, paired t‐test, one‐tailed).
References
-
- Astoul E, Edmunds C, Cantrell DA, Ward SG (2001) PI 3‐K and T‐cell activation: limitations of T‐leukemic cell lines as signaling models. Trends Immunol 22: 490–496 - PubMed
-
- Benjamini Y, Hochberg Y (1995) Controlling the false discovery rate: a practical and powerful approach to multiple testing. J R Stat Soc Ser B 57: 289–300
Publication types
MeSH terms
Substances
Associated data
- Actions
- Actions
Grants and funding
- MC UU 00002/4/UK Research and Innovation | Medical Research Council (MRC)/International
- 105920/Z/14/Z/Wellcome Trust (WT)/International
- M2018/3/Crohn's and Colitis UK (Crohn's & Colitis UK)/International
- WT107881/Wellcome Trust (WT)/International
- Howard Hughes Medical Institute (HHMI)/International
- WT_/Wellcome Trust/United Kingdom
- National Institute for Health Research/International
- GlaxoSmithKline/International
- EP/R511870/1/UK Research and Innovation | Engineering and Physical Sciences Research Council (EPSRC)/International
- MC_UU_00002/4/MRC_/Medical Research Council/United Kingdom
- National Institutes of Health Oxford-Cambridge Scholars Program/International
LinkOut - more resources
Full Text Sources
Other Literature Sources
Molecular Biology Databases
Research Materials
