

Use of Rapid Online Surveys to Assess People's Perceptions During Infectious Disease Outbreaks: A Cross-sectional Survey on COVID-19
- PMID: 32240094
- PMCID: PMC7124956
- DOI: 10.2196/18790
Use of Rapid Online Surveys to Assess People's Perceptions During Infectious Disease Outbreaks: A Cross-sectional Survey on COVID-19
Abstract
Background: Given the extensive time needed to conduct a nationally representative household survey and the commonly low response rate of phone surveys, rapid online surveys may be a promising method to assess and track knowledge and perceptions among the general public during fast-moving infectious disease outbreaks.
Objective: This study aimed to apply rapid online surveying to determine knowledge and perceptions of coronavirus disease 2019 (COVID-19) among the general public in the United States and the United Kingdom.
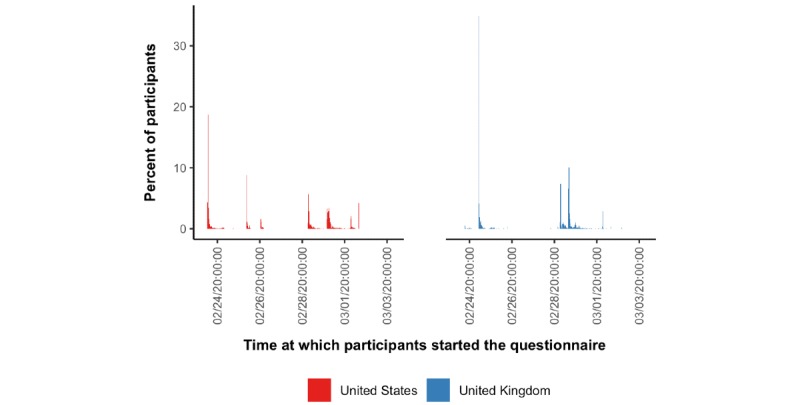
Methods: An online questionnaire was administered to 3000 adults residing in the United States and 3000 adults residing in the United Kingdom who had registered with Prolific Academic to participate in online research. Prolific Academic established strata by age (18-27, 28-37, 38-47, 48-57, or ≥58 years), sex (male or female), and ethnicity (white, black or African American, Asian or Asian Indian, mixed, or "other"), as well as all permutations of these strata. The number of participants who could enroll in each of these strata was calculated to reflect the distribution in the US and UK general population. Enrollment into the survey within each stratum was on a first-come, first-served basis. Participants completed the questionnaire between February 23 and March 2, 2020.
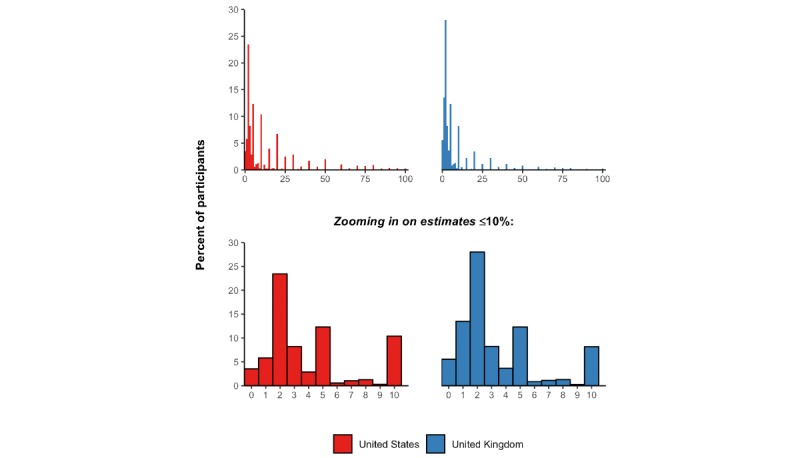
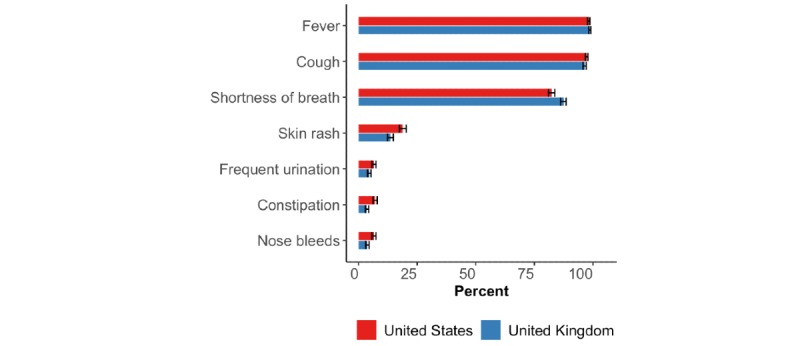
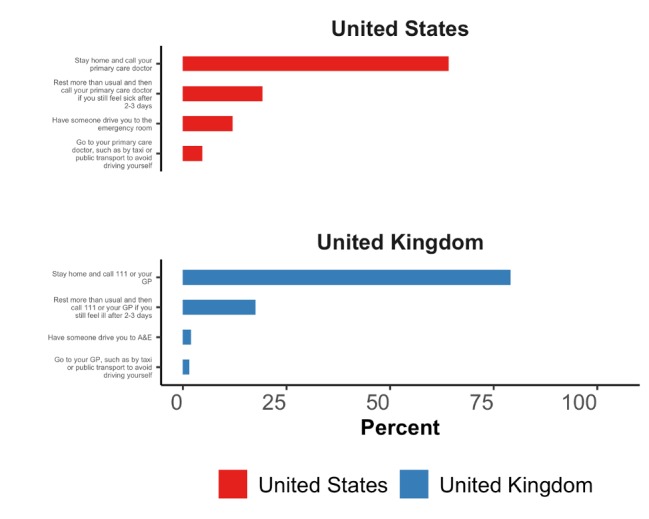
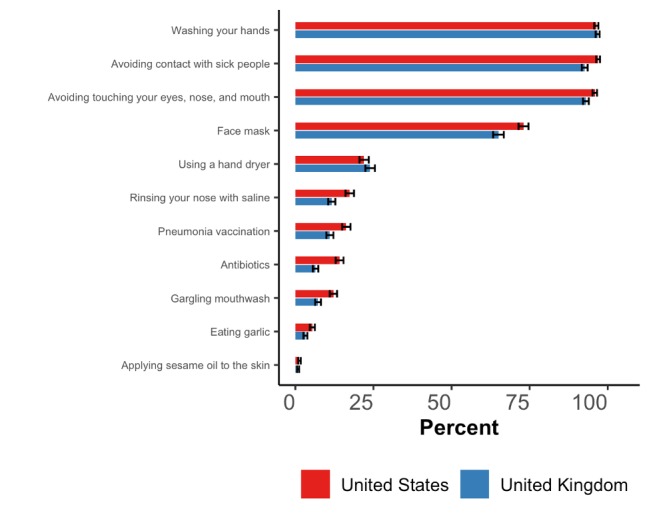
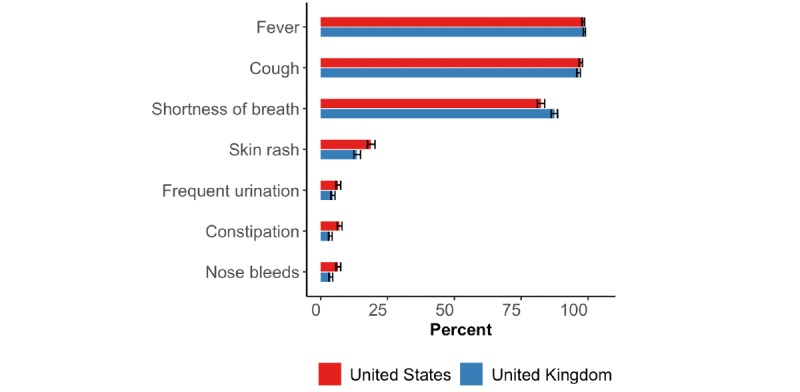
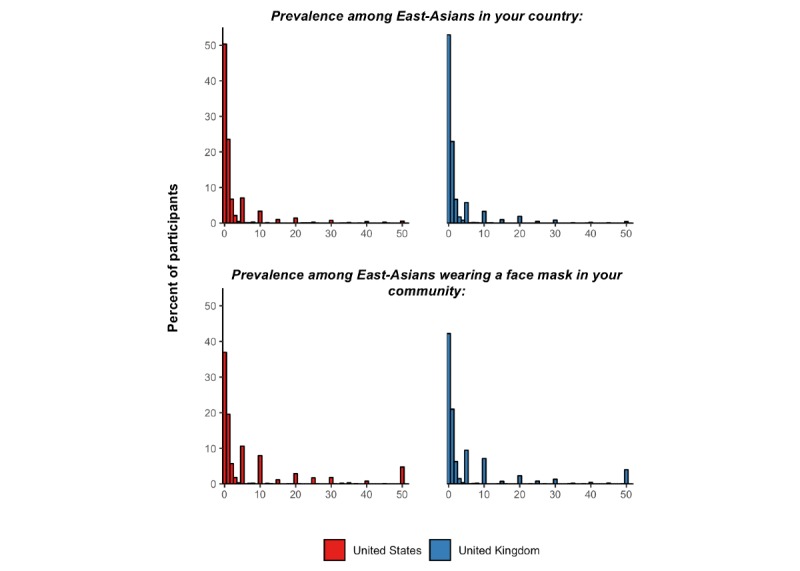
Results: A total of 2986 and 2988 adults residing in the United States and the United Kingdom, respectively, completed the questionnaire. Of those, 64.4% (1924/2986) of US participants and 51.5% (1540/2988) of UK participants had a tertiary education degree, 67.5% (2015/2986) of US participants had a total household income between US $20,000 and US $99,999, and 74.4% (2223/2988) of UK participants had a total household income between £15,000 and £74,999. US and UK participants' median estimate for the probability of a fatal disease course among those infected with severe acute respiratory syndrome coronavirus 2 (SARS-CoV-2) was 5.0% (IQR 2.0%-15.0%) and 3.0% (IQR 2.0%-10.0%), respectively. Participants generally had good knowledge of the main mode of disease transmission and common symptoms of COVID-19. However, a substantial proportion of participants had misconceptions about how to prevent an infection and the recommended care-seeking behavior. For instance, 37.8% (95% CI 36.1%-39.6%) of US participants and 29.7% (95% CI 28.1%-31.4%) of UK participants thought that wearing a common surgical mask was "highly effective" in protecting them from acquiring COVID-19, and 25.6% (95% CI 24.1%-27.2%) of US participants and 29.6% (95% CI 28.0%-31.3%) of UK participants thought it was prudent to refrain from eating at Chinese restaurants. Around half (53.8%, 95% CI 52.1%-55.6%) of US participants and 39.1% (95% CI 37.4%-40.9%) of UK participants thought that children were at an especially high risk of death when infected with SARS-CoV-2.
Conclusions: The distribution of participants by total household income and education followed approximately that of the US and UK general population. The findings from this online survey could guide information campaigns by public health authorities, clinicians, and the media. More broadly, rapid online surveys could be an important tool in tracking the public's knowledge and misperceptions during rapidly moving infectious disease outbreaks.
Keywords: COVID-19; SARS-CoV-2; coronavirus; infectious disease; knowledge; outbreak; pandemic; perceptions; public health; rapid online surveys; survey.
©Pascal Geldsetzer. Originally published in the Journal of Medical Internet Research (http://www.jmir.org), 02.04.2020.
Conflict of interest statement
Conflicts of Interest: None declared.
Figures
Update of
-
Using rapid online surveys to assess perceptions during infectious disease outbreaks: a cross-sectional survey on Covid-19 among the general public in the United States and United Kingdom.medRxiv [Preprint]. 2020 Mar 27:2020.03.13.20035568. doi: 10.1101/2020.03.13.20035568. medRxiv. 2020. Update in: J Med Internet Res. 2020 Apr 2;22(4):e18790. doi: 10.2196/18790. PMID: 32511585 Free PMC article. Updated. Preprint.
References
-
- Gong W, Taighoon Shah M, Firdous S, Jarrett BA, Moulton LH, Moss WJ, Hayford K, O'Brien KL, Chandir S. Comparison of three rapid household survey sampling methods for vaccination coverage assessment in a peri-urban setting in Pakistan. Int J Epidemiol. 2019 Apr 01;48(2):583–595. doi: 10.1093/ije/dyy263. - DOI - PubMed
-
- Kennedy C, Hartig H. Pew Research Center. 2019. [2020-03-30]. Response rates in telephone surveys have resumed their decline https://www.pewresearch.org/fact-tank/2019/02/27/response-rates-in-telep...
-
- Charles Q, Alexandra C, Leenisha M, Ashley A. In Search of the Optimal Mode for Mobile Phone Surveys in Developing Countries. A Comparison of IVR, SMS. and CATI in Nigeria. Survey Research Methods 12/10. 2019;13(3):305–318. doi: 10.18148/srm/2019.v13i3.7375. - DOI
-
- World Health Organization F1000Prime. 2019. [2020-03-30]. Report of the WHO-China Joint Mission on Coronavirus Disease https://f1000.com/prime/737509210#eval793572110.
Publication types
MeSH terms
Grants and funding
LinkOut - more resources
Full Text Sources
Miscellaneous
