. 2020 Apr 2;15(4):e0231141.
doi: 10.1371/journal.pone.0231141. eCollection 2020.

Dissecting the economic impact of soybean diseases in the United States over two decades

Affiliations

Dissecting the economic impact of soybean diseases in the United States over two decades

Ananda Y Bandara et al. PLoS One. .

Abstract

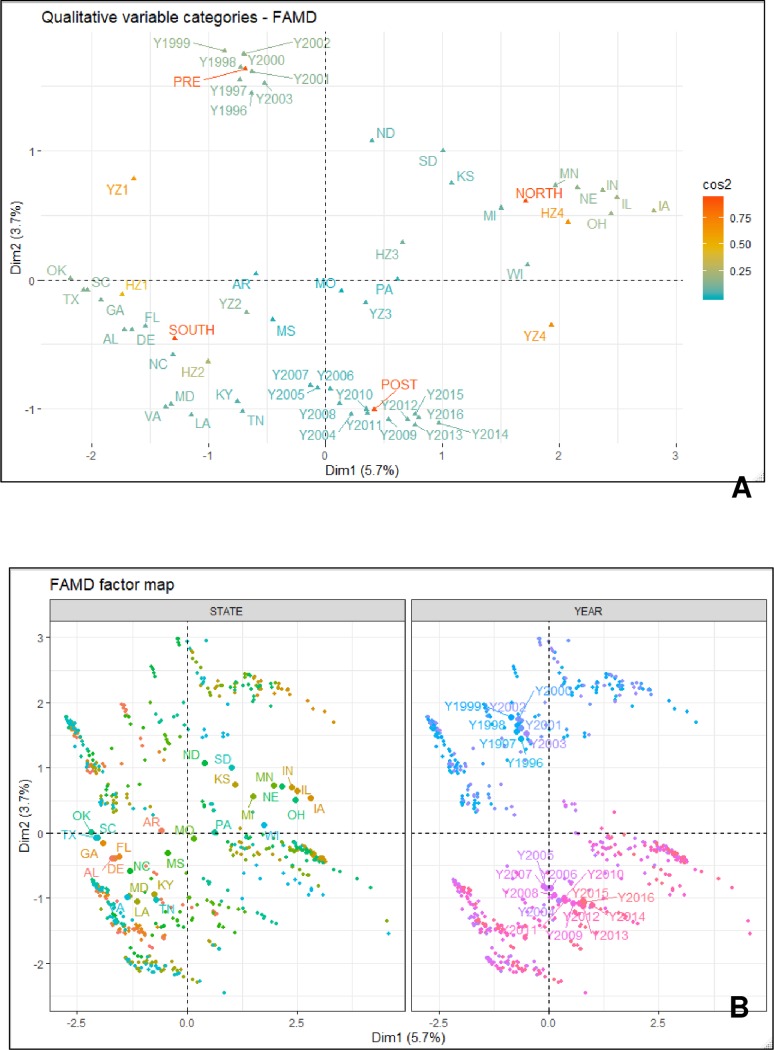
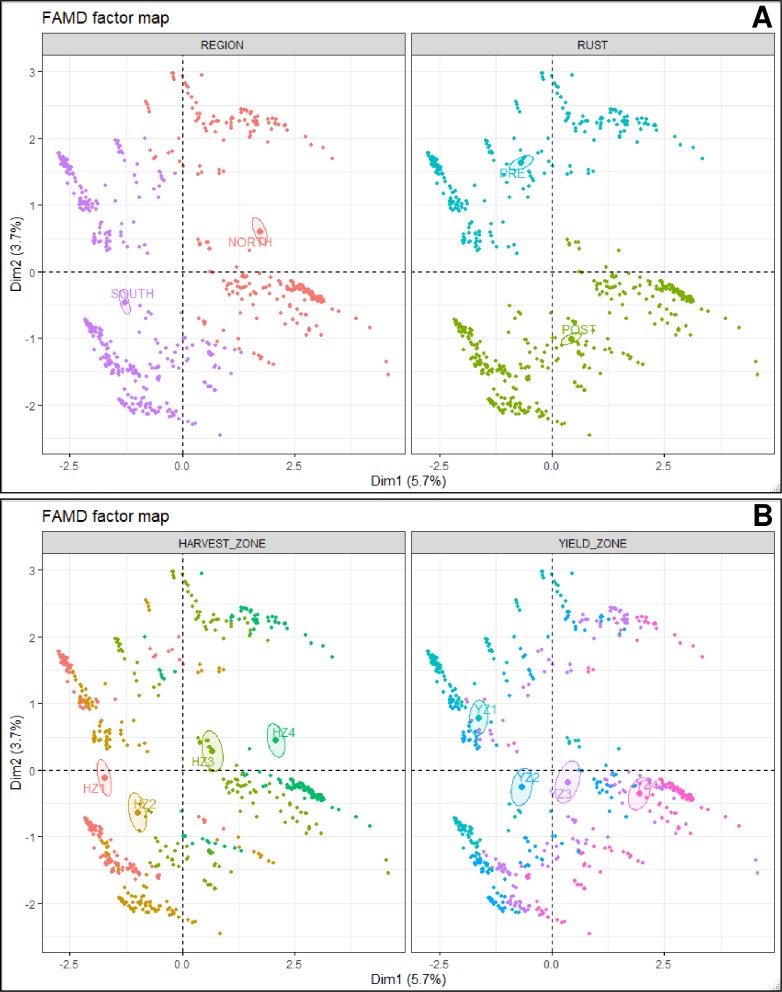
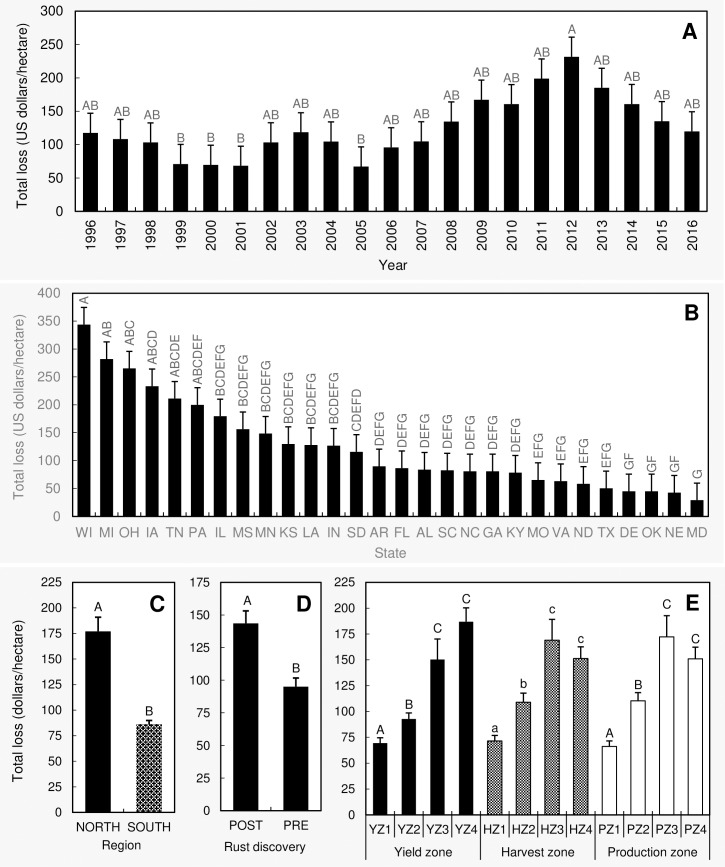
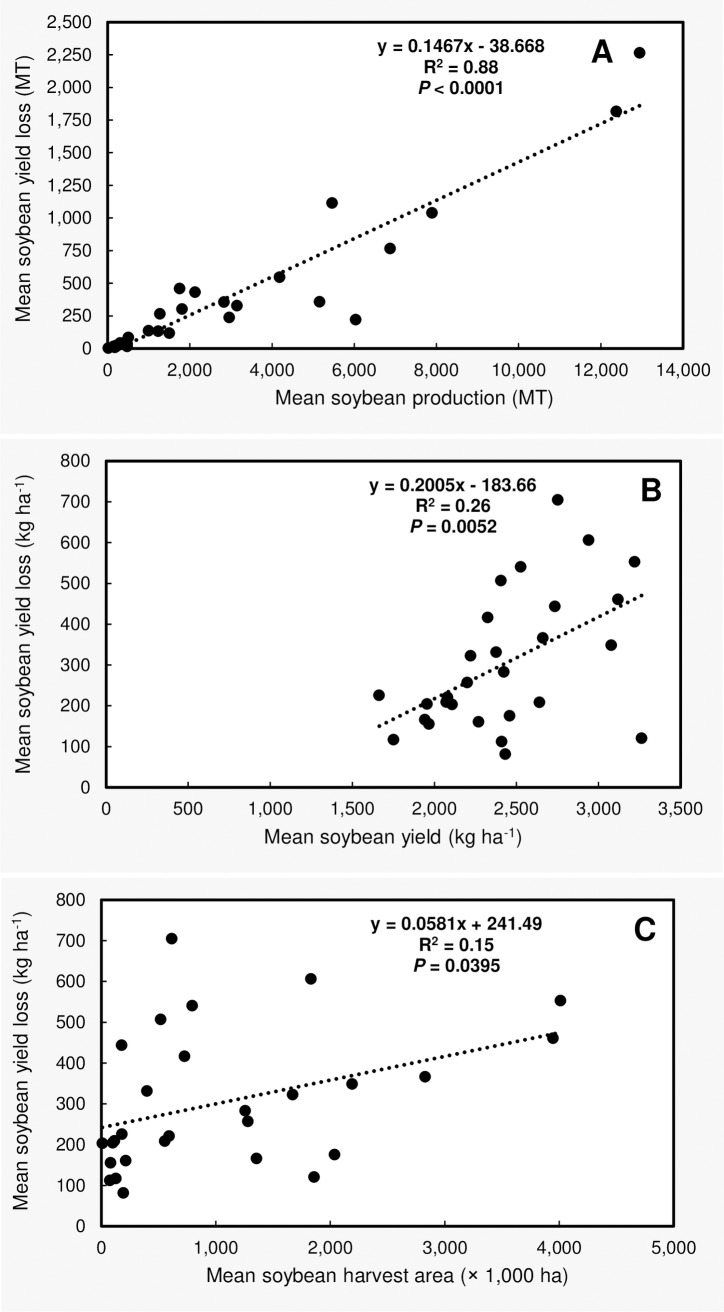
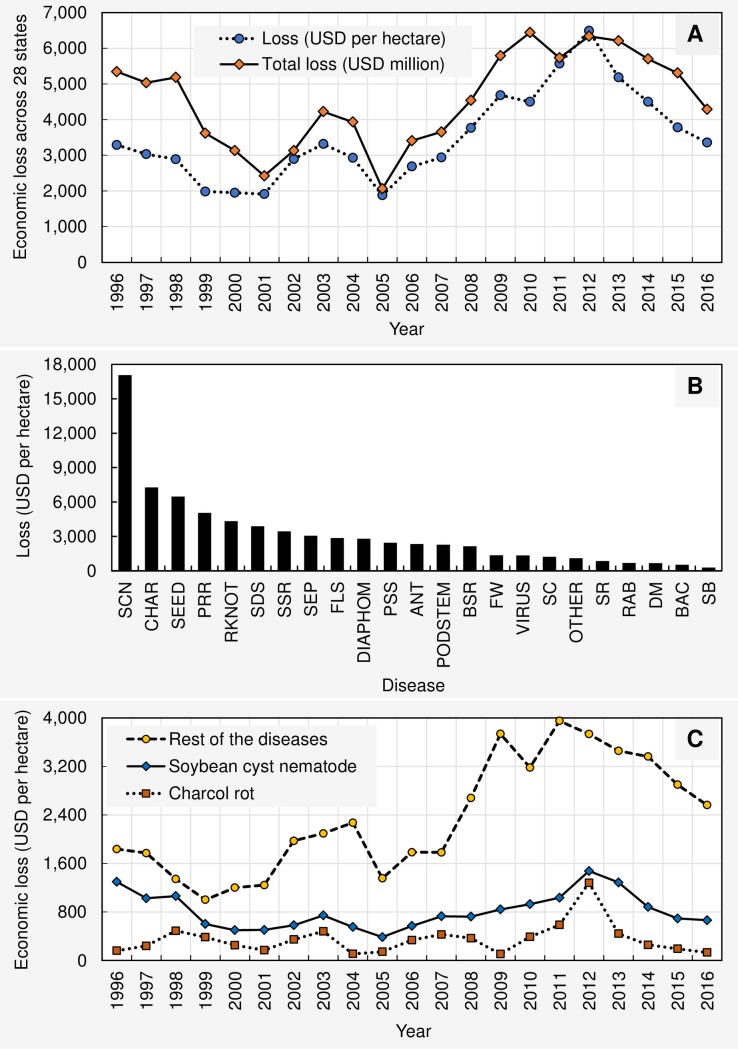
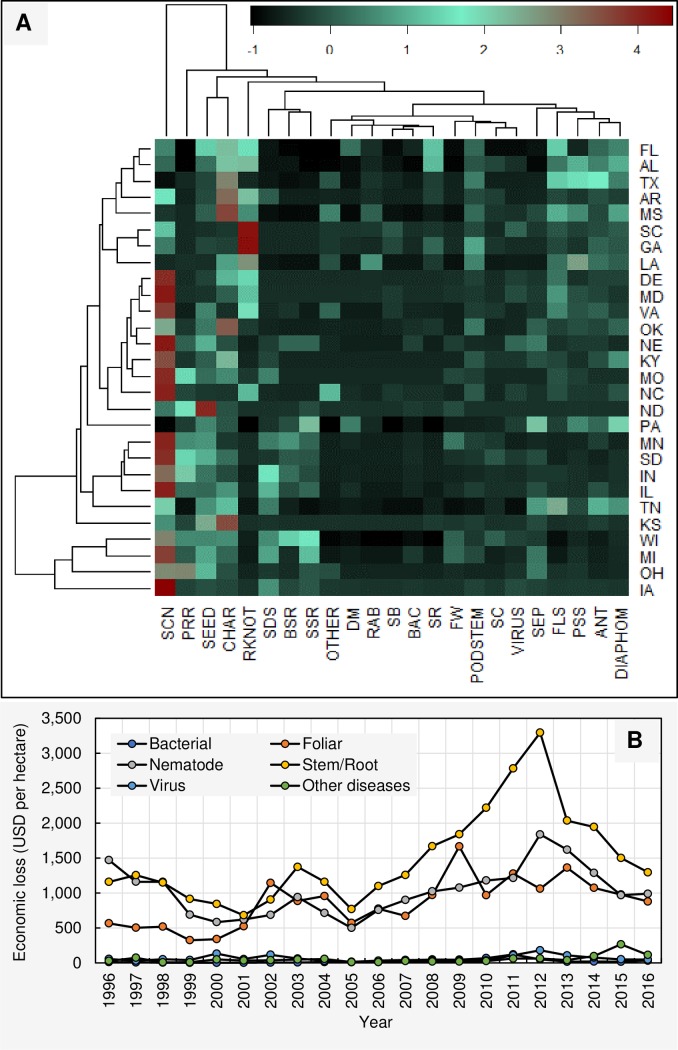
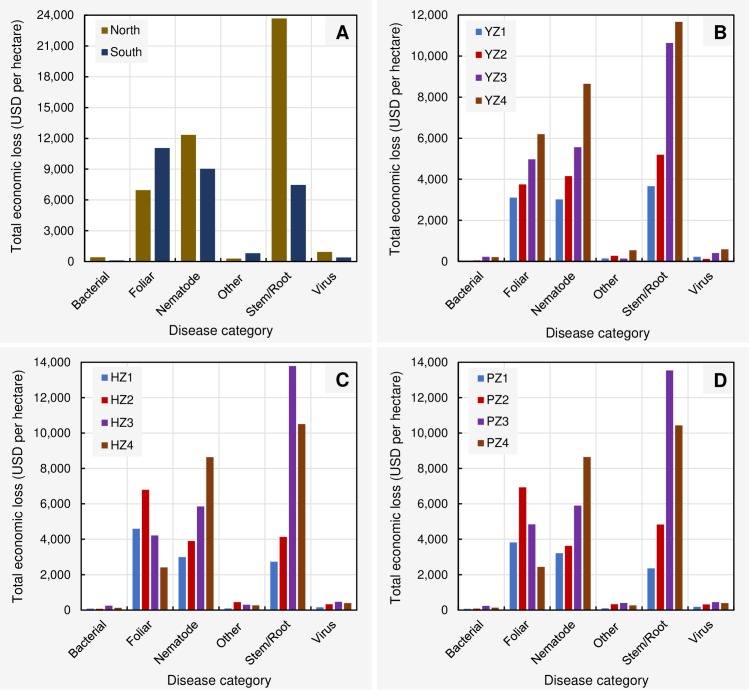
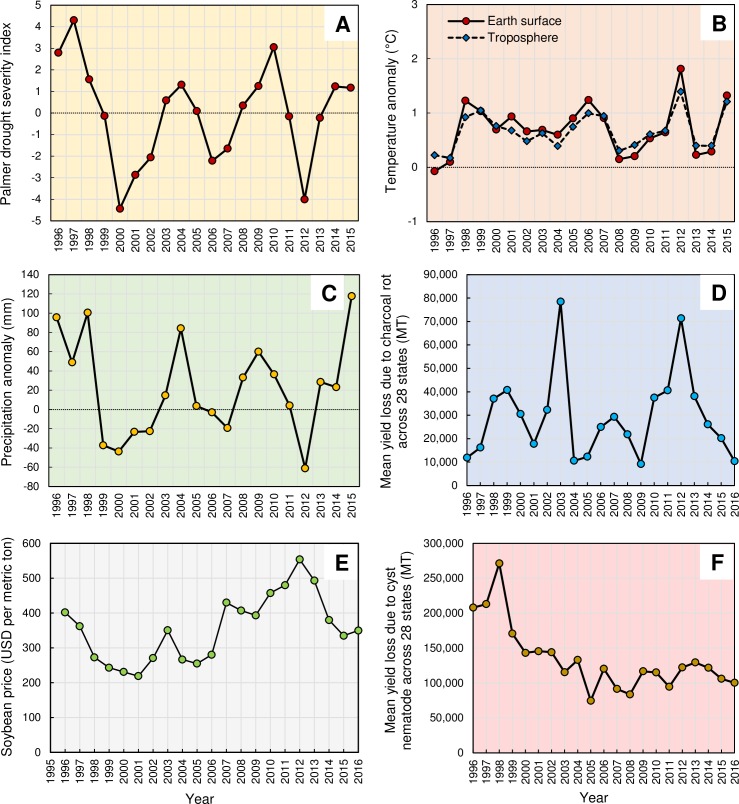
Soybean (Glycine max L. Merrill) is an economically important commodity for United States agriculture. Nonetheless, the profitability of soybean production has been negatively impacted by soybean diseases. The economic impacts of 23 common soybean diseases were estimated in 28 soybean-producing states in the U.S., from 1996 to 2016 (the entire data set consisted of 13,524 data points). Estimated losses were investigated using a variety of statistical approaches. The main effects of state, year, pre- and post-discovery of soybean rust, region, and zones based on yield, harvest area, and production, were significant on "total economic loss" as a function of diseases. Across states and years, the soybean cyst nematode, charcoal rot, and seedling diseases were the most economically damaging diseases while soybean rust, bacterial blight, and southern blight were the least economically damaging. A significantly greater mean loss (51%) was observed in states/years after the discovery of soybean rust (2004 to 2016) compared to the pre-discovery (1996 to 2003). From 1996 to 2016, the total estimated economic loss due to soybean diseases in the U.S. was $95.48 billion, with $80.89 billion and $14.59 billion accounting for the northern and southern U.S. losses, respectively. Over the entire time period, the average annual economic loss due to soybean diseases in the U.S. reached nearly $4.55 billion, with approximately 85% of the losses occurring in the northern U.S. Low yield/harvest/production zones had significantly lower mean economic losses due to diseases in comparison to high yield/harvest/production zones. This observation was further bolstered by the observed positive linear correlation of mean soybean yield loss (in each state, due to all diseases considered in this study, across 21 years) with the mean state wide soybean production (MT), mean soybean yield (kg ha-1), and mean soybean harvest area (ha). Results of this investigation provide useful insights into how research, policy, and educational efforts should be prioritized in soybean disease management.


Conflict of interest statement

The authors have declared that no competing interests exist.

Figures

Fig 1
Fig 1
(A) The variance maximizing distribution pattern of the qualitative variables (years, states, region, pre- and post-discovery of soybean rust, yield zone, and harvest zone) and (B) the FAMD factor maps showing the variance maximizing distribution patterns of the total per hectare economic loss (due to 23 diseases) data points in the map space and their clustering patterns based on states and years. Figures were obtained from the factor analysis with mixed data approach (FAMD analysis). Diseases = Anthracnose, bacterial blight, brown stem rot, Cercospora leaf blight (purple seed stain), charcoal rot, Diaporthe-Phomopsis, downy mildew, frogeye leaf spot, Fusarium wilt, other diseases, Phytophthora root and stem rot, pod and stem blight, Rhizoctonia aerial blight, root-knot and other nematodes, Sclerotinia stem rot (white mold), seedling diseases, Septoria brown spot, soybean cyst nematode, soybean rust, southern blight, stem canker, sudden death syndrome, and virus diseases; Years = from 1996 to 2016; States = Alabama, Arkansas, Delaware, Florida, Georgia, Kentucky, Louisiana, Maryland, Mississippi, Missouri, North Carolina, Oklahoma, South Carolina, Tennessee, Texas, and Virginia, Illinois, Indiana, Iowa, Kansas, Michigan, Minnesota, Nebraska, North Dakota, Ohio, Pennsylvania, South Dakota, and Wisconsin; Southern region = Alabama, Arkansas, Delaware, Florida, Georgia, Kentucky, Louisiana, Maryland, Mississippi, Missouri, North Carolina, Oklahoma, South Carolina, Tennessee, Texas, and Virginia; Northern region = Illinois, Indiana, Iowa, Kansas, Michigan, Minnesota, Nebraska, North Dakota, Ohio, Pennsylvania, South Dakota, and Wisconsin; Post-discovery of soybean rust = from 2004 to 2016; Pre-discovery of soybean rust = from 1996 to 2003; Yield and harvest zones = represent four levels (zone 1–4) based on the quartiles within a data base containing 588 yield (kg/ha)/harvest area (ha) data points (588 = 21 years × 28 states). Within this data base, data points from the minimum to the first quartile were classified as zone 1. Similarly, data points from the first quartile to median, median to the third quartile, and > third quartile were respectively classified as zones 2, 3, and 4.
Fig 2
Fig 2
FAMD factor maps obtained from the factor analysis with mixed data approach (FAMD analysis), showing the variance maximizing distribution patterns of the total per hectare economic loss (due to 23 diseases) data points (= 588) in the map space and their clustering patterns based on (A) region and pre- and post-discovery of rust and (B) harvest and yield zones. Diseases = Anthracnose, bacterial blight, brown stem rot, Cercospora leaf blight (purple seed stain), charcoal rot, Diaporthe-Phomopsis, downy mildew, frogeye leaf spot, Fusarium wilt, other diseases, Phytophthora root and stem rot, pod and stem blight, Rhizoctonia aerial blight, root-knot and other nematodes, Sclerotinia stem rot (white mold), seedling diseases, Septoria brown spot, soybean cyst nematode, soybean rust, southern blight, stem canker, sudden death syndrome, and virus diseases; Southern region = Alabama, Arkansas, Delaware, Florida, Georgia, Kentucky, Louisiana, Maryland, Mississippi, Missouri, North Carolina, Oklahoma, South Carolina, Tennessee, Texas, and Virginia; Northern region = Illinois, Indiana, Iowa, Kansas, Michigan, Minnesota, Nebraska, North Dakota, Ohio, Pennsylvania, South Dakota, and Wisconsin; Post-discovery of soybean rust = from 2004 to 2016; Pre-discovery of soybean rust = from 1996 to 2003; Yield and harvest zones = represent four levels (zone 1–4) based on the quartiles within a data base containing 588 yield (kg/ha)/harvest area (ha) data points (588 = 21 years × 28 states). Within this data base, data points from the minimum to the first quartile were classified as zone 1. Similarly, data points from the first quartile to median, median to the third quartile, and > third quartile were respectively classified as zones 2, 3, and 4.
Fig 3
Fig 3
Comparison of the mean total economic losses (within a state, during a given year) due to all 23 diseases considered for this paper among (A) years, (B) states, (C) regions, (D) pre- and post-discovery of soybean rust, and (E) yield/harvest/production zones. Treatment means with different letter designations (within each sub-figure) are significantly different at α = 0.05 based on the adjustment for multiple comparison using Tukey-Kramer test. Error bars represent standard errors. Diseases = Anthracnose, bacterial blight, brown stem rot, Cercospora leaf blight (purple seed stain), charcoal rot, Diaporthe-Phomopsis, downy mildew, frogeye leaf spot, Fusarium wilt, other diseases, Phytophthora root and stem rot, pod and stem blight, Rhizoctonia aerial blight, root-knot and other nematodes, Sclerotinia stem rot (white mold), seedling diseases, Septoria brown spot, soybean cyst nematode, soybean rust, southern blight, stem canker, sudden death syndrome, and virus diseases. Southern region = Alabama, Arkansas, Delaware, Florida, Georgia, Kentucky, Louisiana, Maryland, Mississippi, Missouri, North Carolina, Oklahoma, South Carolina, Tennessee, Texas, and Virginia; Northern region = Illinois, Indiana, Iowa, Kansas, Michigan, Minnesota, Nebraska, North Dakota, Ohio, Pennsylvania, South Dakota, and Wisconsin; Post-discovery of soybean rust = from 2004 to 2016; Pre-discovery of soybean rust = from 1996 to 2003; Yield/Harvest/Production zones = represent four levels (zone 1–4) based on the quartiles within a data base containing 588 yield (kg/ha)/harvest area (ha)/production (MT) data points (588 = 21 years × 28 states). Within this data base, data points from the minimum to the first quartile were classified as zone 1. Similarly, data points from the first quartile to median, median to the third quartile, and > third quartile were respectively classified as zones 2, 3, and 4.
Fig 4
Fig 4
Scatter plots showing the linear relationship between (A) mean soybean yield losses and mean state soybean production (both in MT), (B) mean soybean yield losses (kg ha-1) and mean soybean yield (kg ha-1), and (C) mean soybean yield loss (kg ha-1) and mean soybean harvest area (ha). Each dot represents a state. Mean soybean yield losses represent the losses due all diseases considered in this study (n = 23) for individual states between 1996 and 2016.
Fig 5
Fig 5
(A) Fluctuation of the per hectare (USD) and total (USD millions) economic losses from 1996 to 2016 due to 23 diseases across 28 states (AL, AR, DE, FL, GA, IA, IL, IN, KS, KY, LA, MD, MI, MN, MO, MS, NC, ND, NE, OH, OK, PA, SC, SD, TN, TX, VA, and WI). (B) The estimated total economic loss (USD per hectare) associated with 23 diseases across 21 years (1996 to 2016) and 28 states in descending order: SCN = soybean cyst nematodes, CHAR = charcoal rot, SEED = seedling diseases, PRR = Phytophthora root and stem rot, RKNOT = root-knot and other nematodes, SDS = sudden death syndrome, SSR = Sclerotinia stem rot (white mold), SEP = Septoria brown spot, FLS = Frogeye leaf spot, DIAPHOM = Diaporthe-Phomopsis, CLBPSS = Cercospora leaf blight (purple seed stain), PODSTEM = pod and stem blight, ANT = Anthracnose, BSR = Brown stem rot, FW = Fusarium wilt, VIRUS = virus diseases, SC = stem canker, OTHER = other diseases, DM = downy mildew, RAB = Rhizoctonia aerial blight, SR = soybean rust, BAC = bacterial blight, SB = southern blight. (C) Fluctuation of the total economic losses (across 28 states) associated with soybean cyst nematode, charcoal rot, and all the other diseases together during 1996 to 2016 period.
Fig 6
Fig 6
(A) Heat map showing the estimated cumulative economic losses (USD per hectare) from 1996 to 2016 associated with 23 diseases for each state. ANT = Anthracnose, BAC = bacterial blight, BSR = Brown stem rot, CHAR = charcoal rot, CLBPSS = Cercospora leaf blight (purple seed stain), DIAPHOM = Diaporthe-Phomopsis, DM = downy mildew, FLS = Frogeye leaf spot, FW = Fusarium wilt, OTHER = other diseases, PODSTEM = pod and stem blight, PRR = Phytophthora root and stem rot, RAB = Rhizoctonia aerial blight, RKNOT = root-knot and other nematodes, SB = southern blight, SC = stem canker, SCN = soybean cyst nematodes, SDS = sudden death syndrome, SEED = seedling diseases, SEP = Septoria brown spot, SR = soybean rust, SSR = Sclerotinia stem rot (white mold), VIRUS = virus diseases. (B) Fluctuation of the cumulative economic losses (USD per hectare) of 6 disease categories from 1996 to 2016 across 28 states. Bacterial = Bacterial blight; Foliar = Anthracnose, Cercospora leaf blight (purple seed stain), Diaporthe-Phomopsis, Downy mildew, Frogeye leaf spot, Pod and stem blight, Rhizoctonia aerial blight, Septoria leaf spot, and Soybean rust; Nematodes = Heterodera glycine (soybean cyst nematode), Meloidogyne spp. (root-knot nematodes), Rotylenchulus reniformis (reniform nematode), Belonolaimus longicaudatus (sting nematode), Helicotylenchus spp. (spiral nematodes), Hoplolaimus spp. (lance nematodes), Paratrichodorus spp. (stubby root nematodes), and Pratylenchus spp. (lesion nematodes); Stem/Root = Brown stem rot, Charcoal rot, Fusarium wilt, Phytophthora root and stem rot, Sclerotinia stem rot (white mold), Seedling diseases (caused by a complex of organisms such as multiple species of Fusarium, Pythium, Phomopsis, and/or Rhizoctonia solani), Southern blight, Stem canker, and Sudden death syndrome; Virus = Alfalfa mosaic virus, Bean pod mottle virus, Bean yellow mosaic virus, Peanut mottle virus, Soybean dwarf virus, Soybean mosaic virus, Soybean vein necrosis virus, Tobacco ringspot virus, Tobacco streak virus, and Tomato spotted wilt virus; Other diseases = black root rot, Cercospora leaf blight, Cylindrocladium parasticum (red crown rot), green stem syndrome, Neocosmospora root rot, Pythium root rot, target spot, and Texas root rot.
Fig 7
Fig 7
Comparison of the cumulative total per hectare economic loss (USD) from 1996 to 2016 due to disease categories at (A) northern and southern US. (B) different yield zones (1–4). (C) different harvest zones (1–4). (D) different production zones (1–4). Northern region = Illinois, Indiana, Iowa, Kansas, Michigan, Minnesota, Nebraska, North Dakota, Ohio, Pennsylvania, South Dakota, and Wisconsin; Southern region = Alabama, Arkansas, Delaware, Florida, Georgia, Kentucky, Louisiana, Maryland, Mississippi, Missouri, North Carolina, Oklahoma, South Carolina, Tennessee, Texas, and Virginia; Yield/Harvest/Production zones = represent four levels (zone 1–4) based on the quartiles within a data base containing 588 yield (kg/ha)/harvest area (ha)/production (MT) data points (588 = 21 years × 28 states). Within this data base, data points from the minimum to the first quartile were classified as zone 1. Similarly, data points from the first quartile to median, median to the third quartile, and > third quartile were respectively classified as zones 2, 3, and 4. Bacterial = Bacterial blight; Foliar = Anthracnose, Cercospora leaf blight (purple seed stain), Diaporthe-Phomopsis, Downy mildew, Frogeye leaf spot, Pod and stem blight, Rhizoctonia aerial blight, Septoria leaf spot, and Soybean rust; Nematodes = Heterodera glycine (soybean cyst nematode), Meloidogyne spp. (root-knot nematodes), Rotylenchulus reniformis (reniform nematode), Belonolaimus longicaudatus (sting nematode), Helicotylenchus spp. (spiral nematodes), Hoplolaimus spp. (lance nematodes), Paratrichodorus spp. (stubby root nematodes), and Pratylenchus spp. (lesion nematodes); Stem/Root = Brown stem rot, Charcoal rot, Fusarium wilt, Phytophthora root and stem rot, Sclerotinia stem rot (white mold), Seedling diseases (caused by a complex of organisms such as multiple species of Fusarium, Pythium, Phomopsis, and/or Rhizoctonia solani), Southern blight, Stem canker, and Sudden death syndrome; Virus = Alfalfa mosaic virus, Bean pod mottle virus, Bean yellow mosaic virus, Peanut mottle virus, Soybean dwarf virus, Soybean mosaic virus, Soybean vein necrosis virus, Tobacco ringspot virus, Tobacco streak virus, and Tomato spotted wilt virus; Other diseases = black root rot, Cercospora leaf blight, Cylindrocladium parasticum (red crown rot), green stem syndrome, Neocosmospora root rot, Pythium root rot, target spot, and Texas root rot.
Fig 8
Fig 8
(A) Annual values of the Palmer Drought Severity Index, averaged over the entire area of the contiguous 48 states. Positive values represent wetter-than-average conditions, while negative values represent drier-than-average conditions. A value between -2 and -3 indicates moderate drought, -3 to -4 is severe drought, and -4 or below indicates extreme drought. (B) Annual average temperature in the contiguous 48 states. (C) Total annual precipitation in the contiguous 48 states. Graph uses the 1901 to 2000 average as a baseline for depicting change. Selecting a different baseline period would not change the shape of the data over time. Data for figures were obtained from the National Oceanic and Atmospheric Administration’s National Centers for Environmental Information (www7.ncdc.noaa.gov.). (D) The annual soybean price fluctuation in the United States from 1996 t0 2016 (price for a given year is the mean value across 28 soybean growing states (AL, AR, DE, FL, GA, IA, IL, IN, KS, KY, LA, MD, MI, MN, MO, MS, NC, ND, NE, OH, OK, PA, SC, SD, TN, TX, VA, and WI). (E) Mean soybean yield loss due to charcoal rot disease across 28 states from 1996 to 2016. (F) Mean soybean yield loss due to soybean cyst nematode across 28 states from 1996 to 2016.

Similar articles

Cited by

References

    1. Hartman GL, West ED, Herman TK. Crops that feed the World 2. Soybean worldwide production, use, and constraints caused by pathogens and pests. Food Secur. 2011; 3:5–17.
    1. Savary S, Willocquet L, Pethybridge SJ, Esker P, McRoberts N, Nelson A. The global burden of pathogens and pests on major food crops. Nat. Ecol. Evol. 2019; 3:430–439. 10.1038/s41559-018-0793-y - DOI - PubMed
    1. Ali N. Soybean processing and utilization In: Singh G (Ed.), The Soybean: Botany, Production and Uses. CAB International, Cambridge, MA; 2010, pp 345–374.
    1. Liu K. Food use of whole soybeans In: Johnson LA, White PJ, Galloway R. (Eds.), Soybeans: Chemistry, production, processing, and utilization. Urbana, IL: American Oil Chemists' Society Press; 2008, pp 441–482.
    1. Goldsmith P. 2008. Economics of soybean production, marketing, and utilization In: Johnson, White PJ, Galloway R. (Eds.), Soybeans: Chemistry, production, processing, and utilization. Urbana, IL: American Oil Chemists' Society Press; 2008, pp 117–150.

Publication types