. 2020 Aug;139(8):1037-1053.
doi: 10.1007/s00439-020-02151-5. Epub 2020 Apr 2.

Comprehensive functional annotation of susceptibility variants associated with asthma

Affiliations

Comprehensive functional annotation of susceptibility variants associated with asthma

Yadu Gautam et al. Hum Genet. 2020 Aug.

Erratum in

Abstract

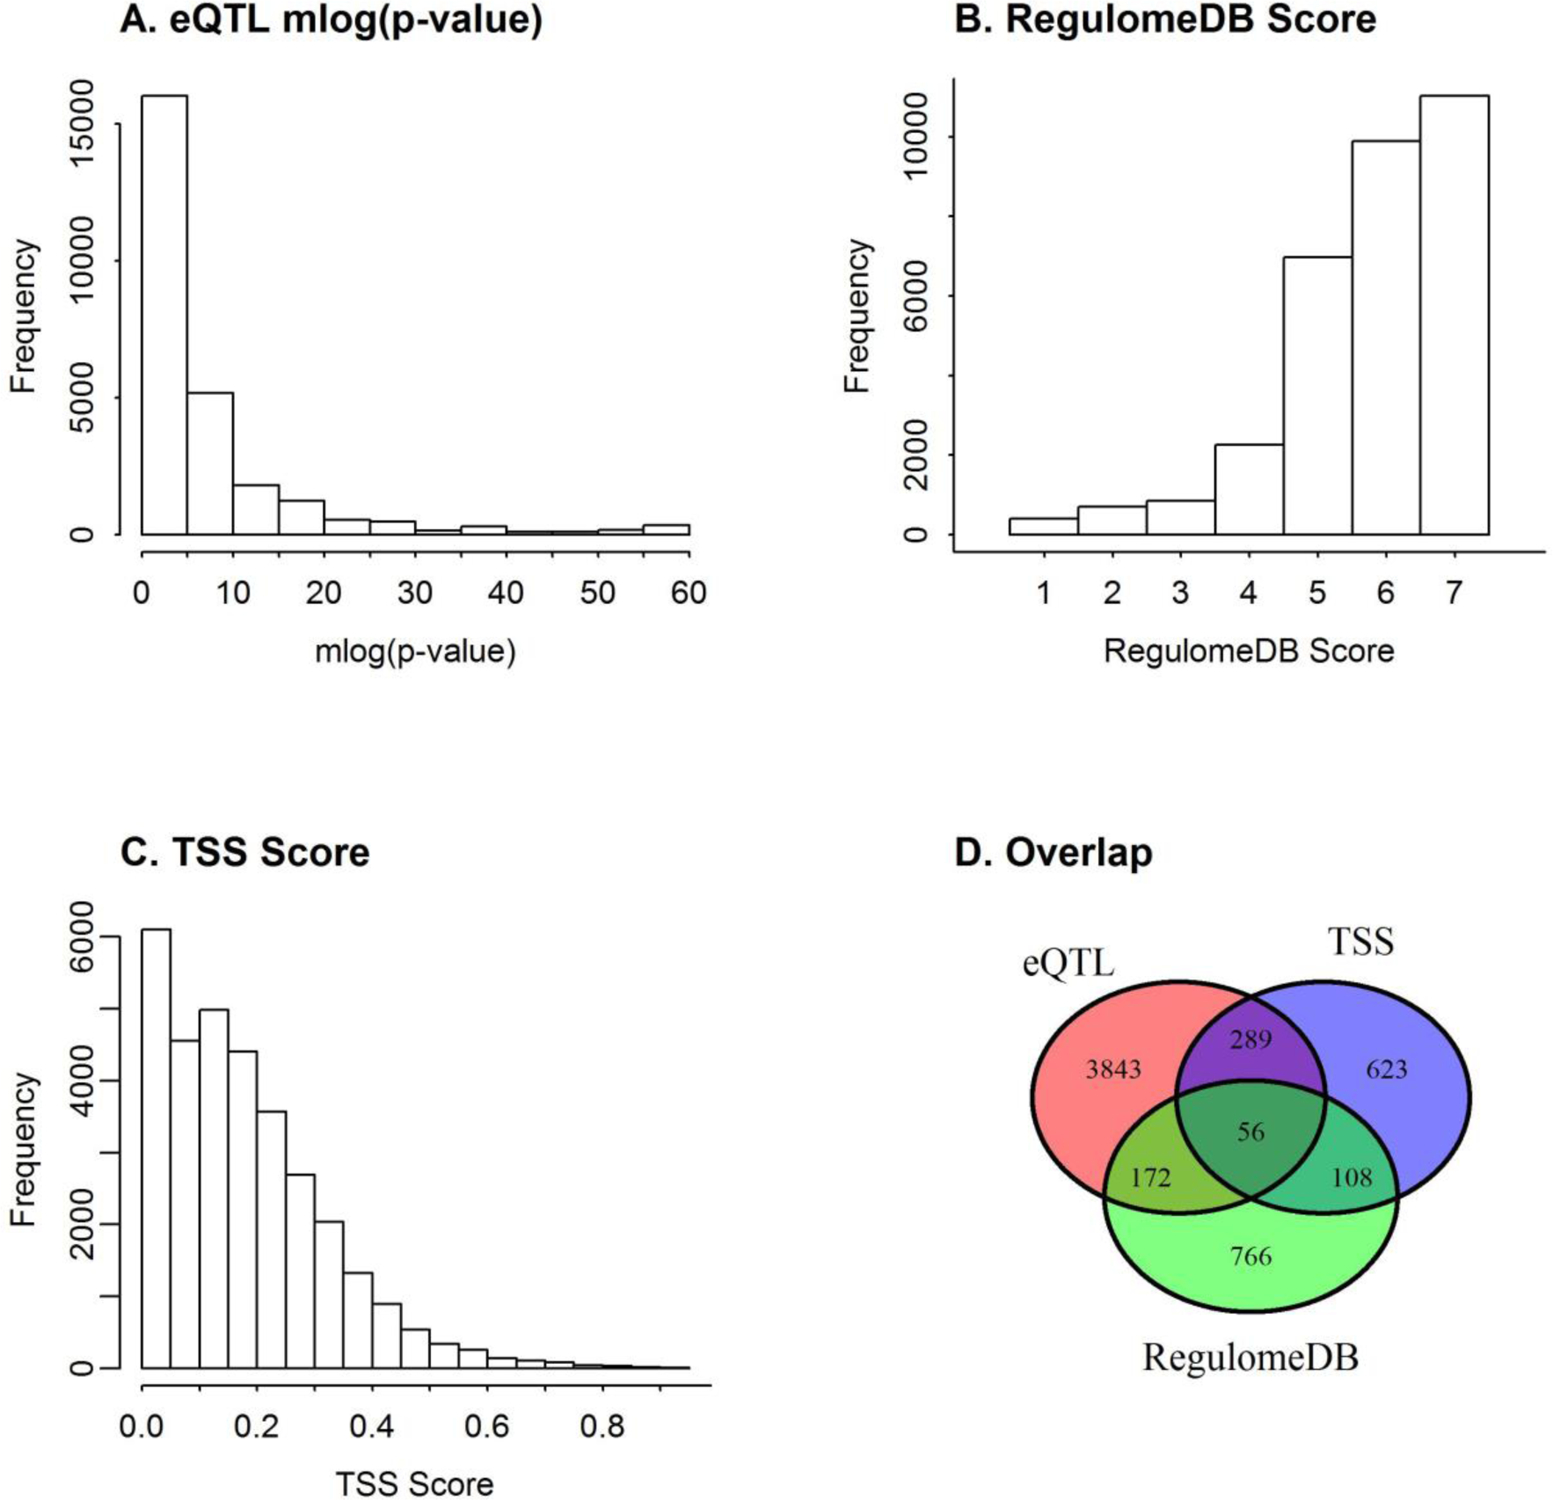
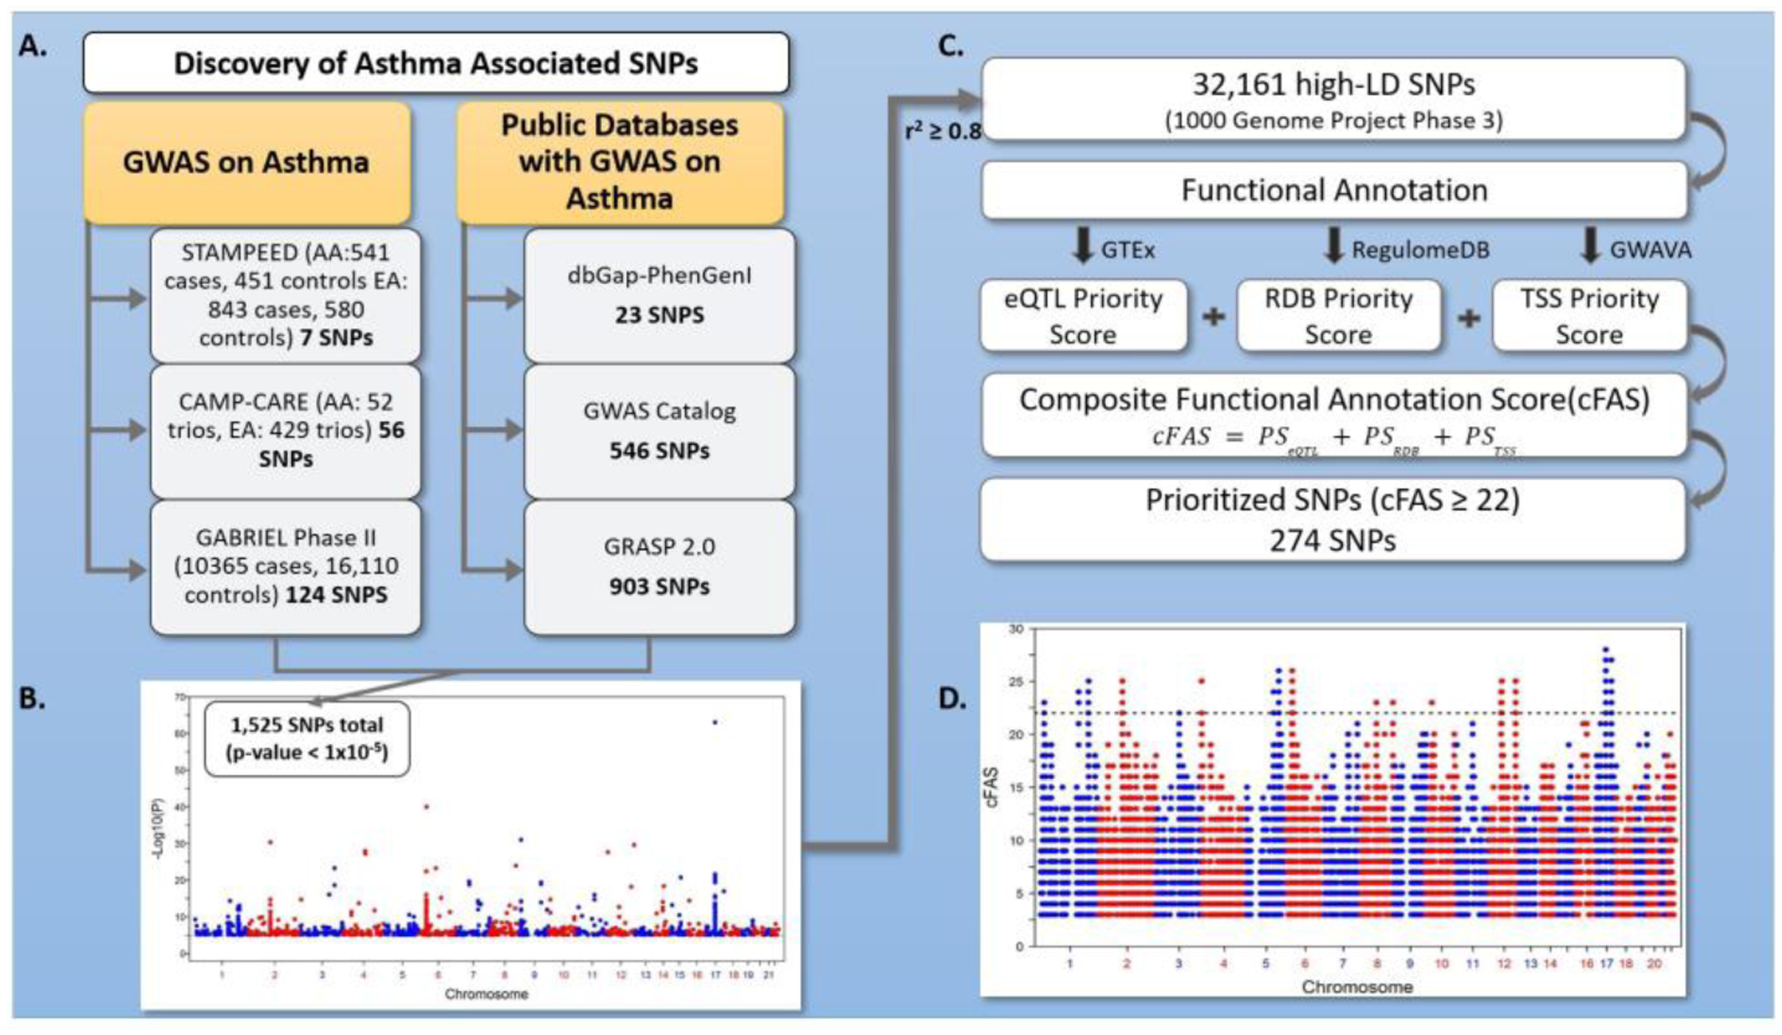
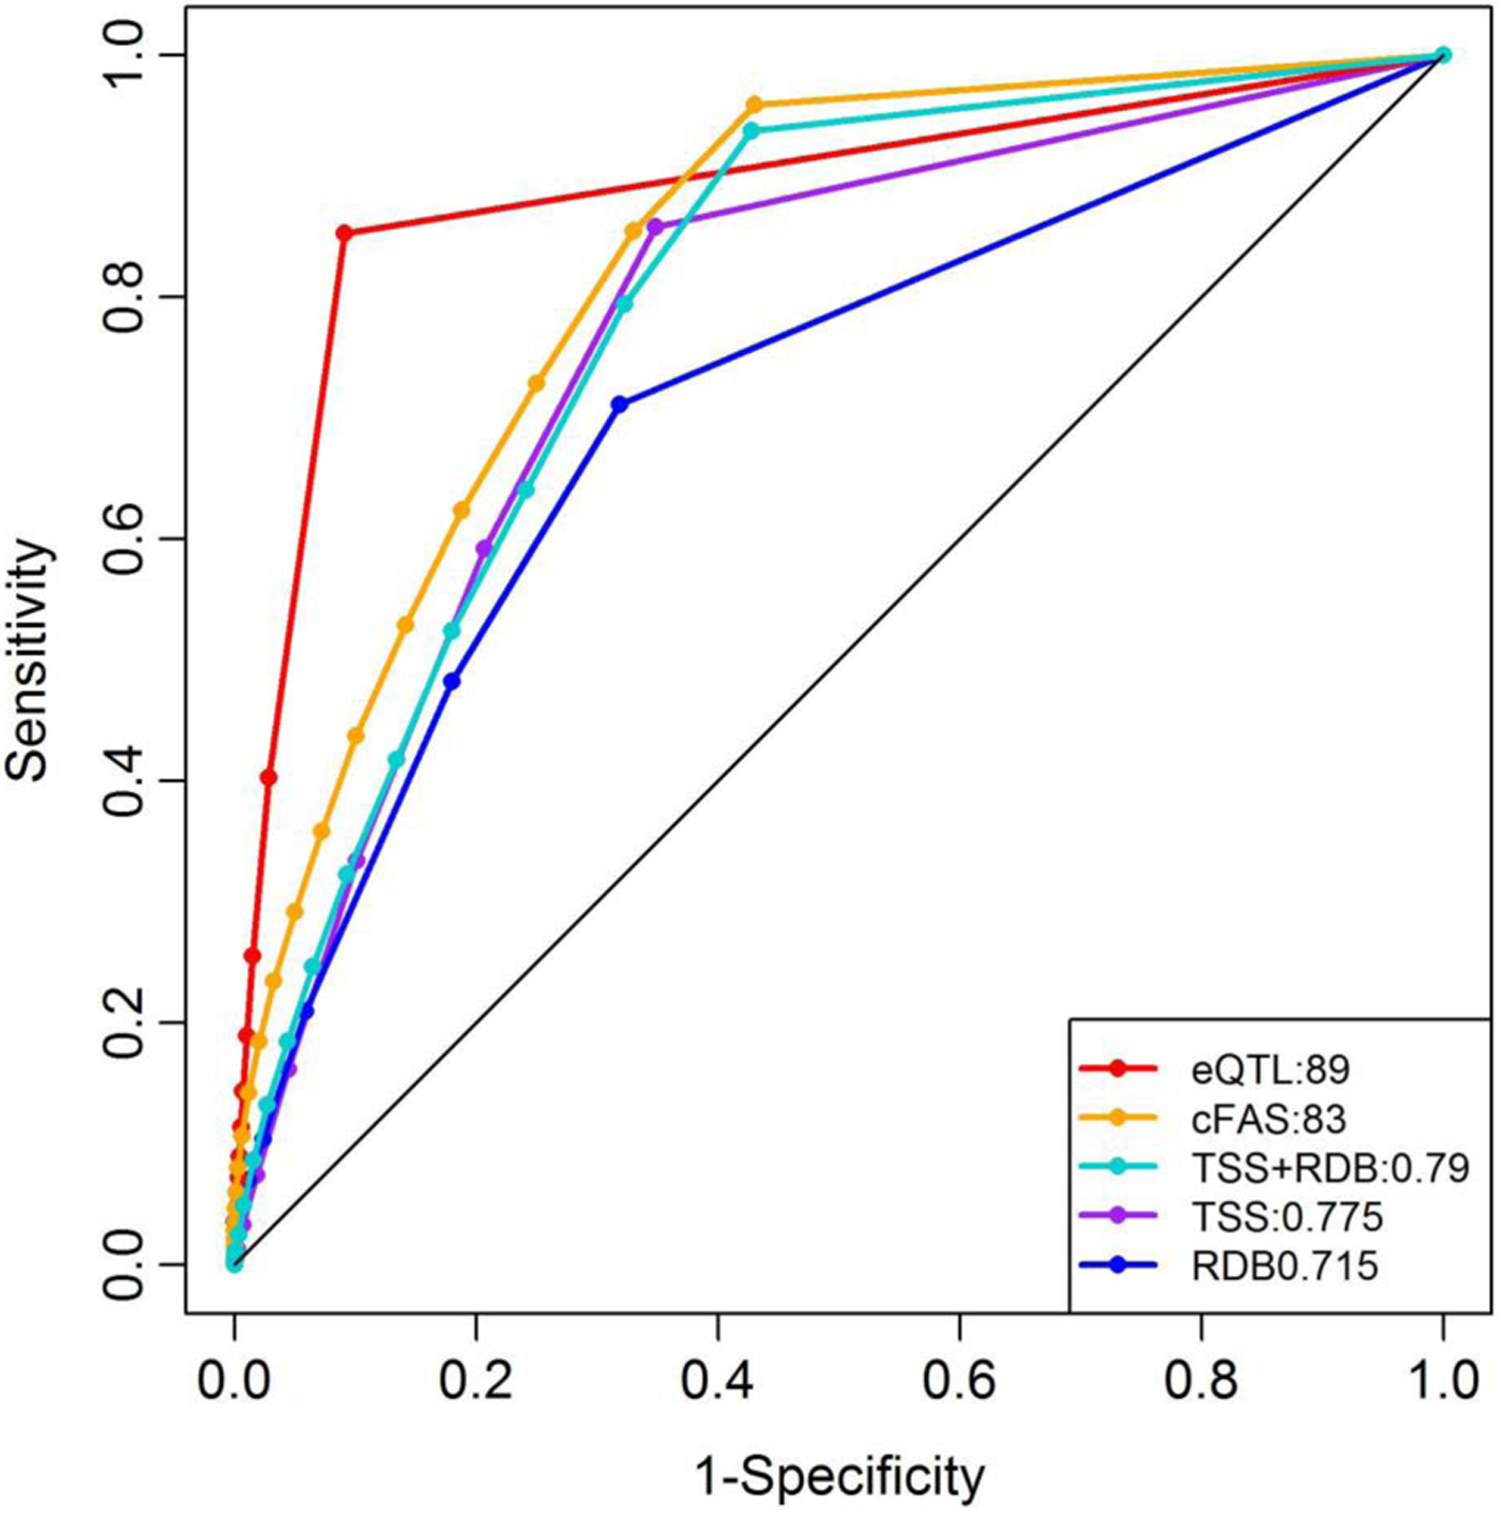
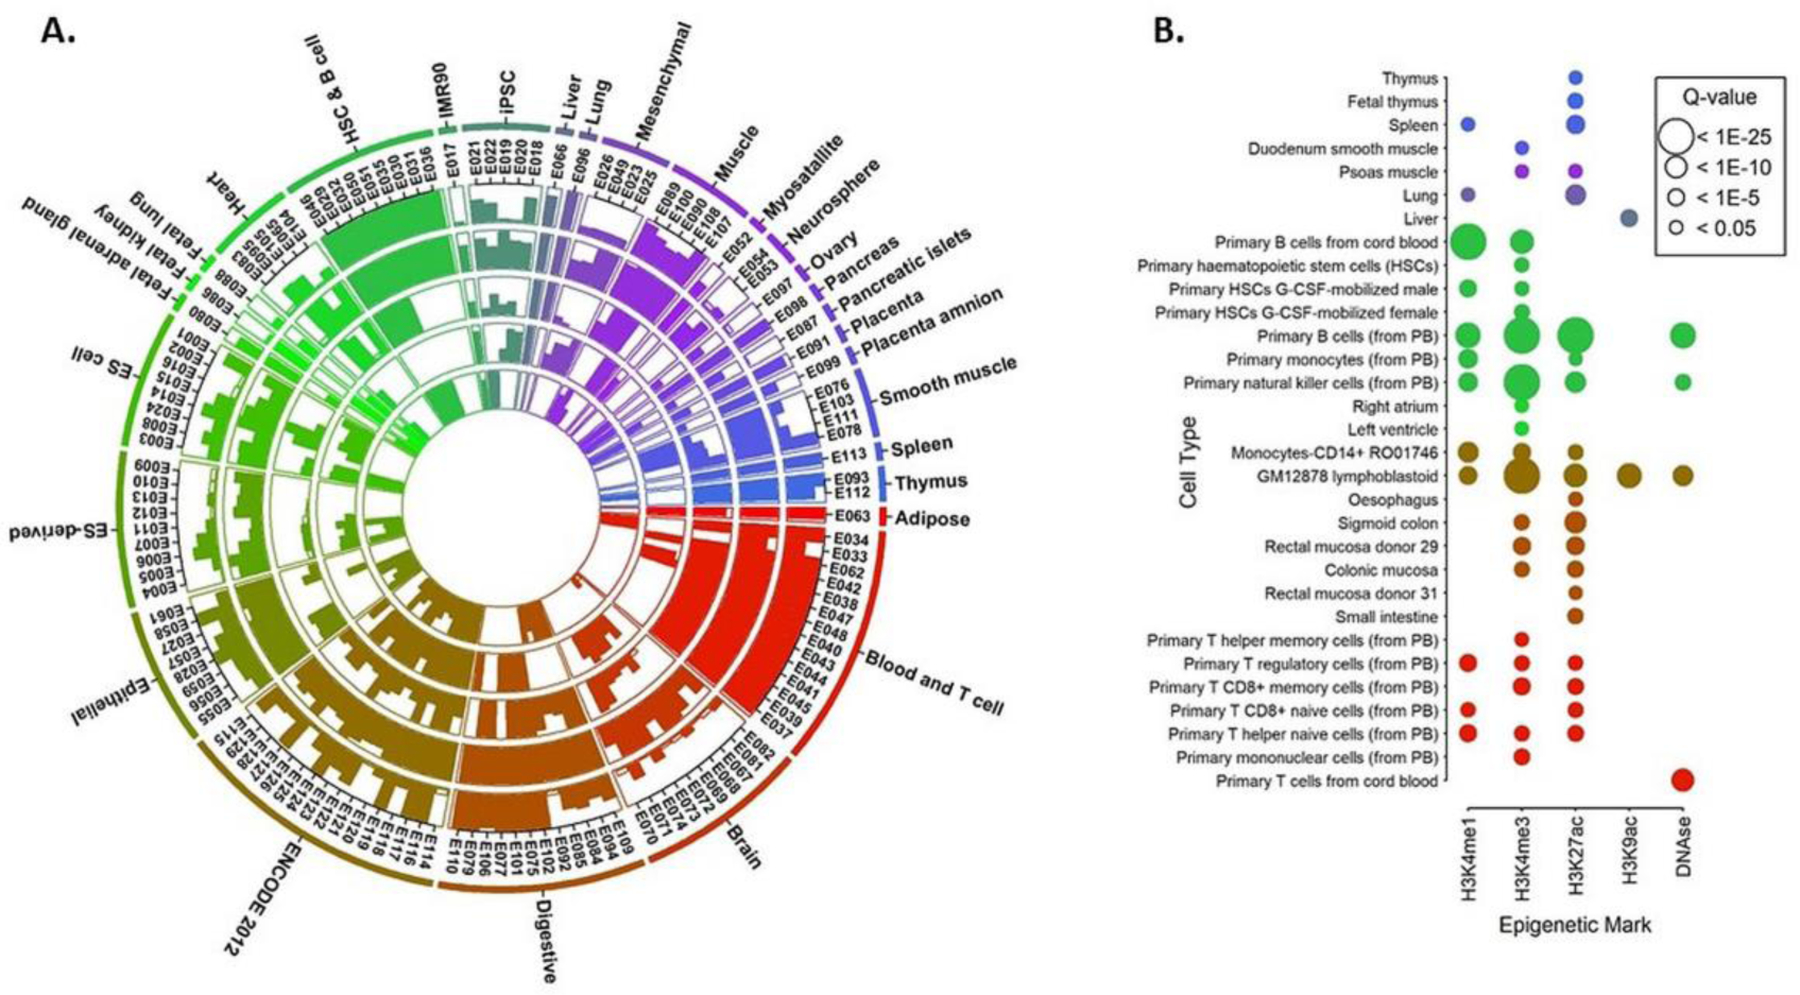
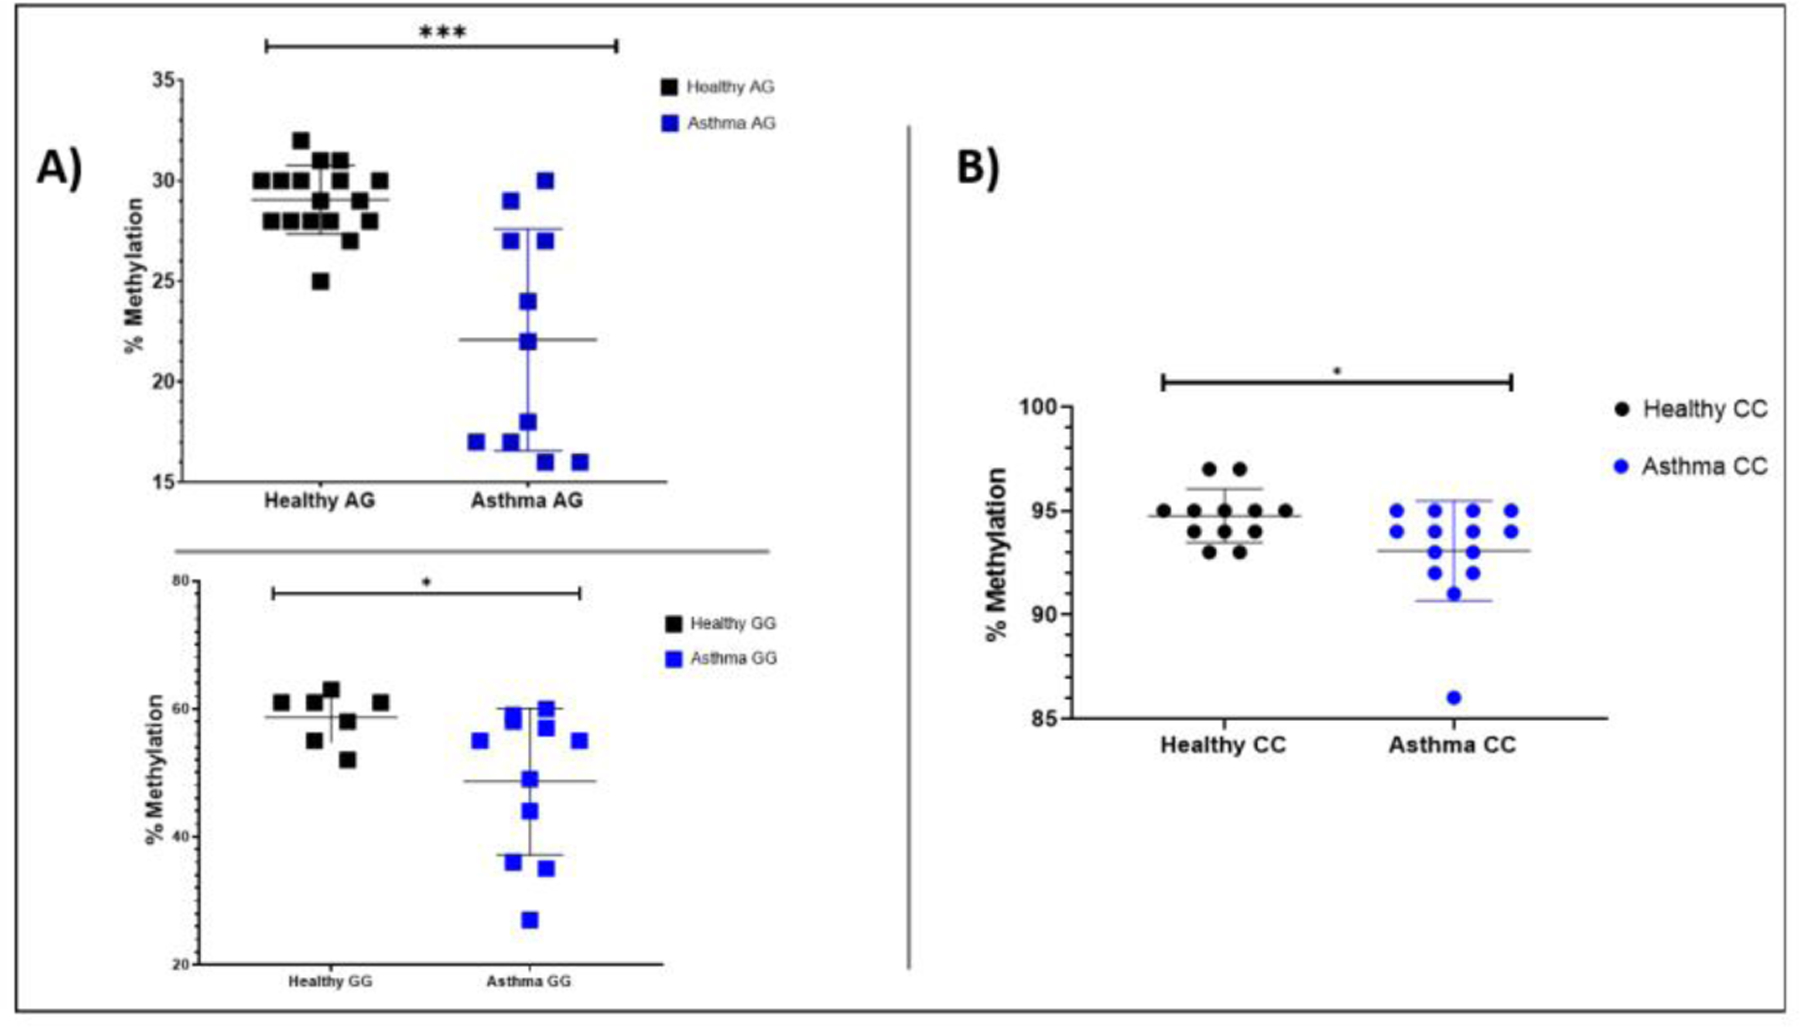
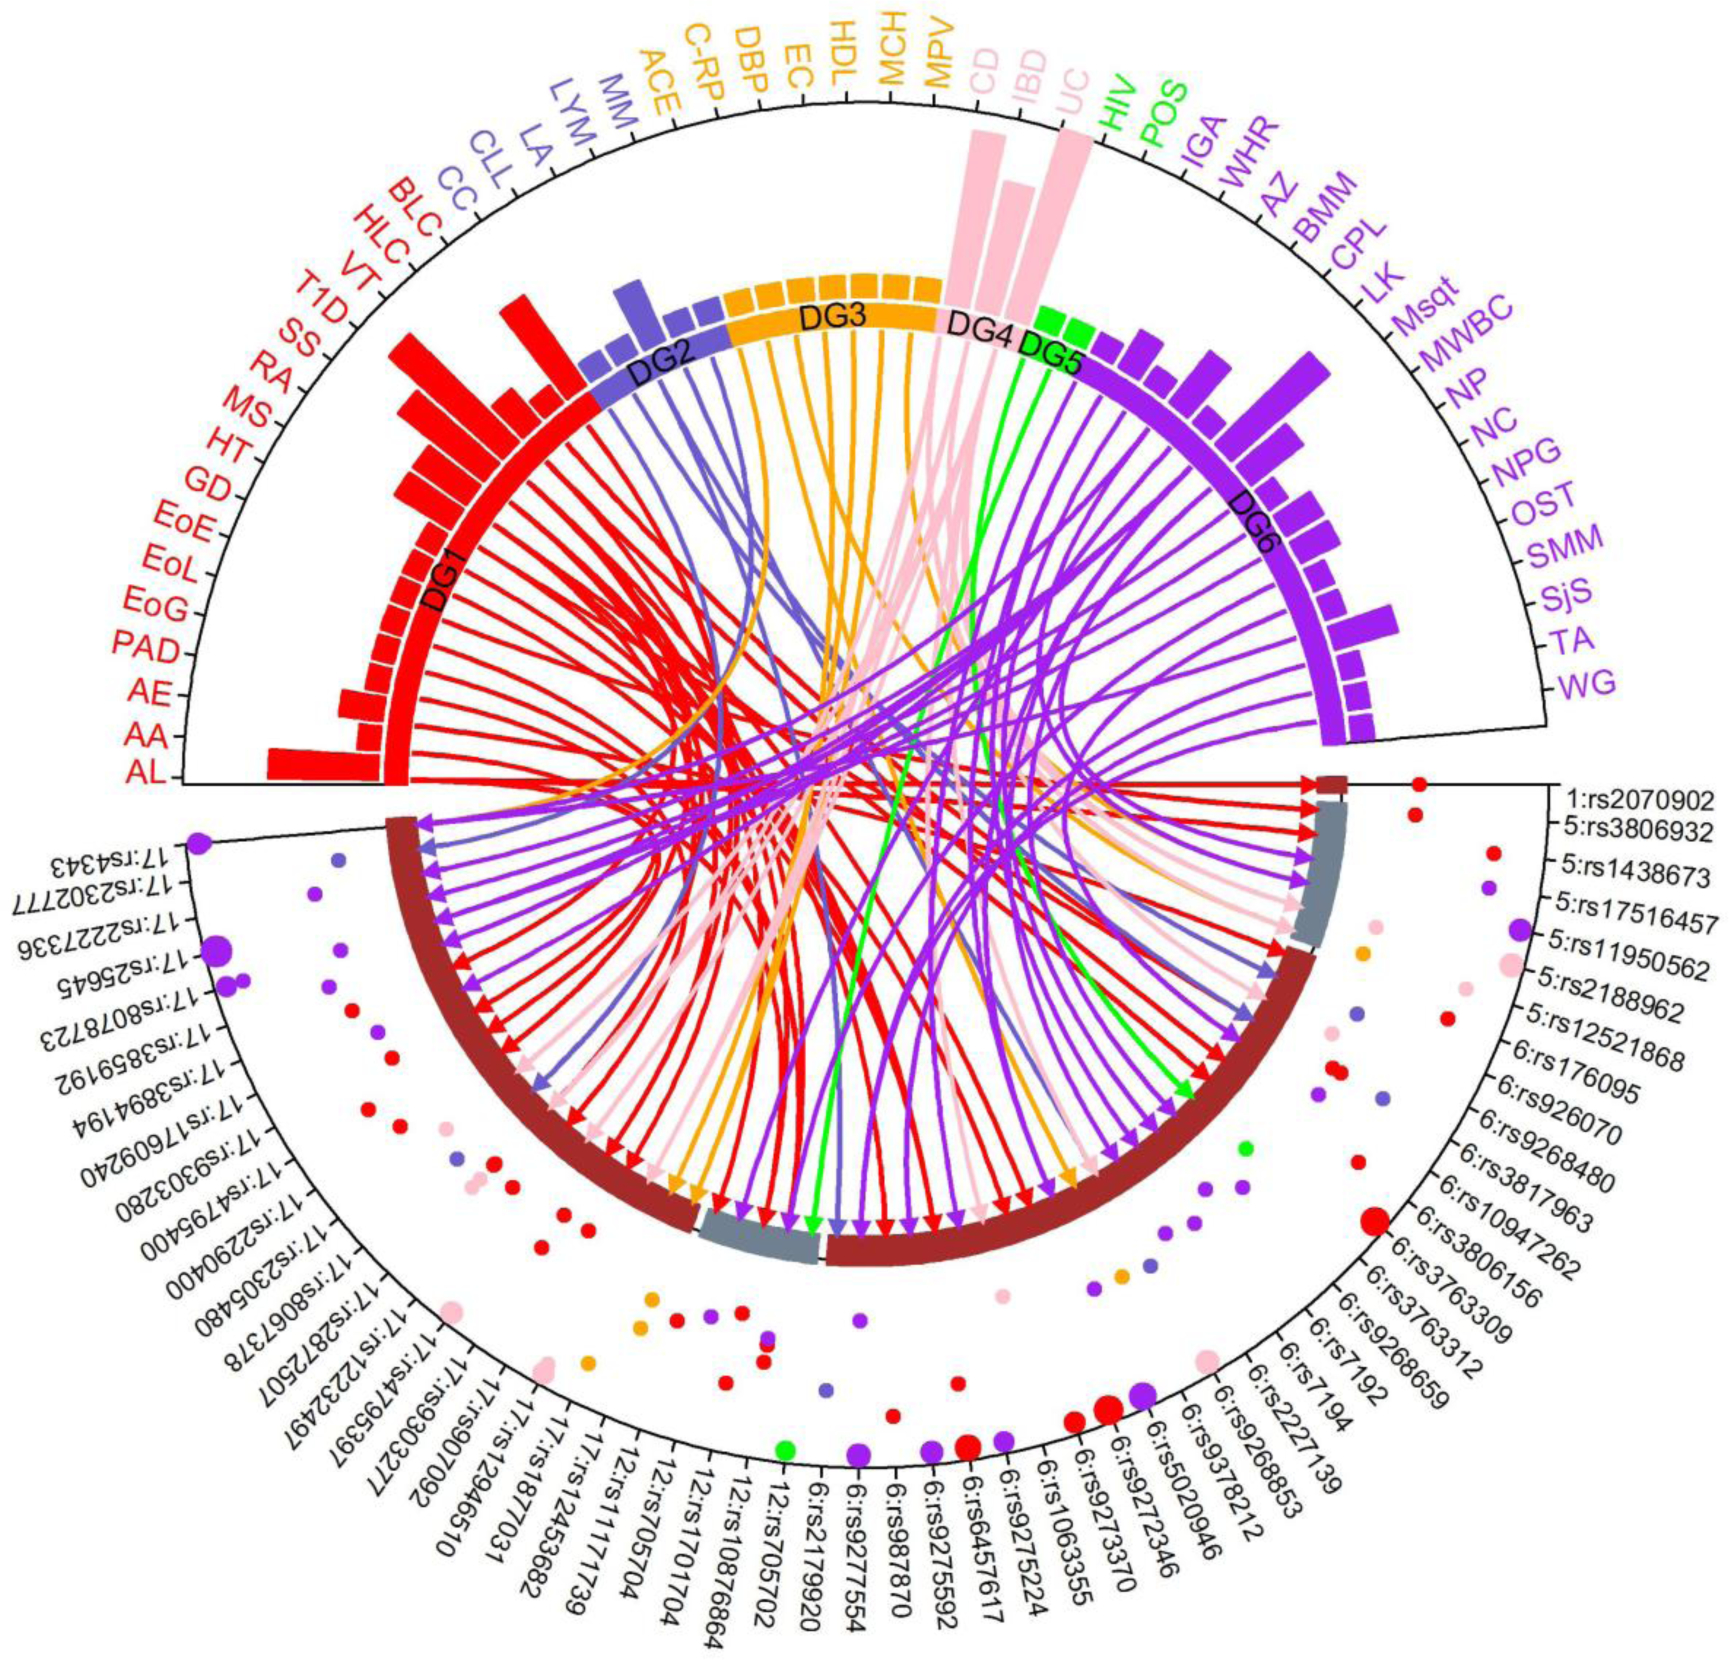
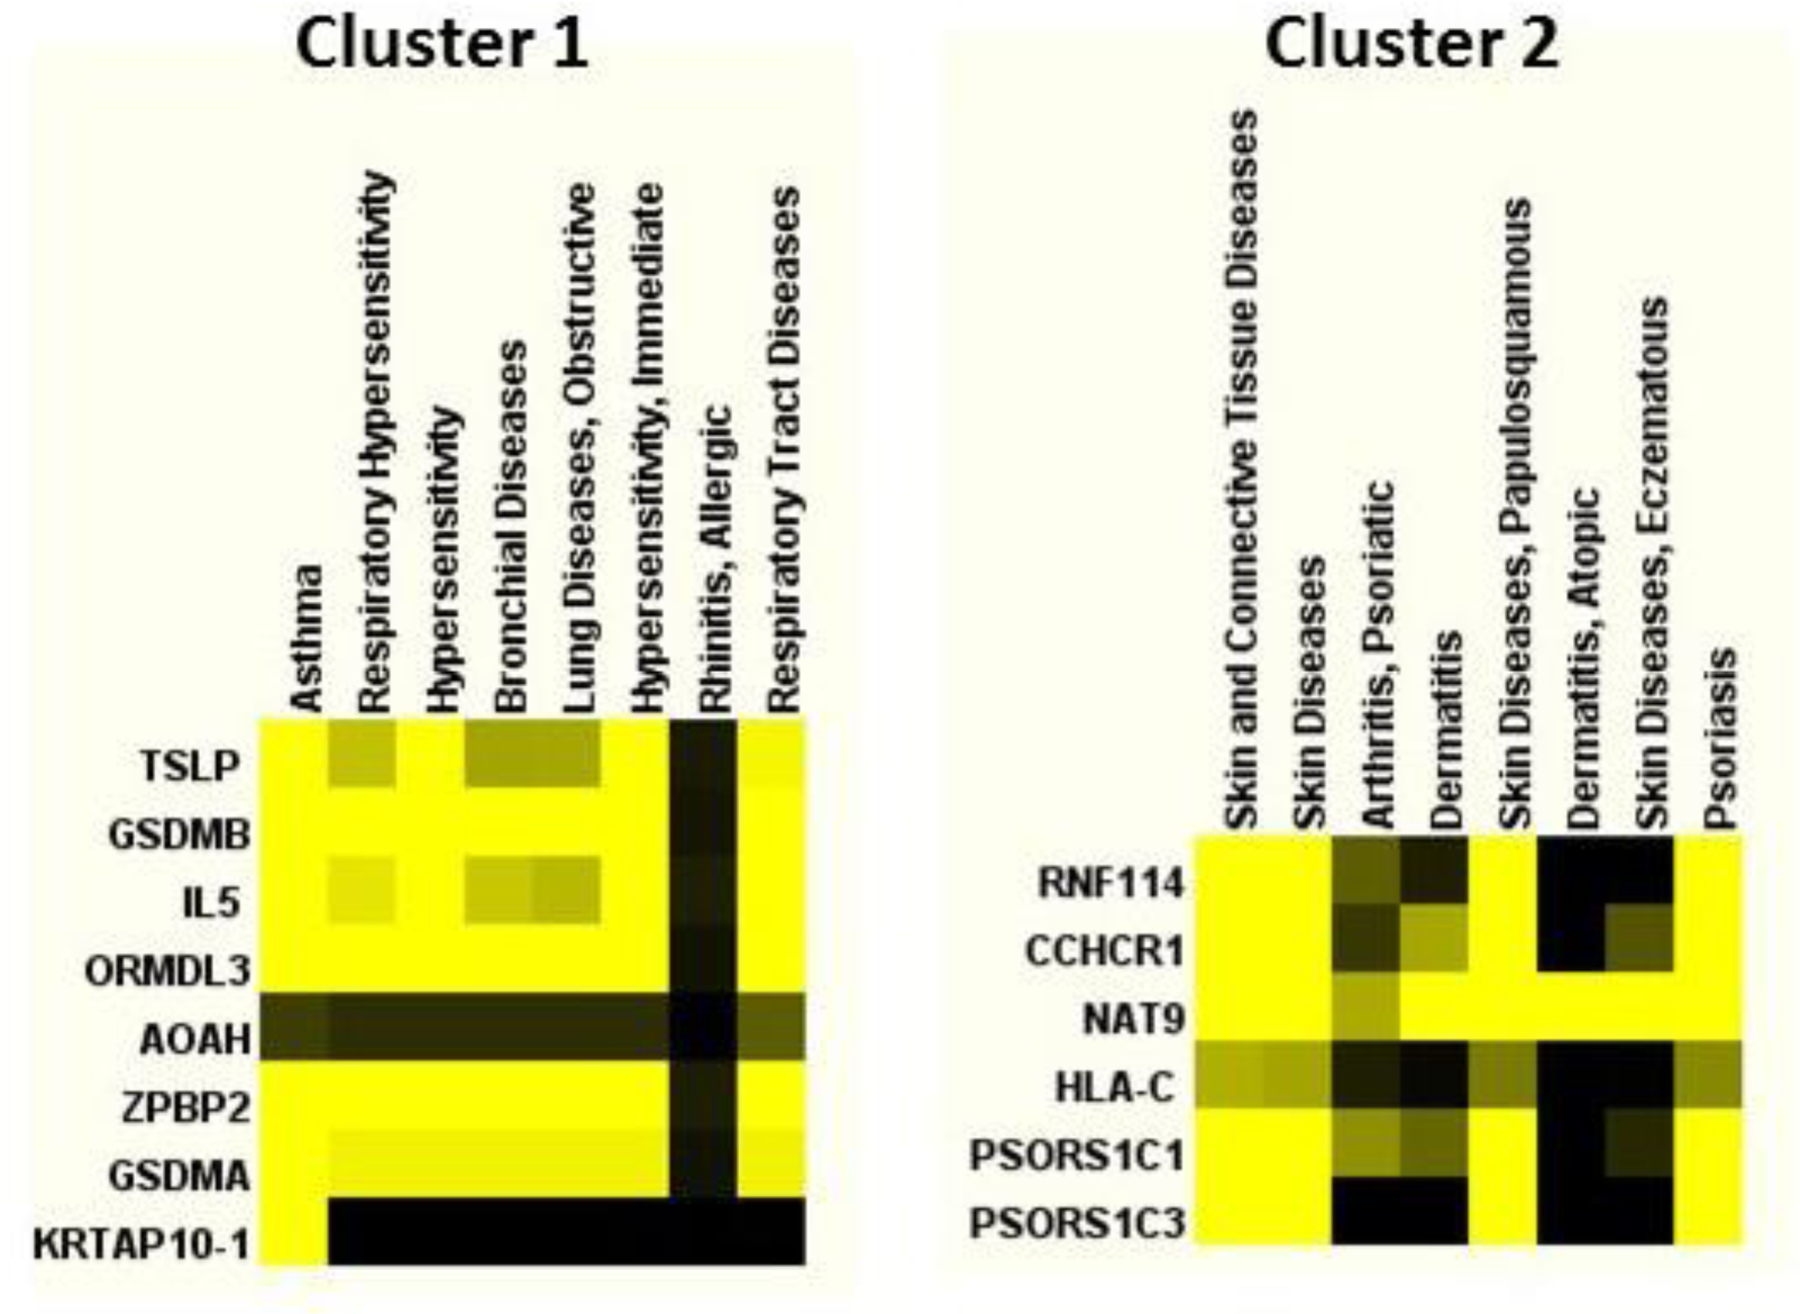
Genome-wide association studies (GWAS) have identified hundreds of primarily non-coding disease-susceptibility variants that further need functional interpretation to prioritize and discriminate the disease-relevant variants. We present a comprehensive genome-wide non-coding variant prioritization scheme followed by validation using Pyrosequencing and TaqMan assays in asthma. We implemented a composite Functional Annotation Score (cFAS) to investigate over 32,000 variants consisting of 1525 GWAS-lead asthma-susceptibility variants and their LD proxies (r2 ≥ 0.80). Functional annotation pipeline in cFAS revealed 274 variants with significant score at 1% false discovery rate. This study implicates a novel locus 4p16 (SLC26A1) with eQTL variant (rs11936407) and known loci in 17q12-21 and 5q22 which encode ORM1-like protein 3 (ORMDL3, rs406527, and rs12936231) and thymic stromal lymphopoietin (TSLP, rs3806932 and rs10073816) epithelial gene, respectively. Follow-up validation analysis through pyrosequencing of CpG sites in and nearby rs4065275 and rs11936407 showed genotype-dependent hypomethylation on asthma cases compared with healthy controls. Prioritized variants are enriched for asthma-specific histone modification associated with active chromatin (H3K4me1 and H3K27ac) in T cells, B cells, lung, and immune-related interferon gamma signaling pathways. Our findings, together with those from prior studies, suggest that SNPs can affect asthma by regulating enhancer activity, and our comprehensive bioinformatics and functional analysis could lead to biological insights into asthma pathogenesis.Graphic abstract.


Conflict of interest statement

Disclosure Statement

The authors declare no conflict of interest.

Figures

Fig 1.
Fig 1.. Workflow of asthma associated variants discovery and prioritization scheme.
A) Flow chart shows the different sources of asthma-associated SNPs and selection process discovering asthma-associated variants. AA = African American, EA = European American. B) Manhattan plots for GWAS-lead asthma variants. Asthma associated SNPs with significance cutoff p-value < 1E-5 from multiple GWAS studies and public catalogs were used. C) Variant prioritization step. Schematic approach of variant annotation and assigning composite functional annotation score (cFAS). D) Manhattan plot of the composite cFAS. Horizontal dashed line shows the cutoff score cFAS = 22 used for the variant prioritization
Fig 2.
Fig 2.. Distribution of functional annotation scores.
A) Histogram of eQTL p-value from the GTEx project. B) Bar plot of the RegulomeDB scores. C) Histogram of the GWAVA TSS score. D) Venn diagram showing the overlap of variants with eQTL p-value < 1E-12, RegulomeDB score ≤ 2, and TSS ≥ 0.5.
Fig 3.
Fig 3.. Comparison of several functional prioritization tools performance.
Receiver Operating Curves (ROC) for eQTL, TSS, RDB, TSS+RDB, and cFAS based on the GWAS association and random control sets. The area under the curve (AUC) is shown in the legend next to the name of each approach. eQTL = Expression quantitative trait loci, TSS = Transcription start site score from GWAVA tool, RDB = RegulomeDB, TSS+RDB = Combination of TSS and RDB prioritization scores, cFAS = Composite functional annotation score.
Fig 4.
Fig 4.. Functional annotation enrichment analysis.
A) Circular plot shows the enrichment of the prioritized variants on 127 reference epigenomes from the Roadmap and ENCODE project against a random set of GWAS variants. The outermost circle represents the tissue/cell line types on different colors. Moving inwards, the circles represent the enrichment results for the H3K4me1, H3K4me3, H3K27ac, H3K9ac, and DNase I hypersensitive marks. Solid bars indicate enrichment of the prioritized variants on the corresponding reference epigenome is significant at FDR < 0.05. Height of the bar represents the –log10(p) of the p-value from the enrichment analysis. B) Cell type specific enrichment of the histone marks and DNase I hypersensitive marks against a prioritized set of GWAS variants with cFAS ≥ 16 as the background set. The size of circle is proportional to the adjusted p-value. Q-value = adjusted p-value using Benjamini-Hochberg procedure.
Fig 5.
Fig 5.. Methylation of select cFAS variants rs4065275 and rs11936407.
Plots show genotype specific hypomethylation at the selected sites among asthma patients compared to healthy controls. A) Scatter plots show the differences in percent methylation between asthma cases and healthy controls for the AG (top panel) and GG (bottom panel) genotypes at SNP rs4065275., respectively. B) Scatter plot shows the differences in percent methylation between asthma cases and healthy controls for the CC genotype at SNP rs11936407. * p-value < 0.50, *** p-value < 0.001.
Fig 6.
Fig 6.. Shared etiology analysis.
Circular plot shows mapping of asthma risk variants and diseases sharing the asthma risk-variants. The upper half of the plot shows the list of diseases and the bottom half shows the overlapped SNPs. The bars in the plot show the number of SNPs overlapped between the disease and asthma. Diseases are classified into 8 different groups following Wang et al. except the CD, UC, and IBD are grouped into digestive group (Wang et al. 2015). The y-axis of the lower part of plot shows the –log(p) of the significance p-value of the association between the disease and the SNPs. If the –log(p) > 25, a larger circular dot is used with the radius proportion to the ratio – log(p)/25. The connector lines from the diseases to SNPs show the disease-SNP map with color code reflecting the disease group.
Fig 7.
Fig 7.. Functional ontology based clustering of prioritized variants.
Plot shows the functional clustering analysis of asthma variants based on prioritized variants and using the Literature Lab™ from Acumenta Biotech (http://acumenta.com/).

References

    1. Barnes KC (2011) Genetic studies of the etiology of asthma Proc Am Thorac Soc 8:143–148 doi: 10.1513/pats.201103-030MS - DOI - PMC - PubMed
    1. Barnes PJ, Adcock IM (1998) Transcription factors and asthma Eur Respir J 12:221–234 - PubMed
    1. Baye TM et al. (2011) Differences in candidate gene association between European ancestry and African American asthmatic children PLoS One 6:e16522 doi: 10.1371/journal.pone.0016522 - DOI - PMC - PubMed
    1. Benjamini Y, Hochberg Y (1995) Controlling the False Discovery Rate: A Practical and Powerful Approach to Multiple Testing. Journal of Royal Statistical Society Series B (Methodological) 57:298–300
    1. Boyle AP et al. (2012) Annotation of functional variation in personal genomes using RegulomeDB Genome Res 22:1790–1797 doi: 10.1101/gr.137323.112 - DOI - PMC - PubMed