. 2020 Jun:36:100967.
doi: 10.1016/j.molmet.2020.02.010. Epub 2020 Mar 5.

Genetic deletion of microRNA biogenesis in muscle cells reveals a hierarchical non-clustered network that controls focal adhesion signaling during muscle regeneration

Affiliations

Genetic deletion of microRNA biogenesis in muscle cells reveals a hierarchical non-clustered network that controls focal adhesion signaling during muscle regeneration

Edlira Luca et al. Mol Metab. 2020 Jun.

Abstract

Objective: Decreased muscle mass is a major contributor to age-related morbidity, and strategies to improve muscle regeneration during ageing are urgently needed. Our aim was to identify the subset of relevant microRNAs (miRNAs) that partake in critical aspects of muscle cell differentiation, irrespective of computational predictions, genomic clustering or differential expression of the miRNAs.

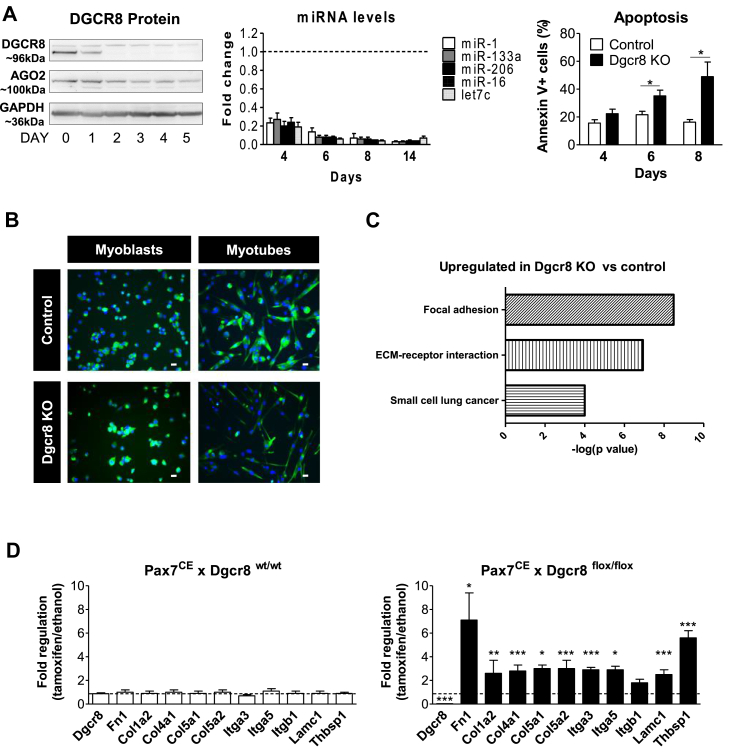
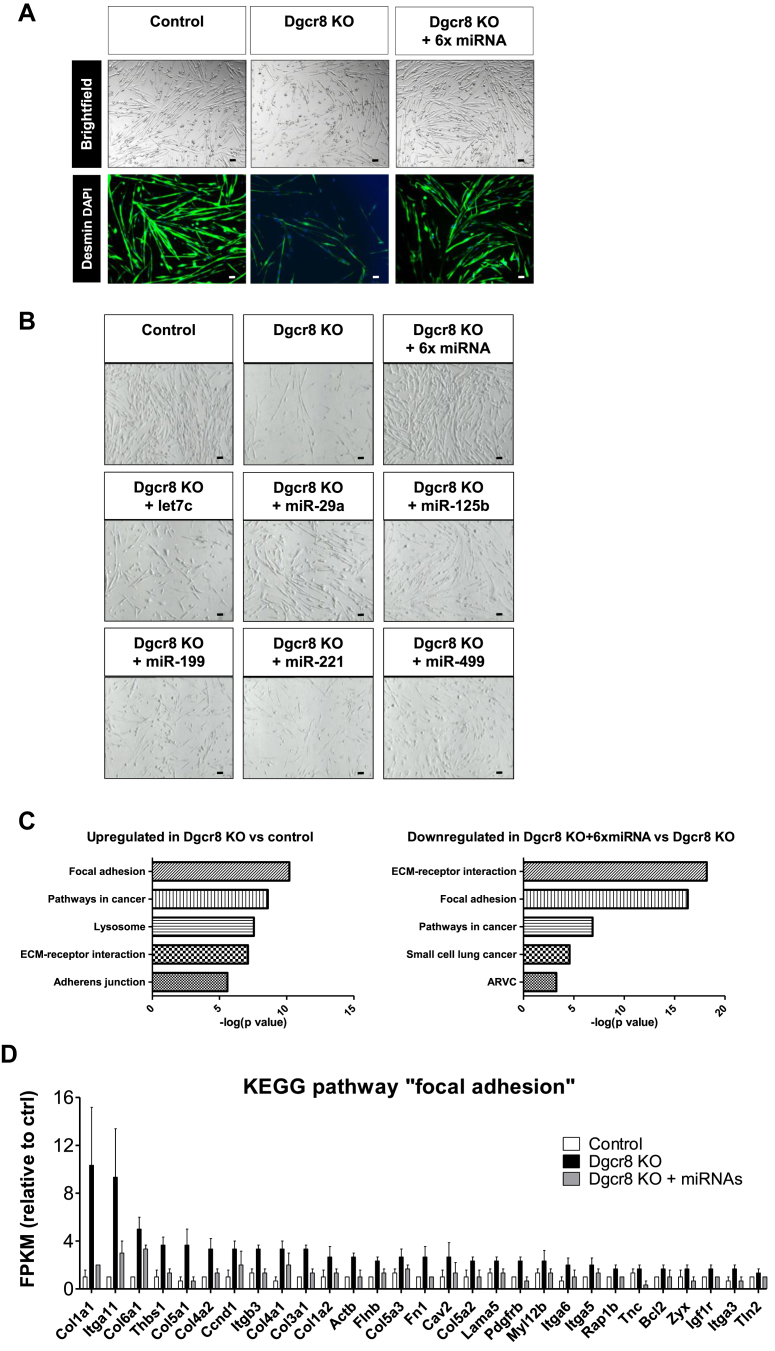
Methods: miRNA biogenesis was deleted in primary myoblasts using a tamoxifen-inducible CreLox system and combined with an add-back miRNA library screen. RNA-seq experiments, cellular signalling events, and glycogen synthesis, along with miRNA inhibitors, were performed in human primary myoblasts. Muscle regeneration in young and aged mice was assessed using the cardiotoxin (CTX) model.

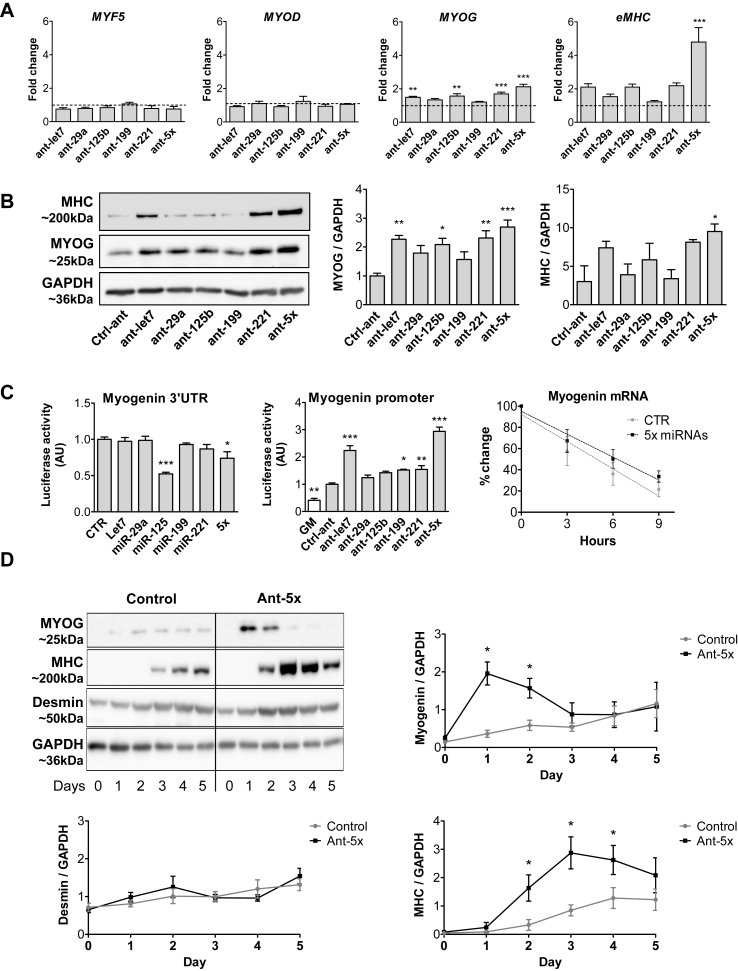
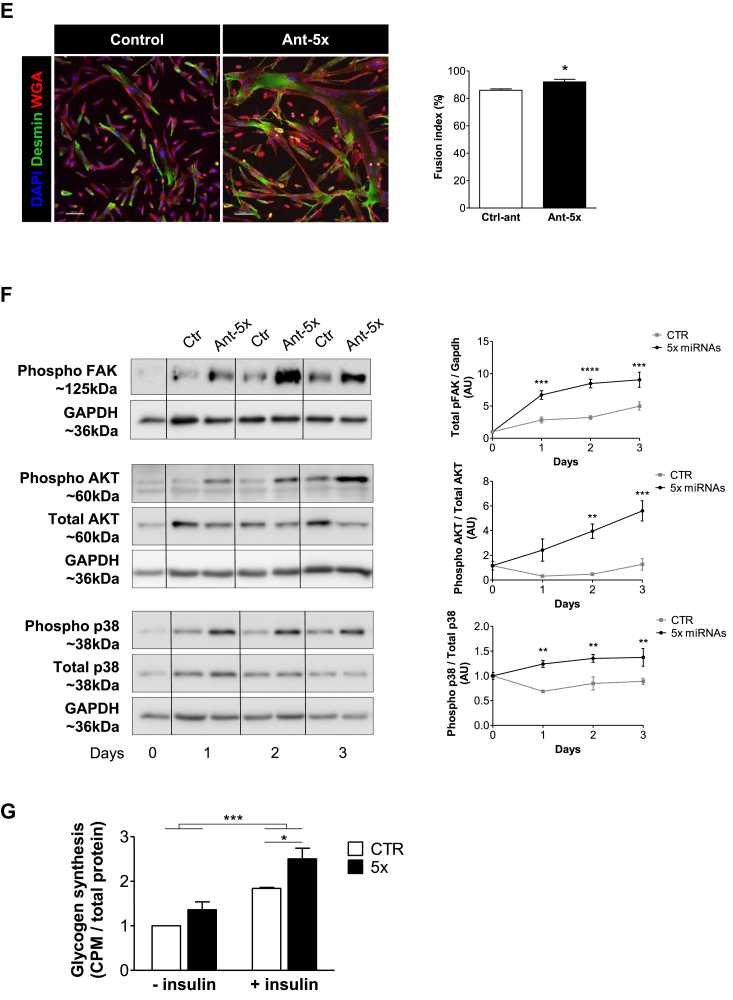
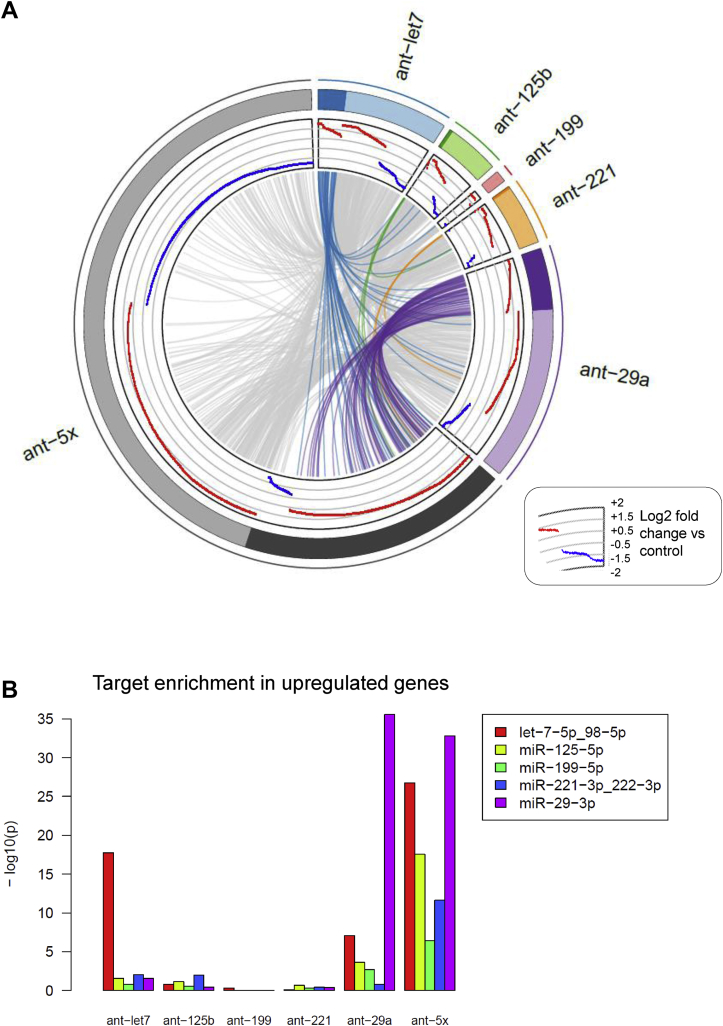
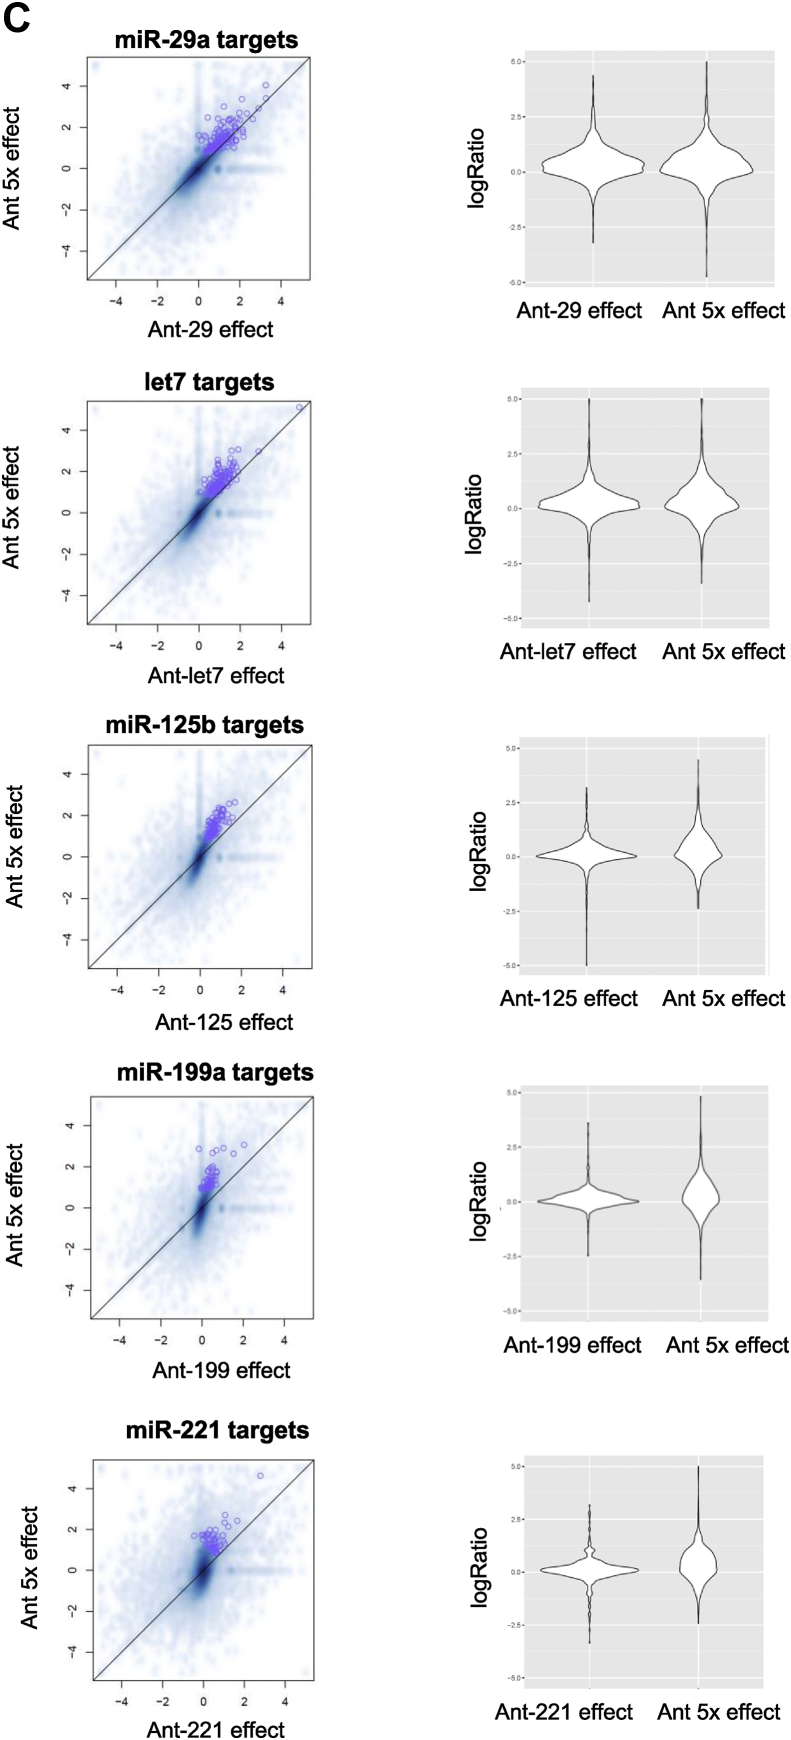
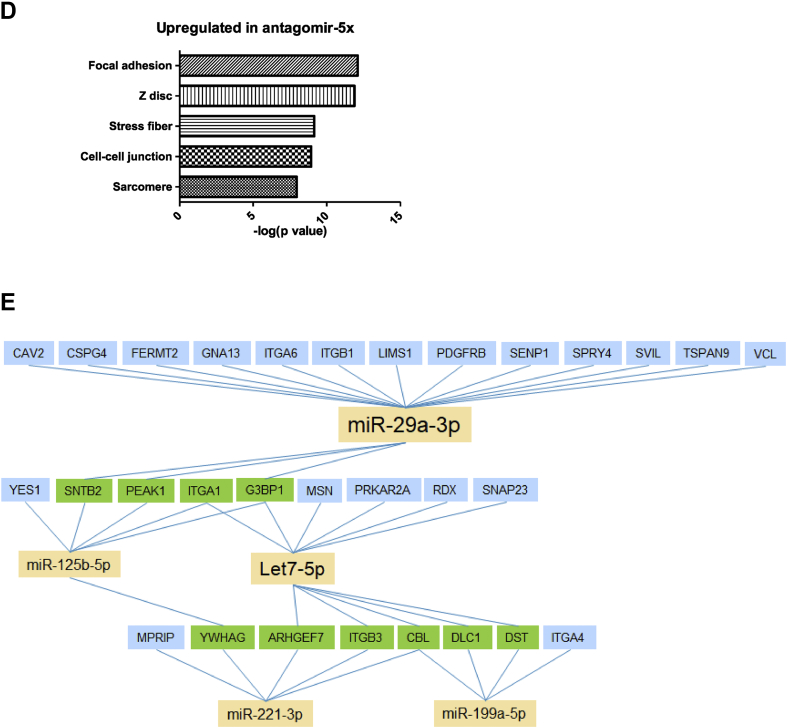
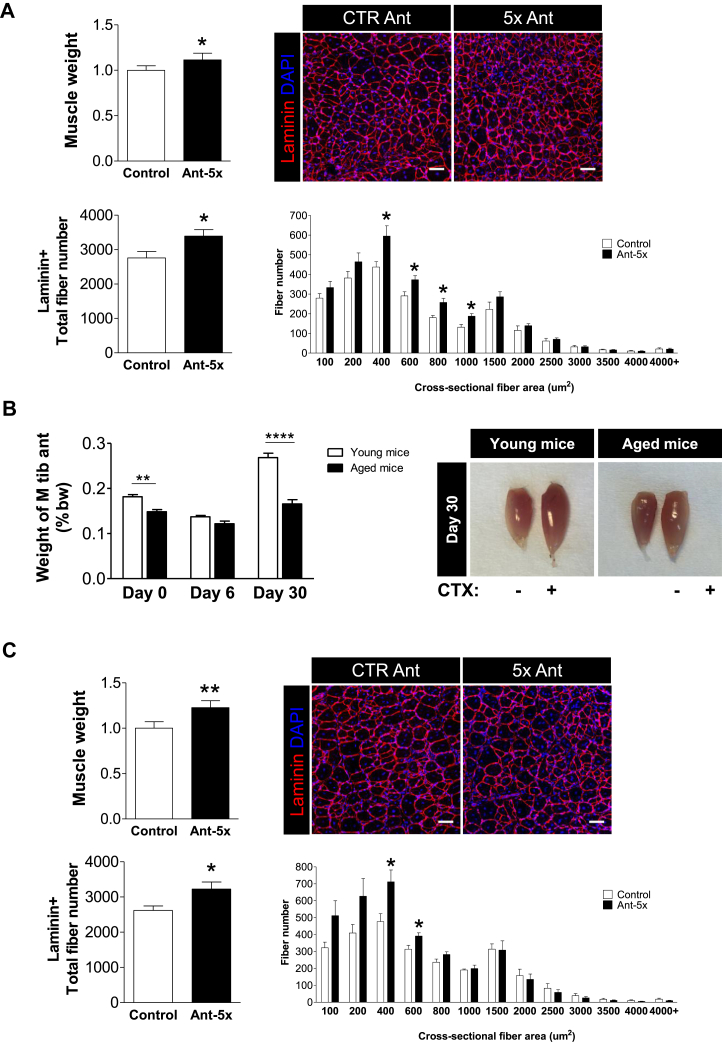
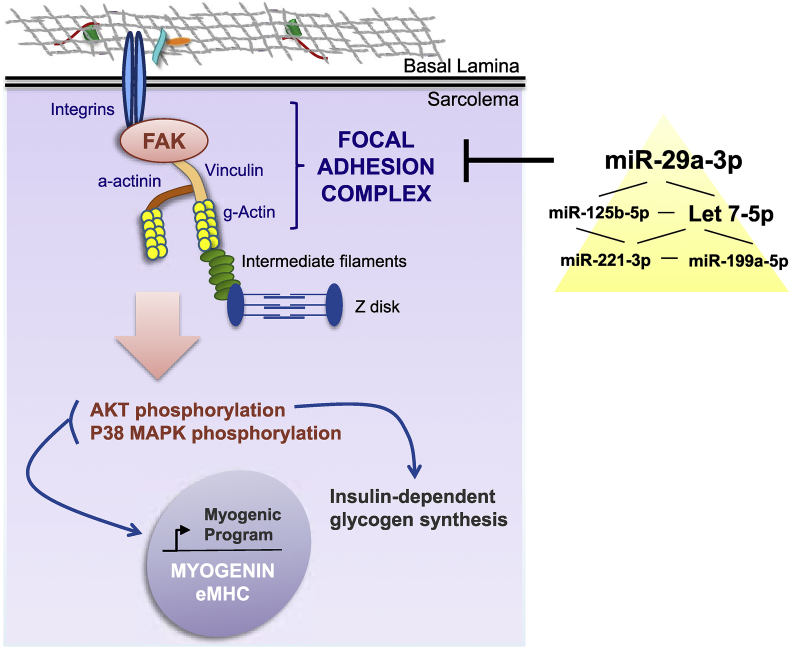
Results: We identified a hierarchical non-clustered miRNA network consisting of highly (miR-29a), moderately (let-7) and mildly active (miR-125b, miR-199a, miR-221) miRNAs that cooperate by directly targeting members of the focal adhesion complex. Through RNA-seq experiments comparing single versus combinatorial inhibition of the miRNAs, we uncovered a fundamental feature of this network, that miRNA activity inversely correlates to miRNA cooperativity. During myoblast differentiation, combinatorial inhibition of the five miRNAs increased activation of focal adhesion kinase (FAK), AKT, and p38 mitogen-activated protein kinase (MAPK), and improved myotube formation and insulin-dependent glycogen synthesis. Moreover, antagonizing the miRNA network in vivo following CTX-induced muscle regeneration enhanced muscle mass and myofiber formation in young and aged mice.

Conclusion: Our results provide novel insights into the dynamics of miRNA cooperativity and identify a miRNA network as therapeutic target for impaired focal adhesion signalling and muscle regeneration during ageing.

Keywords: Focal adhesion signalling; Glycogen synthesis; Primary human muscle cells; Skeletal muscle regeneration; microRNA network.


Figures

Figure 1
Figure 1
Genetic deletion of the miRNA pathway induces the gene cluster “focal adhesion” in proliferating primary myoblasts. A. Myoblast cultures (Pax7CExDgcr8flox/flox) were incubated for 48 h with tamoxifen to induce Cre recombinase (Dgcr8 KO) or with vehicle (Control). Deletion of Dgcr8 induced a time-dependent decrease of DGCR8 protein (western blotting), miRNA levels (qRT-PCR normalized for sno234, n = 4, control represented by the dashed line) and onset of apoptosis (flow cytometry for annexin V staining, n = 6–11). B. Primary myoblasts were treated as in A and differentiated into myotubes for 48 h four days after the beginning of the tamoxifen incubation (day 4). Desmin (green), nuclear DAPI ((blue), 20× magnification, scale bar = 50 μm. C. KEGG pathway analysis of RNA isolated from proliferating Dgcr8 KO and control myoblasts at day 4. D. Expression of Dcgr8 and members of the KEGG pathway “focal adhesion” in Pax7CExDgcr8wt/wt (control) and Pax7CExDgcr8flox/flox myoblasts measured using qRT-PCR at day 4 after tamoxifen incubation, n = 4. The dashed line represents incubation with vehicle. All results are shown as mean ± SEM. ∗: p < 0.05, ∗∗: p < 0.01, ∗∗∗: p < 0.001, student's t test.
Figure 2
Figure 2
A combination of six miRNAs rescues myotube morphology and reverses induction of the focal adhesion gene cluster following DGCR8 deletion. Dgcr8 KO and control myoblasts were transfected with control mimics, the indicated individual six miRNA mimics or their combination (6× miRNA) two days after beginning of the tamoxifen incubation. Twenty-four hours after transfection, myoblast differentiation was induced for 48 h. Myotube morphology was analyzed using immunofluorescence for desmin (A) and brightfield microscopy (B), 10× magnification. Scale bar = 50 μm. C. KEGG pathway analysis of RNA isolated from control, Dgcr8 myotubes and Dgcr8 myotubes transfected with the combination of six miRNAs. D. RNA levels as determined by RNA deep sequencing in control and DGCR8 knockout cells with or without transfection of the six miRNA mimics, n = 3. Shown are all genes that are significantly upregulated in the knockout cells and significantly downregulated after transfection with the mimics (p value < 0.05 according to manufacturer's analysis).
Figure 3
Figure 3
A combination of five miRNAs accelerates differentiation of human myoblasts and improves insulin sensitivity downstream of FAK signaling. Human primary myoblasts were transfected with equal concentrations of control antagomirs or antagomirs against the indicated miRNAs, either as single antagomirs or in combination (Ant-5x). Twenty-four hours after transfection, differentiation was induced for two days (A, B, C, E, G) or up to five days (D, F). A. Gene expression of myogenic regulatory factors and eMHC was analyzed by qRT-PCR and normalized for 18S RNA, n = 5. B. Protein expression of myogenin and eMHC was analyzed by western blot and normalized to GAPDH (n = 4–6). C. Luciferase vectors harboring either the myogenin 3′UTR (n = 4) or promoter region (n = 5) were transfected with miRNA mimics or antagomirs respectively. Myogenin mRNA from control and Ant-5x treated samples was measured by qRT-PCR at the indicated time points following Actinomycin D administration (n = 3). D. Time course of myogenin and eMHC protein expression during five days of differentiation, normalized to GAPDH (n = 4–6). E. Immunofluorescent analysis of myotube formation using anti-desmin and wheat germ agglutinin (WGA). Fusion index was calculated as percentage of nuclei present in cells containing at least two nuclei compared to all nuclei per well (scale bar 100um, n = 4). F. Phosphorylation of p38 MAPK, AKT and FAK during the first three days of differentiation, n = 4. G. Insulin-dependent glycogen synthesis, n = 3. ∗: p < 0.05, ∗∗: p < 0.01, ∗∗∗: p < 0.001, A, B, C: One way-ANOVA with Dunnett's multiple comparison test, D,E, F: student's t test. G: Two way-ANOVA. All results are shown as mean ± SEM.
Figure 3
Figure 3
A combination of five miRNAs accelerates differentiation of human myoblasts and improves insulin sensitivity downstream of FAK signaling. Human primary myoblasts were transfected with equal concentrations of control antagomirs or antagomirs against the indicated miRNAs, either as single antagomirs or in combination (Ant-5x). Twenty-four hours after transfection, differentiation was induced for two days (A, B, C, E, G) or up to five days (D, F). A. Gene expression of myogenic regulatory factors and eMHC was analyzed by qRT-PCR and normalized for 18S RNA, n = 5. B. Protein expression of myogenin and eMHC was analyzed by western blot and normalized to GAPDH (n = 4–6). C. Luciferase vectors harboring either the myogenin 3′UTR (n = 4) or promoter region (n = 5) were transfected with miRNA mimics or antagomirs respectively. Myogenin mRNA from control and Ant-5x treated samples was measured by qRT-PCR at the indicated time points following Actinomycin D administration (n = 3). D. Time course of myogenin and eMHC protein expression during five days of differentiation, normalized to GAPDH (n = 4–6). E. Immunofluorescent analysis of myotube formation using anti-desmin and wheat germ agglutinin (WGA). Fusion index was calculated as percentage of nuclei present in cells containing at least two nuclei compared to all nuclei per well (scale bar 100um, n = 4). F. Phosphorylation of p38 MAPK, AKT and FAK during the first three days of differentiation, n = 4. G. Insulin-dependent glycogen synthesis, n = 3. ∗: p < 0.05, ∗∗: p < 0.01, ∗∗∗: p < 0.001, A, B, C: One way-ANOVA with Dunnett's multiple comparison test, D,E, F: student's t test. G: Two way-ANOVA. All results are shown as mean ± SEM.
Figure 4
Figure 4
Genome-wide identification of differentially expressed genes and miRNA target regulation after single or combinatorial miRNA inhibition in human myotubes. Human myoblasts were transfected with the indicated antagomirs and 24 h after transfection differentiation was induced for two days. RNA was isolated for RNA deep sequencing, n = 3. A. Circos plot of differentially expressed genes (p-value < 0.01 and the absolute log2 fold-change >0.5). Each sector of the plot represents a different antagomir or combination of the antagomirs (ant-5x). Genes with predicted binding sites for the respective miRNA are grouped under the darker color in each sector. Log2 fold-changes are presented in red (upregulation) or blue (downregulation). Genes differentially expressed in more than one condition are joined by grey lines or colored lines in case of predicted target genes. B. Enrichment for the predicted target genes (Targetscan) for the indicated miRNAs was analyzed in the group of upregulated genes for the different antagomir conditions using Fisher's Exact Test. C. Regulation of all predicted target genes after single antagomir treatment was plotted against their regulation after the combinatorial antagomir treatment (left panels). Full distribution of target gene regulation (log ratio) is shown using violin plots (right panels). D. Bar plot of GO terms enriched in the upregulated genes after combinatorial antagomir transfection. E. Network of miRNAs and their predicted target genes from the focal adhesion gene cluster. Blue boxes identify predicted target genes of one miRNA that are significantly upregulated after single and combinatorial antagomir inhibition. Green boxes indicate genes predicted to be targeted by at least two miRNAs that are significantly upregulated after the combinatorial antagomir inhibition.
Figure 4
Figure 4
Genome-wide identification of differentially expressed genes and miRNA target regulation after single or combinatorial miRNA inhibition in human myotubes. Human myoblasts were transfected with the indicated antagomirs and 24 h after transfection differentiation was induced for two days. RNA was isolated for RNA deep sequencing, n = 3. A. Circos plot of differentially expressed genes (p-value < 0.01 and the absolute log2 fold-change >0.5). Each sector of the plot represents a different antagomir or combination of the antagomirs (ant-5x). Genes with predicted binding sites for the respective miRNA are grouped under the darker color in each sector. Log2 fold-changes are presented in red (upregulation) or blue (downregulation). Genes differentially expressed in more than one condition are joined by grey lines or colored lines in case of predicted target genes. B. Enrichment for the predicted target genes (Targetscan) for the indicated miRNAs was analyzed in the group of upregulated genes for the different antagomir conditions using Fisher's Exact Test. C. Regulation of all predicted target genes after single antagomir treatment was plotted against their regulation after the combinatorial antagomir treatment (left panels). Full distribution of target gene regulation (log ratio) is shown using violin plots (right panels). D. Bar plot of GO terms enriched in the upregulated genes after combinatorial antagomir transfection. E. Network of miRNAs and their predicted target genes from the focal adhesion gene cluster. Blue boxes identify predicted target genes of one miRNA that are significantly upregulated after single and combinatorial antagomir inhibition. Green boxes indicate genes predicted to be targeted by at least two miRNAs that are significantly upregulated after the combinatorial antagomir inhibition.
Figure 5
Figure 5
Combinatorial miRNA inhibition during skeletal muscle regeneration improves muscle weight and fiber number in young and aged mice in vivo. Three days following CTX injection in young mice (A) or aged mice (22 months) (C), TA muscles were injected with either control antagomir or a cocktail of the five antagomirs (total amount of 7.5ug per injection [32]). A,C. Muscle weight was measured and muscle cross sections were evaluated 9 days after antagomir injection using anti-laminin and DAPI immunofluorescence (scale bar 50um, n = 5). B. CTX was injected in TA muscles of young and aged mice and TA muscle weight was measured as percent of total body weight at the indicated time points. All results are shown as mean ± SEM, and evaluated with student's t test ∗: p < 0.05, ∗∗: p < 0.01, ∗∗∗: p < 0.001, n = 6–7.
Figure 6
Figure 6
Regulation of the focal adhesion complex by a hierarchical network of miRNAs in myoblasts and its consequences for the myogenic program and insulin-dependent glycogen synthesis during muscle cell differentiation. The yellow triangle reflects the frequency of miRNA target gene cooperativity within the miRNA network.

Similar articles

Cited by

References

    1. Myers J., Prakash M., Froelicher V., Do D., Partington S., Atwood J.E. Exercise capacity and mortality among men referred for exercise testing. New England Journal of Medicine. 2002;346(11):793–801. - PubMed
    1. Shulman G.I. Ectopic fat in insulin resistance, dyslipidemia, and cardiometabolic disease. New England Journal of Medicine. 2014;371(23):2237–2238. - PubMed
    1. Rosenberg I.H. Sarcopenia: origins and clinical relevance. Journal of Nutrition. 1997;127(5 Suppl):990S–991S. - PubMed
    1. Baumgartner R.N., Koehler K.M., Gallagher D., Romero L., Heymsfield S.B., Ross R.R. Epidemiology of sarcopenia among the elderly in New Mexico. American Journal of Epidemiology. 1998;147(8):755–763. - PubMed
    1. von Haehling S., Anker S.D. Cachexia as a major underestimated and unmet medical need: facts and numbers. J Cachexia Sarcopenia Muscle. 2010;1(1):1–5. - PMC - PubMed

Publication types